Varnish Cache
Varnish Cache is an open-source HTTP accelerator and reverse proxy designed to significantly enhance web performance by caching and serving web content swiftly. The Sematext Agent collects Varnish Cache metrics and logs, transmits them to Sematext Cloud; installing the agent takes less than 5 minutes.
Install Sematext Agent
- Create an Varnish Cache Logs or Monitoring App. This will let you install the agent and control access to your monitoring and logs data.
- Install the Sematext Agent according to the https://apps.sematext.com/ui/howto/varnishcache/overview displayed in the UI.
- After installing the agent, discovered logs or metrics from Varnish Cache services detected on the host will start shipping automatically.
- If you've created an Varnish Cache Monitoring App and want to collect Varnish Cache logs as well, or vice versa, click on the Create Logs App button from the left menu panel. This will take you to the Create Logs App (or Monitoring App) page. When you select Use Existing Agent, all discovered log sources from Varnish Cache services are listed, allowing you to set up log and metric shipping easily without any additional installation.
Having both Varnish Cache Logs and Monitoring Apps lets you correlate performance metrics and logs, and accelerate troubleshooting using Split Screen for faster resolution. For example, if you see logs of a node restarting, metrics let you see the impact on the rest of the cluster in terms of CPU, GC, and other metrics. Including query time metrics, even if you don't collect slowlogs from [all] queries.
To explore logs and services across multiple hosts, navigate to Fleet & Discovery > Discovery > Services (or Sematext Cloud Europe). From there, you can create additional Apps or stream data to existing ones without requiring any additional installations.
Important Metrics to Watch and Alert on
Backend Connections and Requests
High backend connections might indicate that your Varnish cache is making frequent requests to the backend servers. This could be due to cache misses, ineffective caching rules, or other issues. Also, if backend connections suddenly spike or drop, it could be a sign of issues such as misconfigurations, network problems, or changes in traffic patterns.
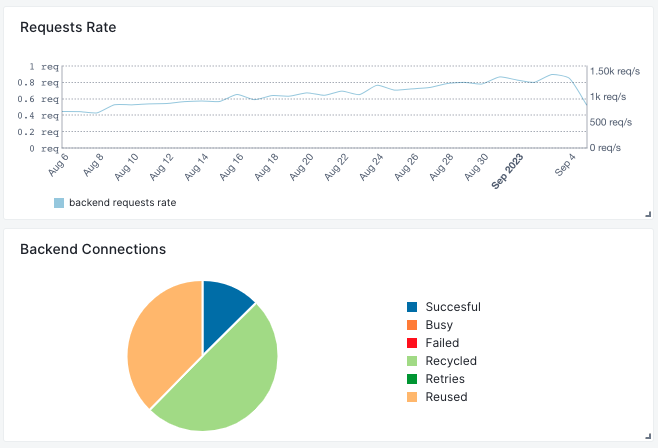
Sudden spikes or drops in the backend request rate can be indicative of issues in your infrastructure, such as sudden traffic spikes, misconfigured cache rules, or even attacks on your system. Also it might imply that your cache is frequently missing and fetching content from the backend.
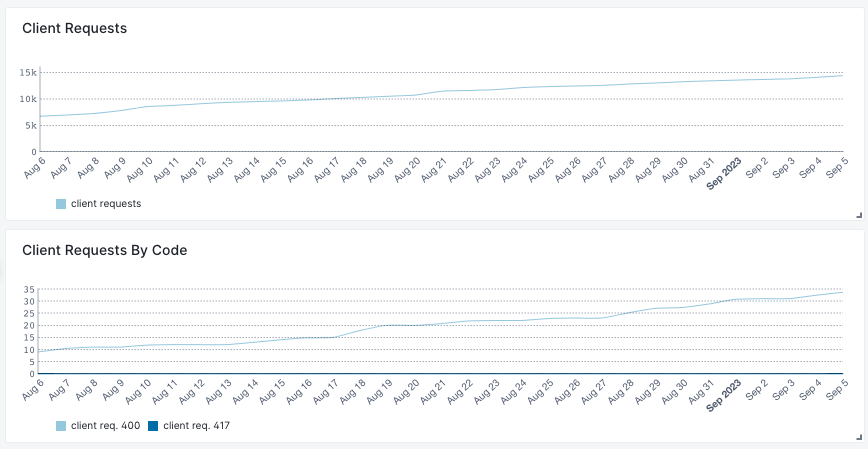
Client Metrics
Monitoring changes in client requests can help you to identify potential problems in your infrastructure. Additionally, tracking client requests by response code allows you to quickly identify and address errors and issues in your applications. Common HTTP response codes like 500 (Internal Server Error) can indicate broken links, missing resources, or server-side problems that need immediate attention.
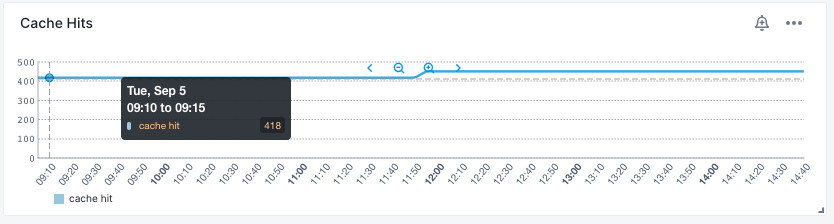
Cache Hits and Misses
Cache hits indicate that Varnish is serving content directly from its cache, reducing the load on backend servers and improving response times. On the other hand, cache misses represent requests that Varnish Cache couldn't fulfill from its cache and had to pass through to the backend. Monitoring these metrics helps assess how efficiently Varnish Cache is utilizing its cache to reduce server load and improve performance.
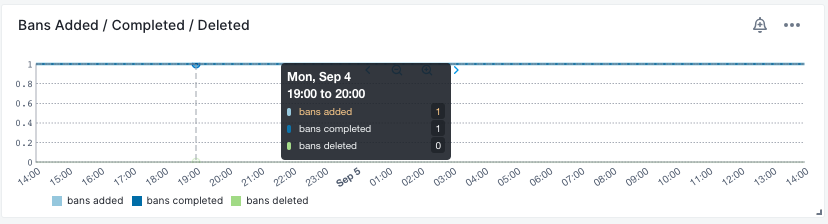
Bans
Bans are a mechanism in Varnish Cache to invalidate or purge specific objects from the cache. Monitoring bans allows you to understand when and why cache invalidations are occurring. This is important to ensure that stale or outdated content is removed from the cache promptly.
Metrics
| Metric Name Key (Type) (Unit) |
description |
|---|---|
| uptime varnish.uptime (counter) (sec) |
Management process uptime |
| child_start varnish.child.start (counter) (sec) |
Child process started |
| child_exit varnish.child.exit (counter) (sec) |
Child process normal exit |
| child_stop varnish.child.stop (counter) (sec) |
Child process unexpected exit |
| child_died varnish.child.died (counter) (sec) |
Child process died (signal) |
| child_dump varnish.child.dump (counter) (sec) |
Child process core dumped |
| child_panic varnish.child.panic (counter) (sec) |
Child process panic |
| summs varnish.summs (counter) (sec) |
stat summ operations |
| uptime varnish.uptime (counter) (sec) |
Child process uptime |
| sess_conn varnish.sess.conn (counter) (sec) |
Sessions accepted |
| sess_fail varnish.sess.fail (counter) (sec) |
Session accept failures |
| sess_fail_econnaborted varnish.sess.fail.econnaborted (counter) (sec) |
Session accept failures: connection aborted |
| sess_fail_eintr varnish.sess.fail.eintr (counter) (sec) |
Session accept failures: interrupted system call |
| sess_fail_emfile varnish.sess.fail.emfile (counter) (sec) |
Session accept failures: too many open files |
| sess_fail_ebadf varnish.sess.fail.ebadf (counter) (sec) |
Session accept failures: bad file descriptor |
| sess_fail_enomem varnish.sess.fail.enomem (counter) (sec) |
Session accept failures: not enough memory |
| sess_fail_other varnish.sess.fail.other (counter) (sec) |
Session accept failures: other |
| client_req_400 varnish.client.req.400 (counter) (sec) |
Client requests received, subject to 400 errors |
| client_req_417 varnish.client.req.417 (counter) (sec) |
Client requests received, subject to 417 errors |
| client_req varnish.client.req (counter) (sec) |
Good client requests received |
| esi_req varnish.esi.req (counter) (sec) |
ESI subrequests |
| cache_hit varnish.cache.hit (counter) (sec) |
Cache hits |
| cache_hit_grace varnish.cache.hit.grace (counter) (sec) |
Cache grace hits |
| cache_hitpass varnish.cache.hitpass (counter) (sec) |
Cache hits for pass. |
| cache_hitmiss varnish.cache.hitmiss (counter) (sec) |
Cache hits for miss. |
| cache_miss varnish.cache.miss (counter) (sec) |
Cache misses |
| beresp_uncacheable varnish.beresp.uncacheable (counter) (sec) |
Uncacheable backend responses |
| beresp_shortlived varnish.beresp.shortlived (counter) (sec) |
Shortlived objects |
| backend_conn varnish.backend.conn (counter) (sec) |
Backend conn. success |
| backend_unhealthy varnish.backend.unhealthy (counter) (sec) |
Backend conn. not attempted |
| backend_busy varnish.backend.busy (counter) (sec) |
Backend conn. too many |
| backend_fail varnish.backend.fail (counter) (sec) |
Backend conn. failures |
| backend_reuse varnish.backend.reuse (counter) (sec) |
Backend conn. reuses |
| backend_recycle varnish.backend.recycle (counter) (sec) |
Backend conn. recycles |
| backend_retry varnish.backend.retry (counter) (sec) |
Backend conn. retry |
| fetch_head varnish.fetch.head (counter) (sec) |
Fetch no body (HEAD) |
| fetch_length varnish.fetch.length (counter) (sec) |
Fetch with Length |
| fetch_chunked varnish.fetch.chunked (counter) (sec) |
Fetch chunked |
| fetch_eof varnish.fetch.eof (counter) (sec) |
Fetch EOF |
| fetch_bad varnish.fetch.bad (counter) (sec) |
Fetch bad T-E |
| fetch_none varnish.fetch.none (counter) (sec) |
Fetch no body |
| fetch_1xx varnish.fetch.1xx (counter) (sec) |
Fetch no body (1xx) |
| fetch_204 varnish.fetch.204 (counter) (sec) |
Fetch no body (204) |
| fetch_304 varnish.fetch.304 (counter) (sec) |
Fetch no body (304) |
| fetch_failed varnish.fetch.failed (counter) (sec) |
Fetch failed (all causes) |
| fetch_no_thread varnish.fetch.no.thread (counter) (sec) |
Fetch failed (no thread) |
| pools varnish.pools (gauge) (sec) |
Number of thread pools |
| threads varnish.threads (gauge) (sec) |
Total number of threads |
| threads_limited varnish.threads.limited (counter) (sec) |
Threads hit max |
| threads_created varnish.threads.created (counter) (sec) |
Threads created |
| threads_destroyed varnish.threads.destroyed (counter) (sec) |
Threads destroyed |
| threads_failed varnish.threads.failed (counter) (sec) |
Thread creation failed |
| thread_queue_len varnish.thread.queue.len (gauge) (sec) |
Length of session queue |
| busy_sleep varnish.busy.sleep (counter) (sec) |
Number of requests sent to sleep on busy objhdr |
| busy_wakeup varnish.busy.wakeup (counter) (sec) |
Number of requests woken after sleep on busy objhdr |
| busy_killed varnish.busy.killed (counter) (sec) |
Number of requests killed after sleep on busy objhdr |
| sess_queued varnish.sess.queued (counter) (sec) |
Sessions queued for thread |
| sess_dropped varnish.sess.dropped (counter) (sec) |
Sessions dropped for thread |
| req_dropped varnish.req.dropped (counter) (sec) |
Requests dropped |
| n_object varnish.n.object (gauge) (sec) |
object structs made |
| n_vampireobject varnish.n.vampireobject (gauge) (sec) |
unresurrected objects |
| n_objectcore varnish.n.objectcore (gauge) (sec) |
objectcore structs made |
| n_objecthead varnish.n.objecthead (gauge) (sec) |
objecthead structs made |
| n_backend varnish.n.backend (gauge) (sec) |
Number of backends |
| n_expired varnish.n.expired (counter) (sec) |
Number of expired objects |
| n_lru_nuked varnish.n.lru.nuked (counter) (sec) |
Number of LRU nuked objects |
| n_lru_moved varnish.n.lru.moved (counter) (sec) |
Number of LRU moved objects |
| n_lru_limited varnish.n.lru.limited (counter) (sec) |
Reached nuke_limit |
| losthdr varnish.losthdr (counter) (sec) |
HTTP header overflows |
| s_sess varnish.s.sess (counter) (sec) |
Total sessions seen |
| n_pipe varnish.n.pipe (gauge) (sec) |
Number of ongoing pipe sessions |
| pipe_limited varnish.pipe.limited (counter) (sec) |
Pipes hit pipe_sess_max |
| s_pipe varnish.s.pipe (counter) (sec) |
Total pipe sessions seen |
| s_pass varnish.s.pass (counter) (sec) |
Total pass-ed requests seen |
| s_fetch varnish.s.fetch (counter) (sec) |
Total backend fetches initiated |
| s_bgfetch varnish.s.bgfetch (counter) (sec) |
Total backend background fetches initiated |
| s_synth varnish.s.synth (counter) (sec) |
Total synthetic responses made |
| s_req_hdrbytes varnish.s.req.hdrbytes (counter) (sec) |
Request header bytes |
| s_req_bodybytes varnish.s.req.bodybytes (counter) (sec) |
Request body bytes |
| s_resp_hdrbytes varnish.s.resp.hdrbytes (counter) (sec) |
Response header bytes |
| s_resp_bodybytes varnish.s.resp.bodybytes (counter) (sec) |
Response body bytes |
| s_pipe_hdrbytes varnish.s.pipe.hdrbytes (counter) (sec) |
Pipe request header bytes |
| s_pipe_in varnish.s.pipe.in (counter) (sec) |
Piped bytes from client |
| s_pipe_out varnish.s.pipe.out (counter) (sec) |
Piped bytes to client |
| sess_closed varnish.sess.closed (counter) (sec) |
Session Closed |
| sess_closed_err varnish.sess.closed.err (counter) (sec) |
Session Closed with error |
| sess_readahead varnish.sess.readahead (counter) (sec) |
Session Read Ahead |
| sess_herd varnish.sess.herd (counter) (sec) |
Session herd |
| sc_rem_close varnish.sc.rem.close (counter) (sec) |
Session OK REM_CLOSE |
| sc_req_close varnish.sc.req.close (counter) (sec) |
Session OK REQ_CLOSE |
| sc_req_http10 varnish.sc.req.http10 (counter) (sec) |
Session Err REQ_HTTP10 |
| sc_rx_bad varnish.sc.rx.bad (counter) (sec) |
Session Err RX_BAD |
| sc_rx_body varnish.sc.rx.body (counter) (sec) |
Session Err RX_BODY |
| sc_rx_junk varnish.sc.rx.junk (counter) (sec) |
Session Err RX_JUNK |
| sc_rx_overflow varnish.sc.rx.overflow (counter) (sec) |
Session Err RX_OVERFLOW |
| sc_rx_timeout varnish.sc.rx.timeout (counter) (sec) |
Session Err RX_TIMEOUT |
| sc_rx_close_idle varnish.sc.rx.close.idle (counter) (sec) |
Session Err RX_CLOSE_IDLE |
| sc_tx_pipe varnish.sc.tx.pipe (counter) (sec) |
Session OK TX_PIPE |
| sc_tx_error varnish.sc.tx.error (counter) (sec) |
Session Err TX_ERROR |
| sc_tx_eof varnish.sc.tx.eof (counter) (sec) |
Session OK TX_EOF |
| sc_resp_close varnish.sc.resp.close (counter) (sec) |
Session OK RESP_CLOSE |
| sc_overload varnish.sc.overload (counter) (sec) |
Session Err OVERLOAD |
| sc_pipe_overflow varnish.sc.pipe.overflow (counter) (sec) |
Session Err PIPE_OVERFLOW |
| sc_range_short varnish.sc.range.short (counter) (sec) |
Session Err RANGE_SHORT |
| sc_req_http20 varnish.sc.req.http20 (counter) (sec) |
Session Err REQ_HTTP20 |
| sc_vcl_failure varnish.sc.vcl.failure (counter) (sec) |
Session Err VCL_FAILURE |
| client_resp_500 varnish.client.resp.500 (counter) (sec) |
Delivery failed due to insufficient workspace. |
| ws_backend_overflow varnish.ws.backend.overflow (counter) (sec) |
workspace_backend overflows |
| ws_client_overflow varnish.ws.client.overflow (counter) (sec) |
workspace_client overflows |
| ws_thread_overflow varnish.ws.thread.overflow (counter) (sec) |
workspace_thread overflows |
| ws_session_overflow varnish.ws.session.overflow (counter) (sec) |
workspace_session overflows |
| shm_records varnish.shm.records (counter) (sec) |
SHM records |
| shm_writes varnish.shm.writes (counter) (sec) |
SHM writes |
| shm_flushes varnish.shm.flushes (counter) (sec) |
SHM flushes due to overflow |
| shm_cont varnish.shm.cont (counter) (sec) |
SHM MTX contention |
| shm_cycles varnish.shm.cycles (counter) (sec) |
SHM cycles through buffer |
| backend_req varnish.backend.req (counter) (sec) |
Backend requests made |
| n_vcl varnish.n.vcl (gauge) (sec) |
Number of loaded VCLs in total |
| n_vcl_avail varnish.n.vcl.avail (gauge) (sec) |
Number of VCLs available |
| n_vcl_discard varnish.n.vcl.discard (gauge) (sec) |
Number of discarded VCLs |
| vcl_fail varnish.vcl.fail (counter) (sec) |
VCL failures |
| bans varnish.bans (gauge) (sec) |
Count of bans |
| bans_completed varnish.bans.completed (gauge) (sec) |
Number of bans marked 'completed' |
| bans_obj varnish.bans.obj (gauge) (sec) |
Number of bans using obj.* |
| bans_req varnish.bans.req (gauge) (sec) |
Number of bans using req.* |
| bans_added varnish.bans.added (counter) (sec) |
Bans added |
| bans_deleted varnish.bans.deleted (counter) (sec) |
Bans deleted |
| bans_tested varnish.bans.tested (counter) (sec) |
Bans tested against objects (lookup) |
| bans_obj_killed varnish.bans.obj.killed (counter) (sec) |
Objects killed by bans (lookup) |
| bans_lurker_tested varnish.bans.lurker.tested (counter) (sec) |
Bans tested against objects (lurker) |
| bans_tests_tested varnish.bans.tests.tested (counter) (sec) |
Ban tests tested against objects (lookup) |
| bans_lurker_tests_tested varnish.bans.lurker.tests.tested (counter) (sec) |
Ban tests tested against objects (lurker) |
| bans_lurker_obj_killed varnish.bans.lurker.obj.killed (counter) (sec) |
Objects killed by bans (lurker) |
| bans_lurker_obj_killed_cutoff varnish.bans.lurker.obj.killed.cutoff (counter) (sec) |
Objects killed by bans for cutoff (lurker) |
| bans_dups varnish.bans.dups (counter) (sec) |
Bans superseded by other bans |
| bans_lurker_contention varnish.bans.lurker.contention (counter) (sec) |
Lurker gave way for lookup |
| bans_persisted_bytes varnish.bans.persisted.bytes (gauge) (sec) |
Bytes used by the persisted ban lists |
| bans_persisted_fragmentation varnish.bans.persisted.fragmentation (gauge) (sec) |
Extra bytes in persisted ban lists due to fragmentation |
| n_purges varnish.n.purges (counter) (sec) |
Number of purge operations executed |
| n_obj_purged varnish.n.obj.purged (counter) (sec) |
Number of purged objects |
| exp_mailed varnish.exp.mailed (counter) (sec) |
Number of objects mailed to expiry thread |
| exp_received varnish.exp.received (counter) (sec) |
Number of objects received by expiry thread |
| hcb_nolock varnish.hcb.nolock (counter) (sec) |
HCB Lookups without lock |
| hcb_lock varnish.hcb.lock (counter) (sec) |
HCB Lookups with lock |
| hcb_insert varnish.hcb.insert (counter) (sec) |
HCB Inserts |
| esi_errors varnish.esi.errors (counter) (sec) |
ESI parse errors (unlock) |
| esi_warnings varnish.esi.warnings (counter) (sec) |
ESI parse warnings (unlock) |
| vmods varnish.vmods (gauge) (sec) |
Loaded VMODs |
| n_gzip varnish.n.gzip (counter) (sec) |
Gzip operations |
| n_gunzip varnish.n.gunzip (counter) (sec) |
Gunzip operations |
| n_test_gunzip varnish.n.test.gunzip (counter) (sec) |
Test gunzip operations |
| ban_creat varnish.ban.creat (counter) (sec) |
Created locks |
| ban_destroy varnish.ban.destroy (counter) (sec) |
Destroyed locks |
| ban_locks varnish.ban.locks (counter) (sec) |
Lock Operations |
| ban_dbg_busy varnish.ban.dbg.busy (counter) (sec) |
Contended lock operations |
| ban_dbg_try_fail varnish.ban.dbg.try.fail (counter) (sec) |
Contended trylock operations |
| busyobj_creat varnish.busyobj.creat (counter) (sec) |
Created locks |
| busyobj_destroy varnish.busyobj.destroy (counter) (sec) |
Destroyed locks |
| busyobj_locks varnish.busyobj.locks (counter) (sec) |
Lock Operations |
| busyobj_dbg_busy varnish.busyobj.dbg.busy (counter) (sec) |
Contended lock operations |
| busyobj_dbg_try_fail varnish.busyobj.dbg.try.fail (counter) (sec) |
Contended trylock operations |
| cli_creat varnish.cli.creat (counter) (sec) |
Created locks |
| cli_destroy varnish.cli.destroy (counter) (sec) |
Destroyed locks |
| cli_locks varnish.cli.locks (counter) (sec) |
Lock Operations |
| cli_dbg_busy varnish.cli.dbg.busy (counter) (sec) |
Contended lock operations |
| cli_dbg_try_fail varnish.cli.dbg.try.fail (counter) (sec) |
Contended trylock operations |
| mempool_creat varnish.mempool.creat (counter) (sec) |
Created locks |
| mempool_destroy varnish.mempool.destroy (counter) (sec) |
Destroyed locks |
| mempool_locks varnish.mempool.locks (counter) (sec) |
Lock Operations |
| mempool_dbg_busy varnish.mempool.dbg.busy (counter) (sec) |
Contended lock operations |
| mempool_dbg_try_fail varnish.mempool.dbg.try.fail (counter) (sec) |
Contended trylock operations |
| busyobj_live varnish.busyobj.live (gauge) (sec) |
In use |
| busyobj_pool varnish.busyobj.pool (gauge) (sec) |
In Pool |
| busyobj_sz_wanted varnish.busyobj.sz.wanted (gauge) (sec) |
Size requested |
| busyobj_sz_actual varnish.busyobj.sz.actual (gauge) (sec) |
Size allocated |
| busyobj_allocs varnish.busyobj.allocs (counter) (sec) |
Allocations |
| busyobj_frees varnish.busyobj.frees (counter) (sec) |
Frees |
| busyobj_recycle varnish.busyobj.recycle (counter) (sec) |
Recycled from pool |
| busyobj_timeout varnish.busyobj.timeout (counter) (sec) |
Timed out from pool |
| busyobj_toosmall varnish.busyobj.toosmall (counter) (sec) |
Too small to recycle |
| busyobj_surplus varnish.busyobj.surplus (counter) (sec) |
Too many for pool |
| busyobj_randry varnish.busyobj.randry (counter) (sec) |
Pool ran dry |
| boot_default_happy varnish.boot.default.happy (double_gauge (sec)) (sec) |
Happy health probes |
| boot_default_bereq_hdrbytes varnish.boot.default.bereq.hdrbytes (counter) (sec) |
Request header bytes |
| boot_default_bereq_bodybytes varnish.boot.default.bereq.bodybytes (counter) (sec) |
Request body bytes |
| boot_default_beresp_hdrbytes varnish.boot.default.beresp.hdrbytes (counter) (sec) |
Response header bytes |
| boot_default_beresp_bodybytes varnish.boot.default.beresp.bodybytes (counter) (sec) |
Response body bytes |
| boot_default_pipe_hdrbytes varnish.boot.default.pipe.hdrbytes (counter) (sec) |
Pipe request header bytes |
| boot_default_pipe_out varnish.boot.default.pipe.out (counter) (sec) |
Piped bytes to backend |
| boot_default_pipe_in varnish.boot.default.pipe.in (counter) (sec) |
Piped bytes from backend |
| boot_default_conn varnish.boot.default.conn (gauge) (sec) |
Concurrent connections used |
| boot_default_req varnish.boot.default.req (counter) (sec) |
Backend requests sent |
| boot_default_unhealthy varnish.boot.default.unhealthy (counter) (sec) |
Fetches not attempted due to backend being unhealthy |
| boot_default_busy varnish.boot.default.busy (counter) (sec) |
Fetches not attempted due to backend being busy |
| boot_default_fail varnish.boot.default.fail (counter) (sec) |
Connections failed |
| boot_default_fail_eacces varnish.boot.default.fail.eacces (counter) (sec) |
Connections failed with EACCES or EPERM |
| boot_default_fail_eaddrnotavail varnish.boot.default.fail.eaddrnotavail (counter) (sec) |
Connections failed with EADDRNOTAVAIL |
| boot_default_fail_econnrefused varnish.boot.default.fail.econnrefused (counter) (sec) |
Connections failed with ECONNREFUSED |
| boot_default_fail_enetunreach varnish.boot.default.fail.enetunreach (counter) (sec) |
Connections failed with ENETUNREACH |
| boot_default_fail_etimedout varnish.boot.default.fail.etimedout (counter) (sec) |
Connections failed ETIMEDOUT |
| boot_default_fail_other varnish.boot.default.fail.other (counter) (sec) |
Connections failed for other reason |
| boot_default_helddown varnish.boot.default.helddown (counter) (sec) |
Connection opens not attempted |
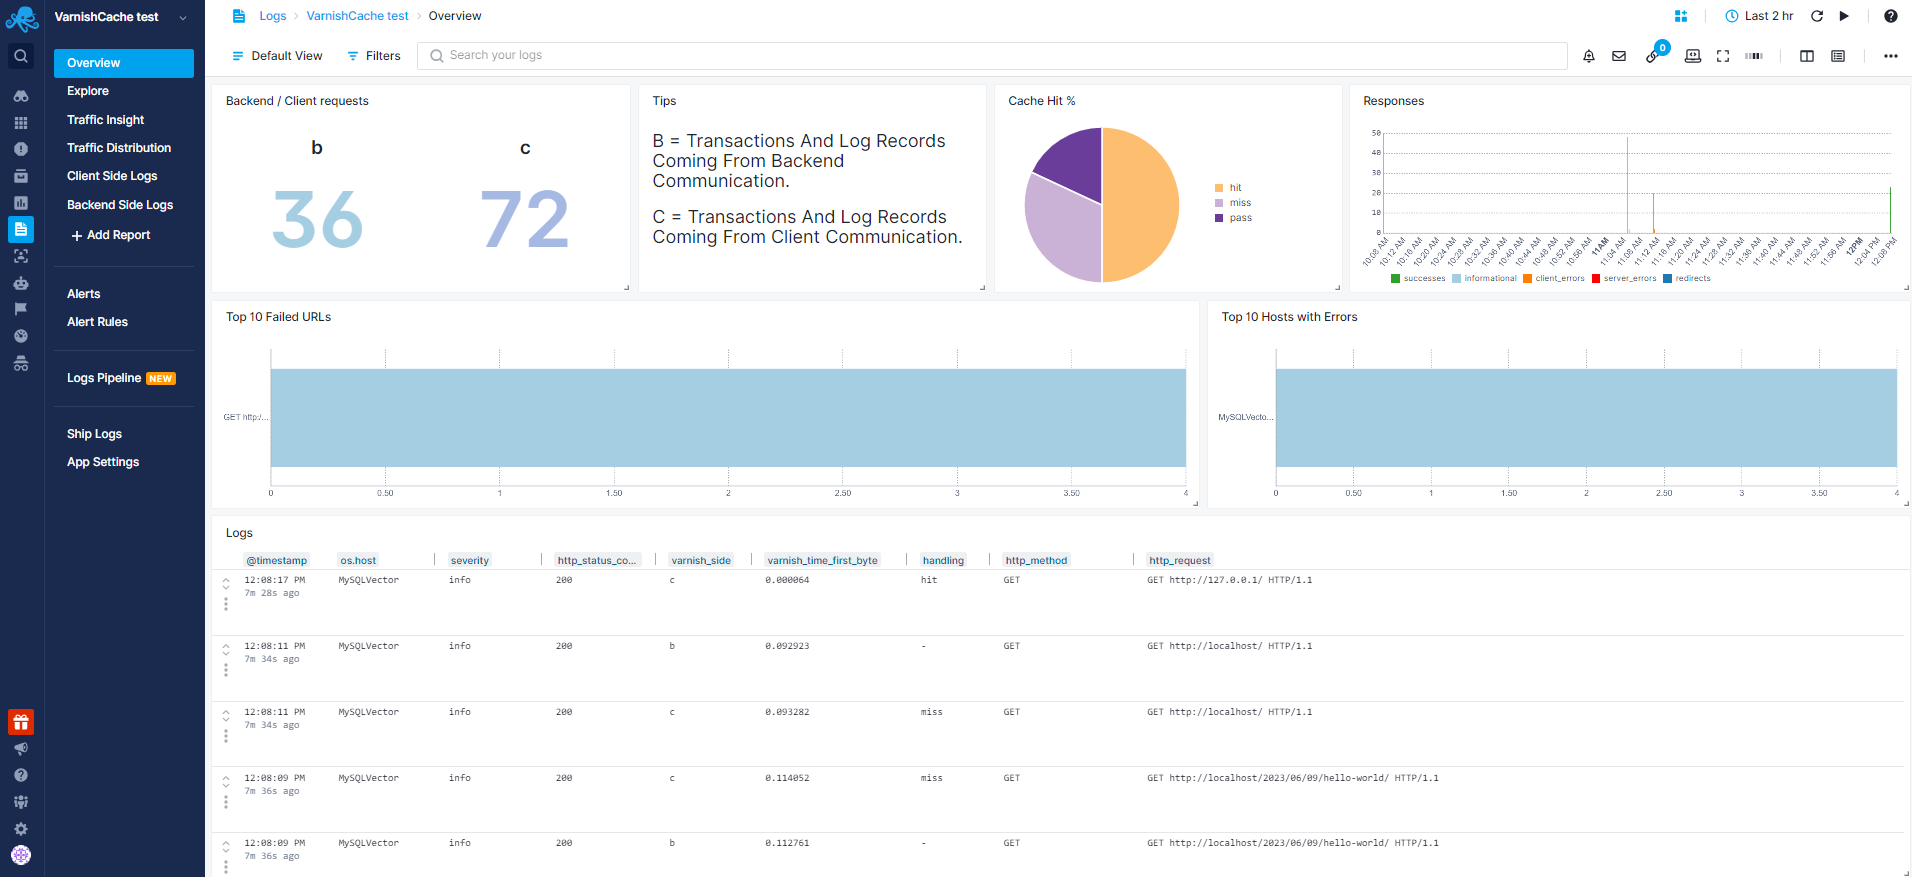
Logs
Log Collection
- To enable Varnish logging uncomment the following in
/etc/default/varnishncsa:
- Create
st_varnishncsa_formatfile and add the following:
"Timestamp": "%t", "network_client_ip": "%h", "varnish_hit_miss": "%{Varnish:hitmiss}x", "varnish_side": "%{Varnish:side}x", "age": %{age}o, "handling": "%{Varnish:handling}x", "http_request": "%r", "varnish_time_first_byte": %{Varnish:time_firstbyte}x, "http_method": "%m", "http_status_code": %s, "response_reason": "%{VSL:RespReason}x", "fetch_error": "%{VSL:FetchError}x", "x_forwarded_for": "%{x-forwarded-for}i", "remote_user": "%u", "network_bytes_written": "%b", "http_response_time": %D, "http_user_agent": "%{User-agent}i", "http_referer": "%{Referer}i", "x_varnish": "%{x-varnish}o", "x_magento_yags": "%{x-magento-tags}o"
- Execute the
sudo systemctl edit varnishncsacommand to editExecStartproperty and paste the following:
[Service]
ExecStart=
ExecStart=/usr/bin/varnishncsa -a -w /var/log/varnish/varnishncsa.log -D -c -b -f /home/user/st_varnishncsa_format -P /run/varnishncsa/varnishncsa.pid
st_varnishncsa_format file in the command above. In this example, the file was located within the /home/user directory.
- Restart the varnishncsa to apply the changes.
Exploring logs
Once data is in, you can explore it via the built-in reports or create your own. Moreover, the pre-configured anomaly alert rules will notify you about increasing 4xx and 5xx response rates.
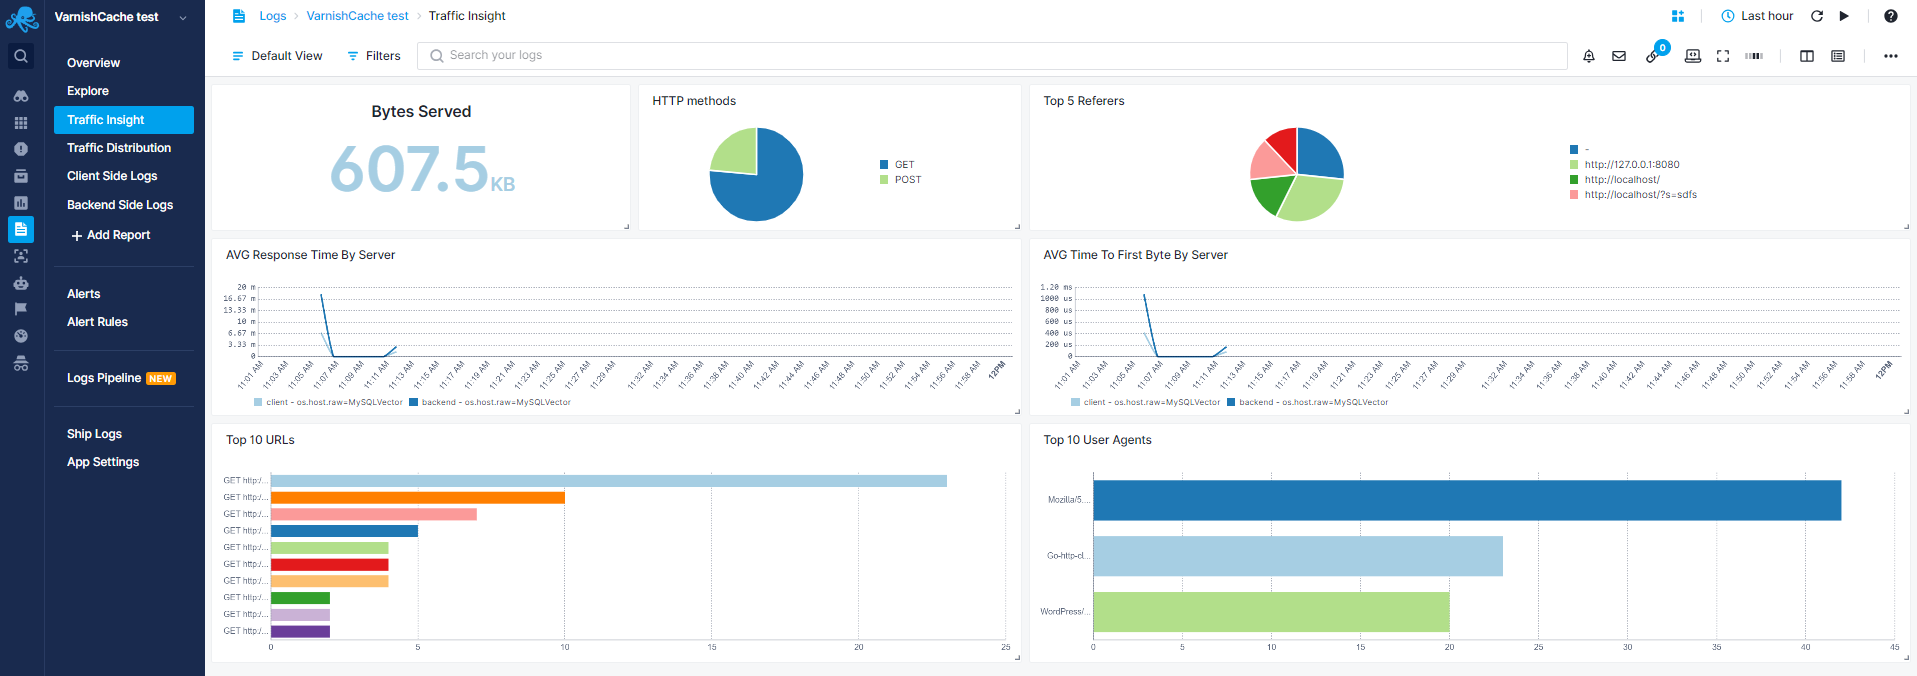
Traffic Insight Report
You can use the Traffic Insight report to see top clients, referrers, average response time and time to serve the first byte based on servers and "zoom in" to the ones you're interested in:
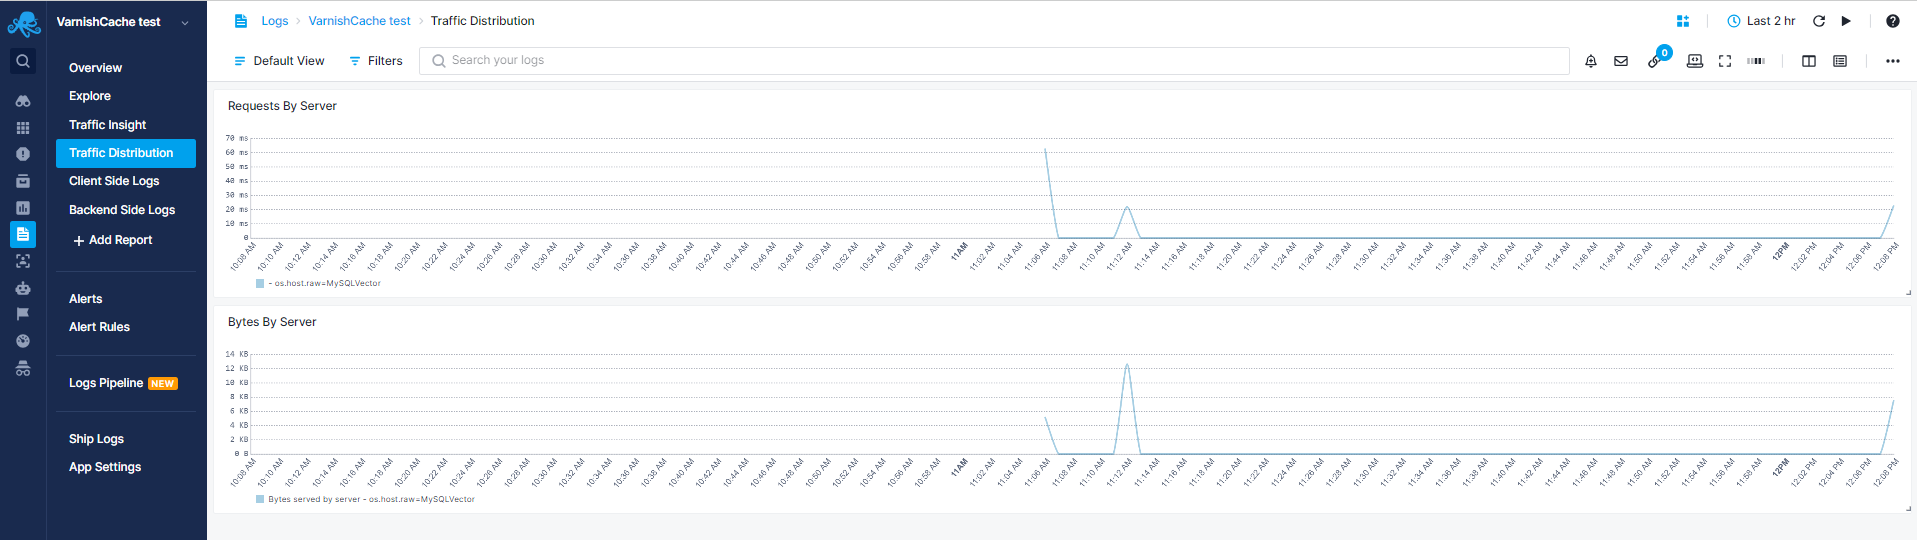
Traffic Distribution Report
You can use the Traffic Distribution report to see the traffic distribution across servers for resource planning by analyzing data volume and bytes served:
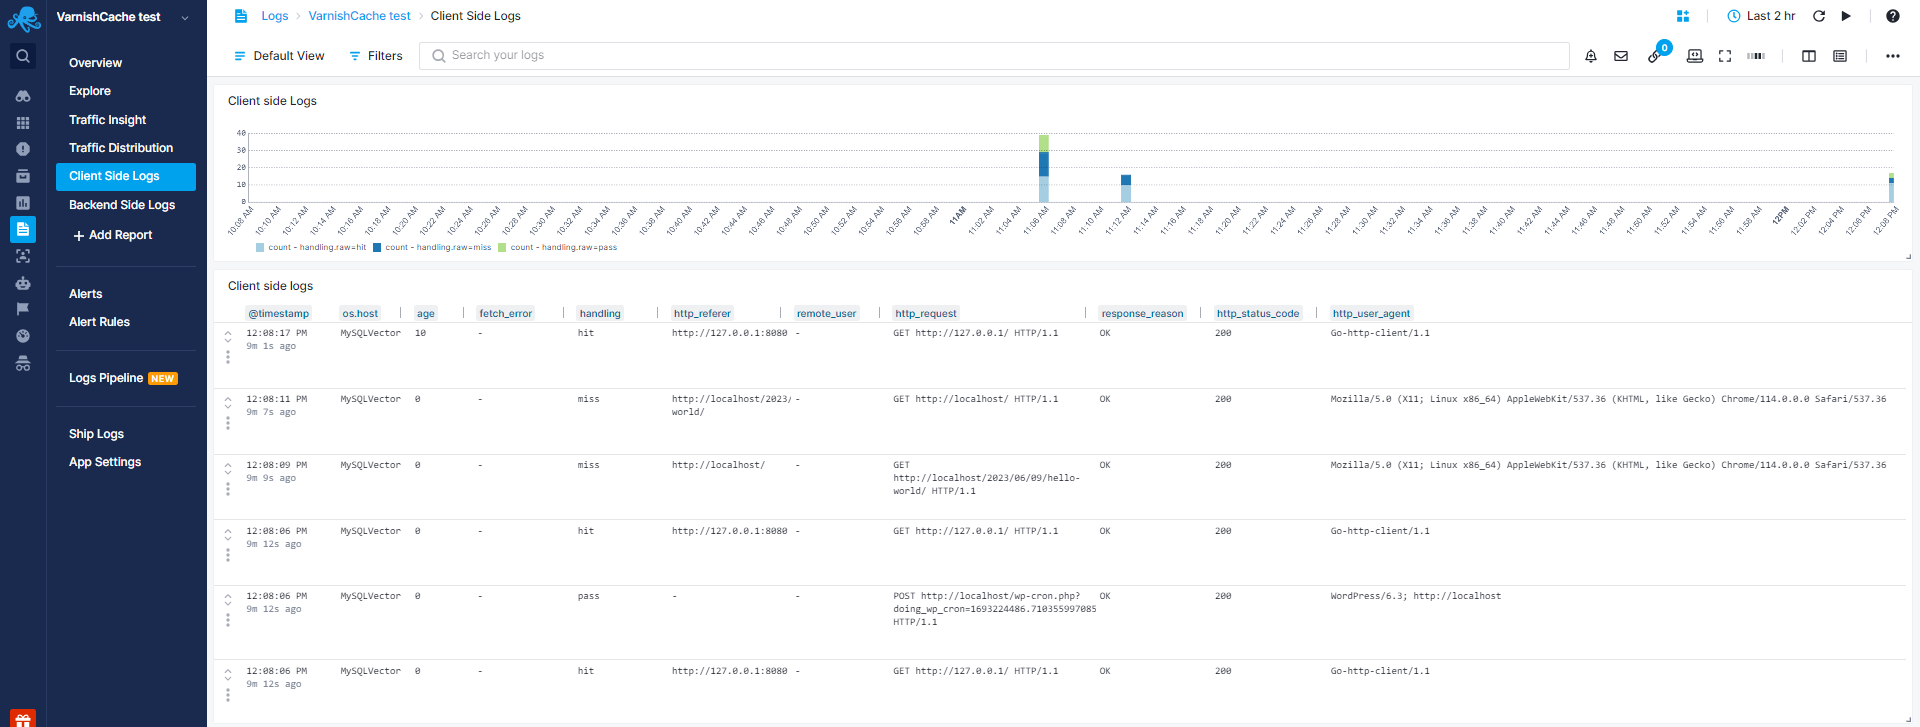
Client Side Logs Report
You can use the Client Side Logs report to see the requests made to the client side:
Backend Side Logs Report
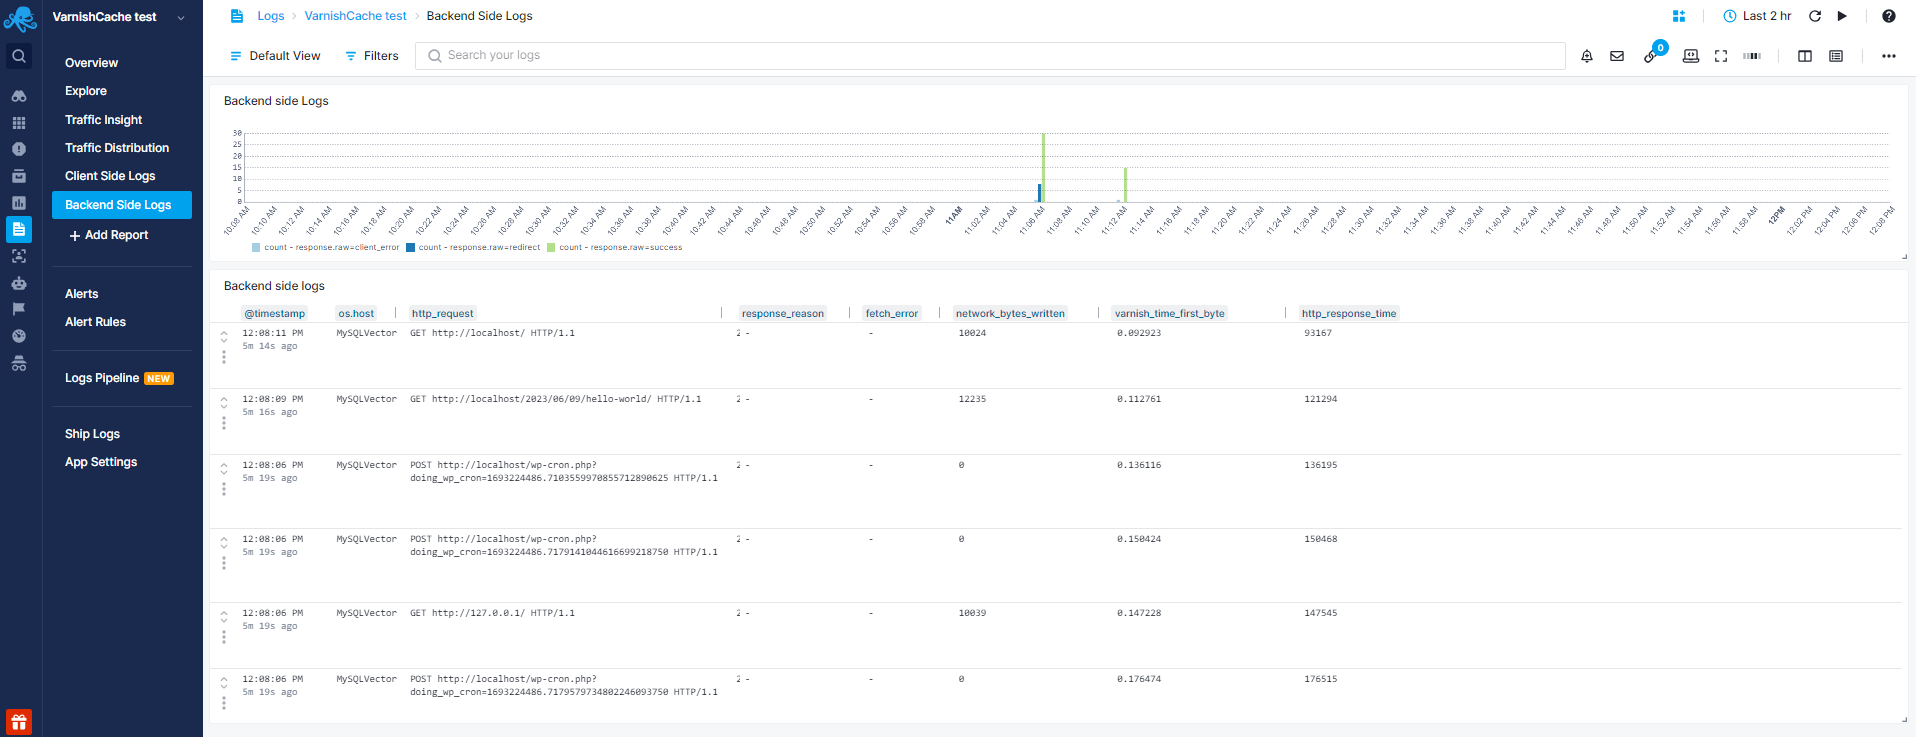
You can use the Backend Side Logs report to see the requests made to the backend side:
Troubleshooting
If you have trouble sending logs, try out the latest version of Sematext Agent. Also, make sure Sematext Agent is configured to send logs to your Varnish Cache Logs App. Lastly, check the Log Agents panel for any errors, and refer to our Sematext Logs FAQ for useful tips.
If you are having trouble sending metrics, try out the latest version of the Sematext Agent. Additionally, make sure to check out the Agents Information panel for any errors, and refer to our Sematext Monitoring FAQ for useful tips.
Varnish Permissions
In case you encounter issues getting metrics from Varnish Cache, make sure that the Sematext spmon user is a member of the varnish group. It can be added using the command below:
sudo usermod -a -G varnish spmmon