JVM
JVM is an abstract computing machine enabling Java bytecode execution and providing a runtime environment for Java applications. The Sematext Agent collects JVM metrics (heap, threads,garbage collection counts, times, etc.) and JVM garbage collection logs, transmits them to Sematext Cloud, where everything is visualized and alerted on with pre-built dashboards and alerts, both of which you can customize. Installing the agent takes less than 5 minutes.
Install Sematext Agent
- Create a JVM Logs or Monitoring App. This will let you install the agent and control access to your monitoring and logs data.
- Install the Sematext Agent according to the https://apps.sematext.com/ui/howto/JVM/overview displayed in the UI.
- After installing the agent, the Discovery tab shows all the JVMs identified on the host and you will start receiving metrics or garbage collection logs from JVM services.
- If you've created a JVM Monitoring App and want to collect JVM garbage collection logs as well, or vice versa, click on the Create Logs App button from the left menu panel. This will navigate you to the 'Create Logs App' (or Monitoring App) page, where you'll find all the discovered log sources from JVM services and manage log and metric shipping effortlessly.
Having both JVM Logs and Monitoring Apps lets you correlate performance metrics and logs, and accelerate troubleshooting using Split Screen for faster resolution. For example, correlating JVM memory metrics (heap usage, garbage collection frequency) with garbage collection logs (types of garbage collections, pause times), you can identify memory allocation patterns, potential memory leaks, or inefficient memory utilization. This correlation helps optimize memory settings, tune garbage collection strategies, and prevent memory-related performance issues.
To explore logs and services across multiple hosts, navigate to Fleet & Discovery > Discovery > Services (or Sematext Cloud Europe). From there, you can create additional Apps or stream data to existing ones without requiring any additional installations.
Metrics
| Metric Name Key (Type) (Unit) |
Description |
|---|---|
| gc collection count jvm.gc.collection.count (long counter) |
count of GC collections |
| gc collection time jvm.gc.collection.time (long counter) (ms) |
duration of GC collections |
| open files jvm.files.open (long gauge) |
jvm currently open files |
| max open files jvm.files.max (long gauge) |
jvm max open files limit |
| jvm heap used jvm.heap.used (long gauge) (bytes) |
jvm heap used memory |
| jvm non-heap used jvm.nonheap.used (long gauge) (bytes) |
jvm non-heap used memory |
| jvm pool used jvm.pool.used (long gauge) (bytes) |
jvm pool used memory |
| jvm pool used max jvm.pool.max (long gauge) (bytes) |
jvm pool max memory |
| jvm threads jvm.threads (long gauge) |
current jvm thread count |
| jvm peak threads jvm.threads.peak (long gauge) |
peak jvm thread count |
| jvm daemon threads jvm.threads.deamon (long gauge) |
current jvm daemon thread count |
| jvm total started threads jvm.threads.started.total (long gauge) |
total started jvm thread count |
Logs
Once data is in, you can explore it via the built-in reports:
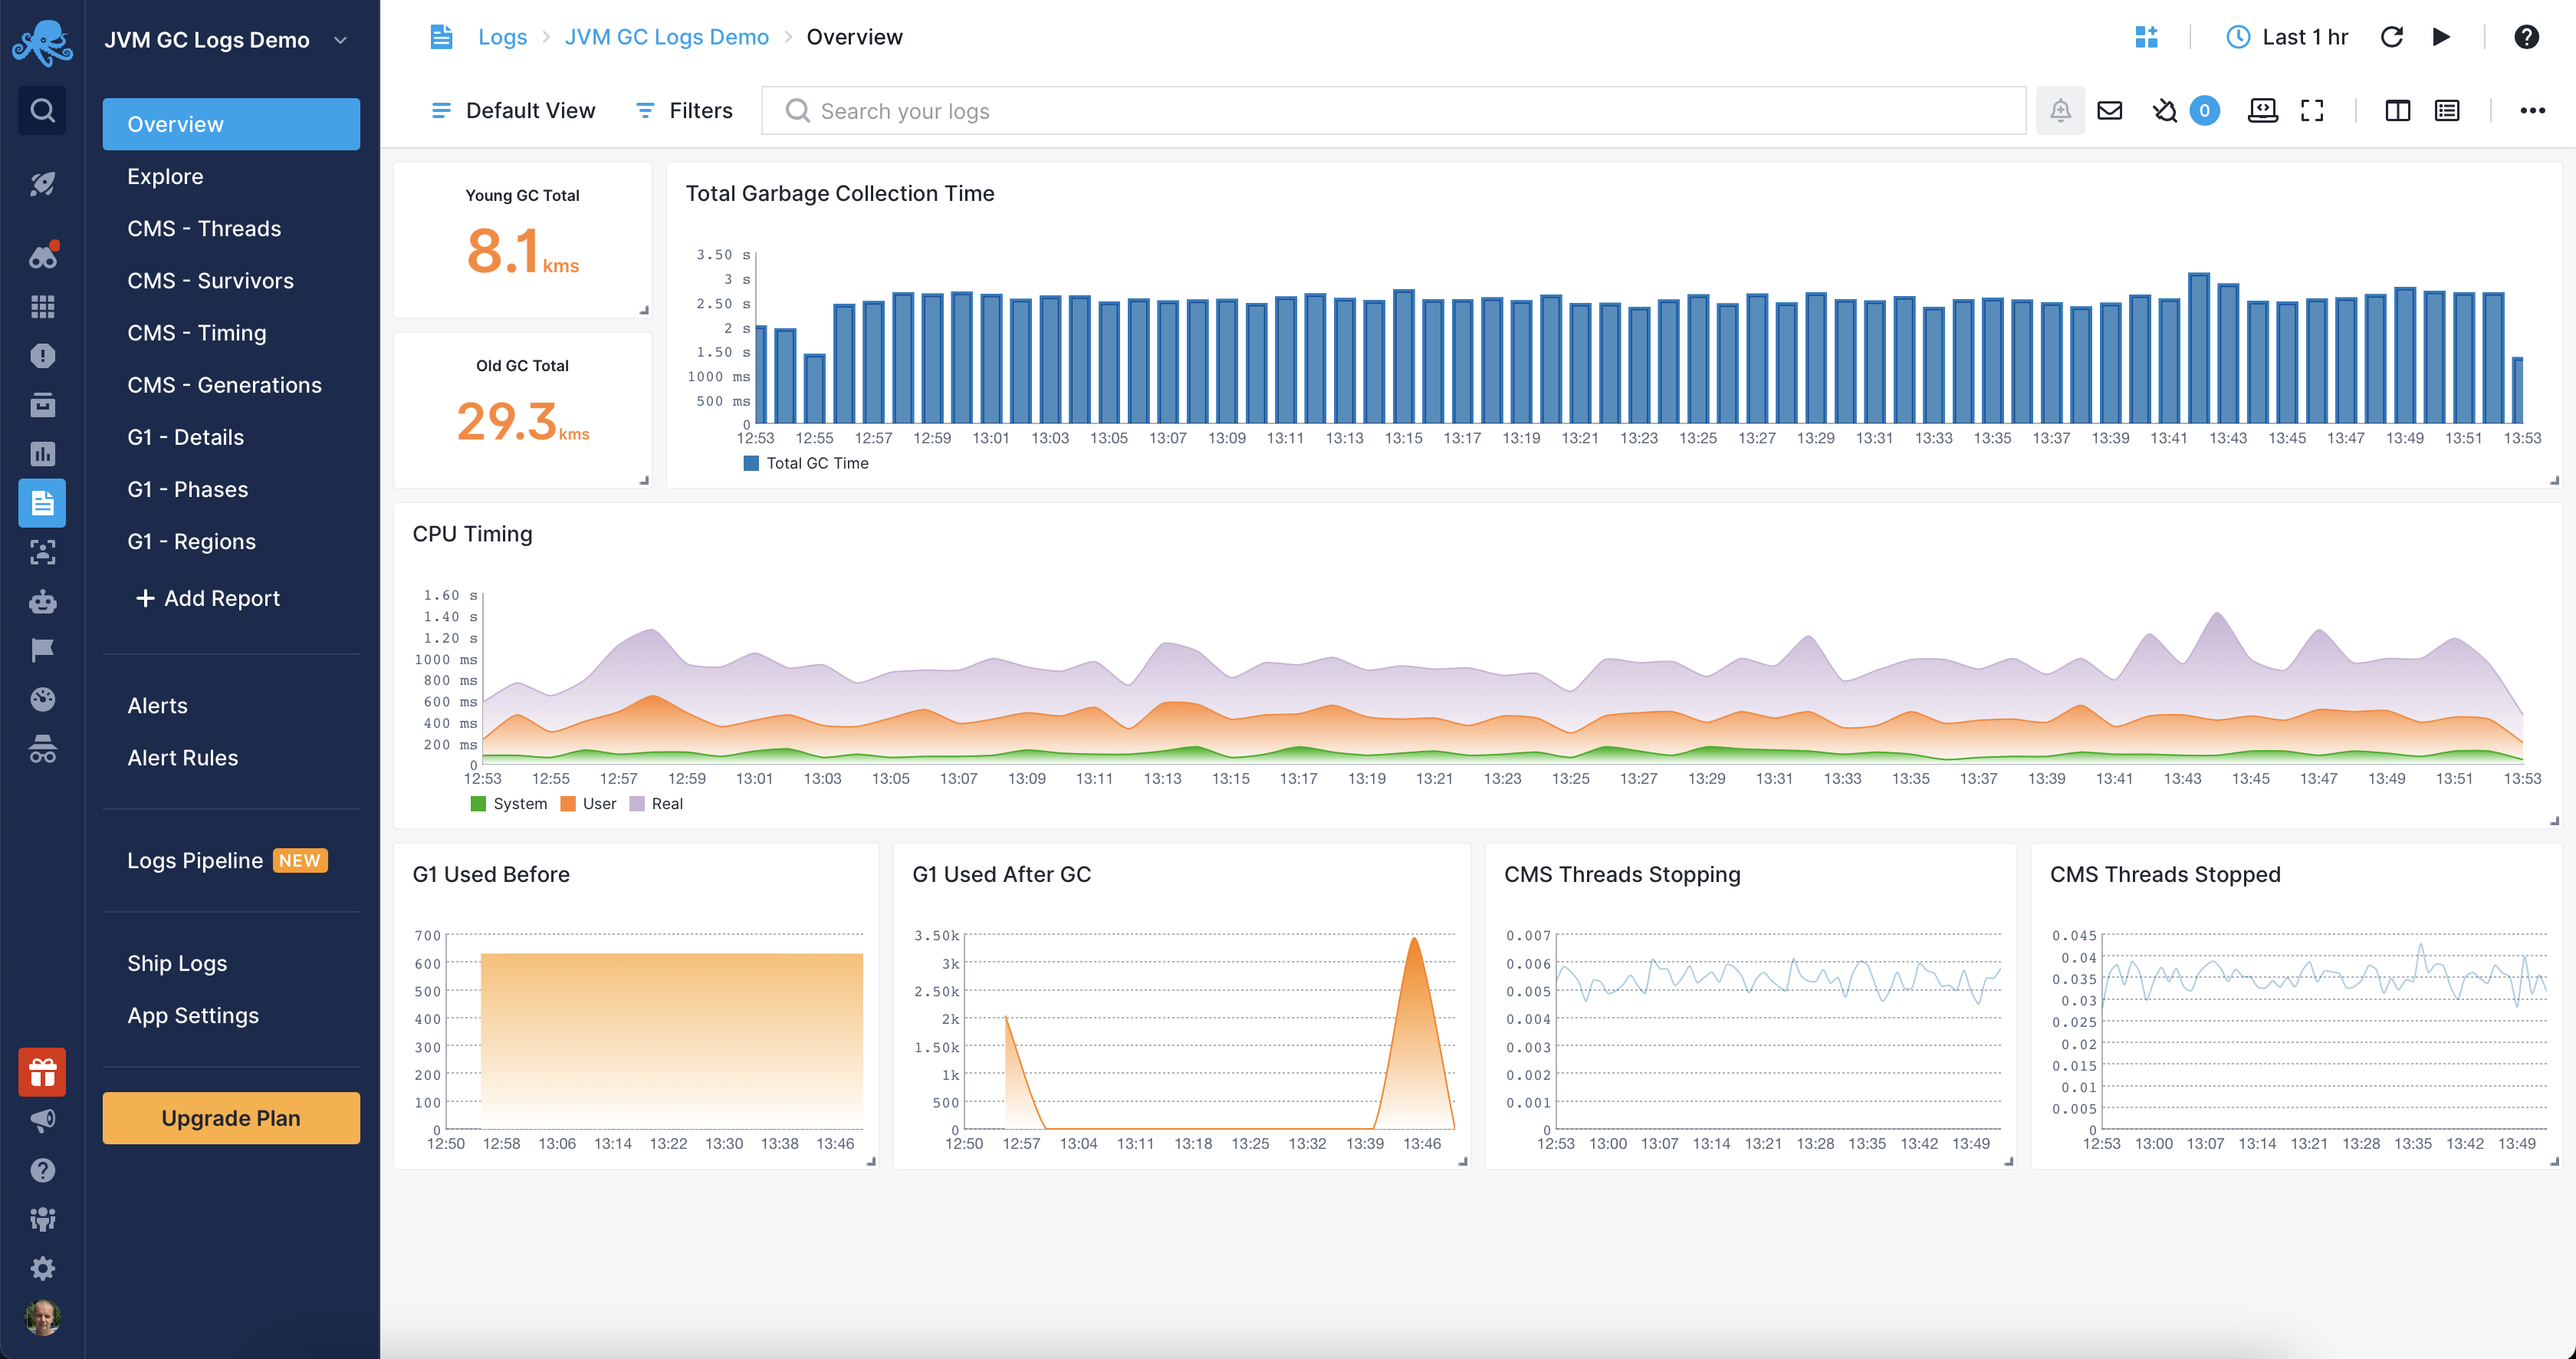
Sematext can collect JVM performance metrics and extract valuable data about garbage collection from JVM logs, providing complete insights into your JVM-based applications.
Exploring Logs
You can explore garbage collection performance using the built-in reports or create your own. For example, you can use the G1GC report to see the top reasons the garbage collection was triggered, heap used before garbage collection, total heap after garbage collection or the number of G1 garbage collector workers:
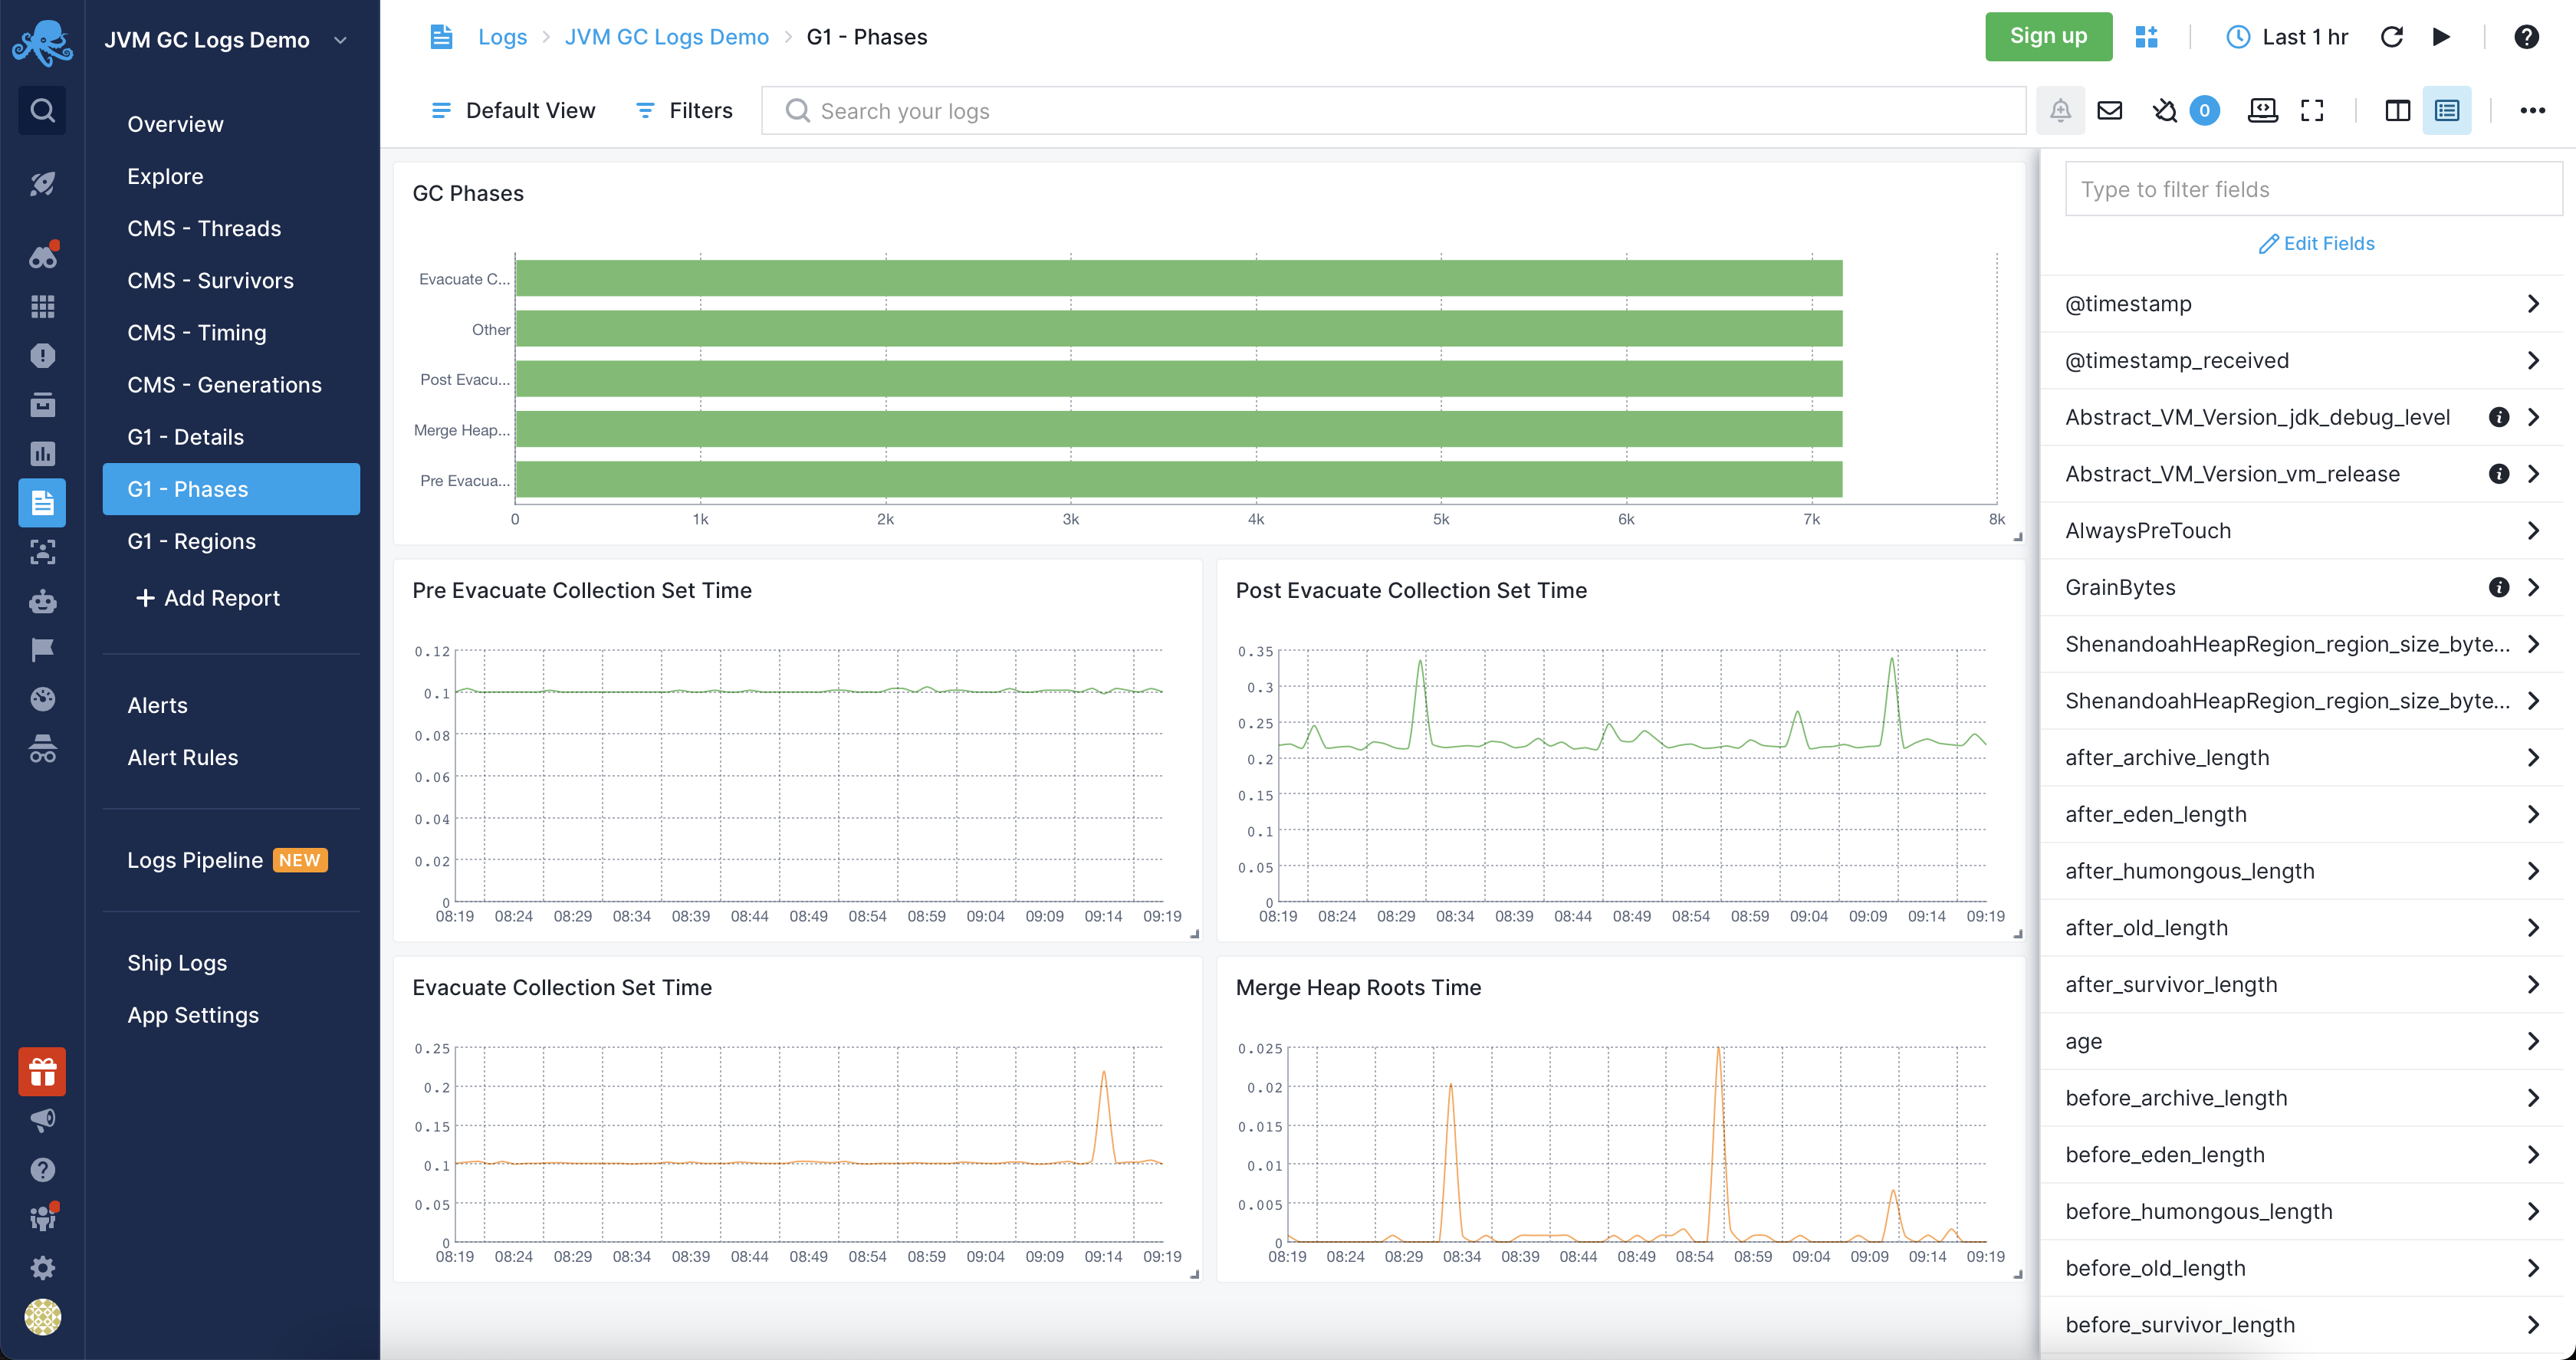
Other built-in reports include:
- CMS: several dedicated reports for threads stopping and stopped, survivors, timing and generations.
- G1: details, phases and regions related to G1GC, each in a dedicated report.
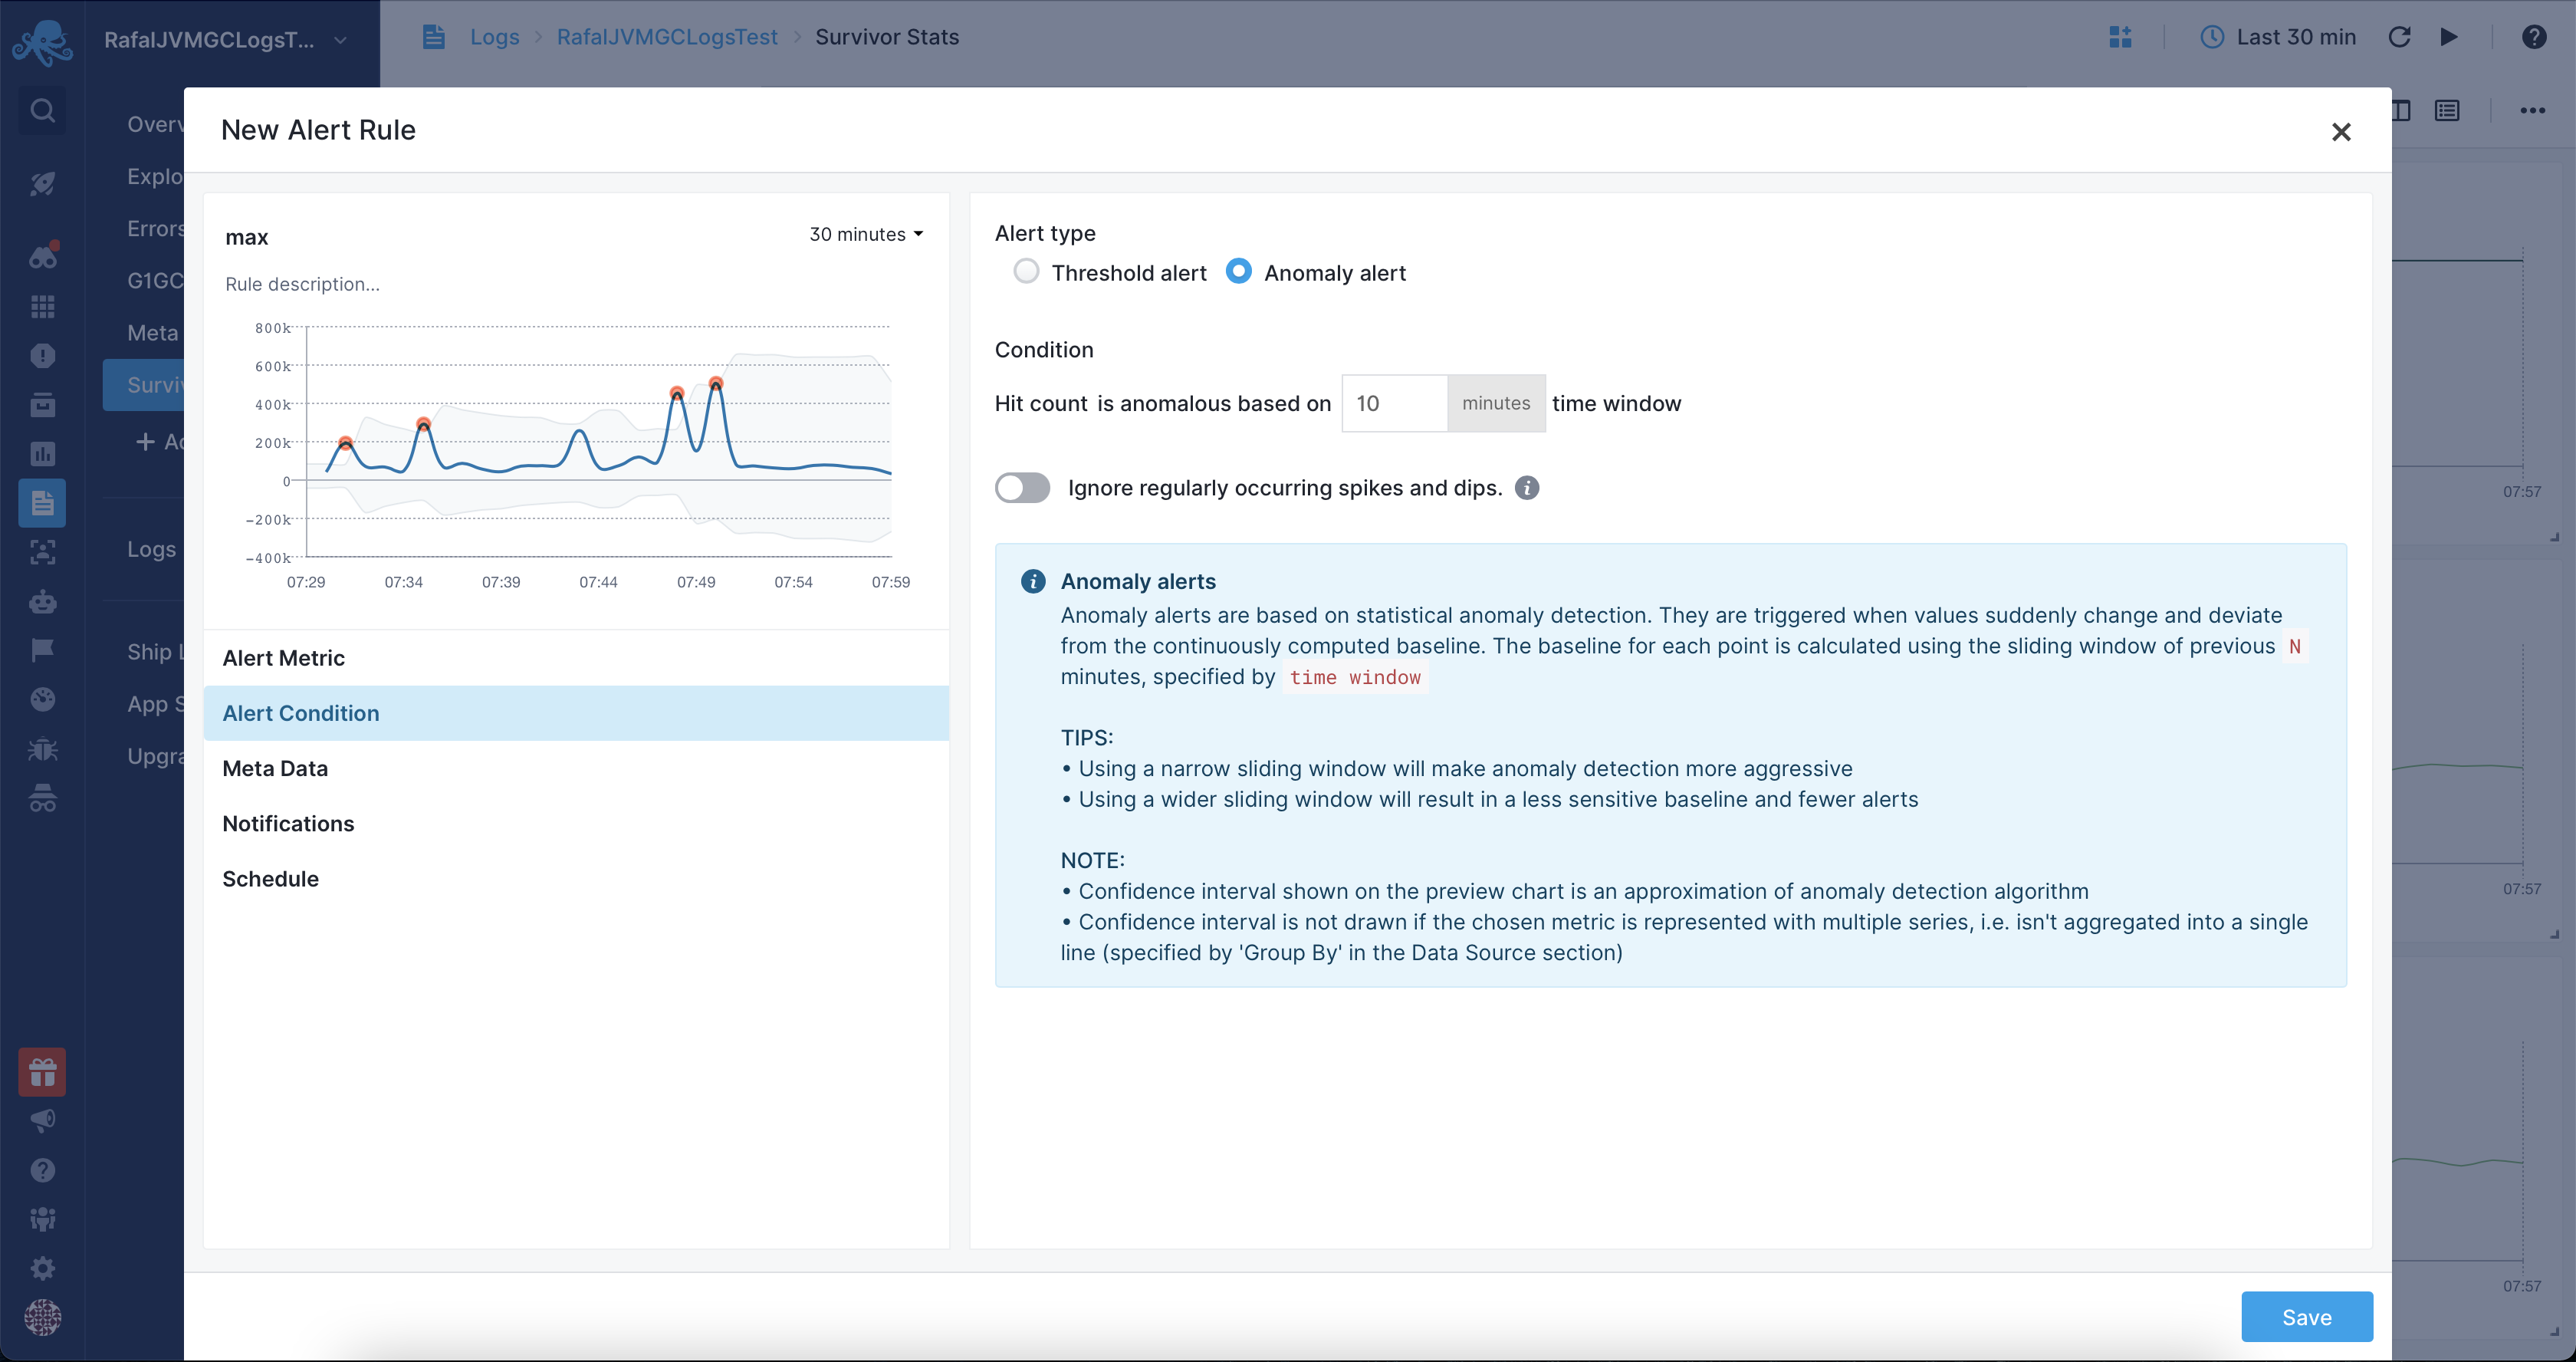
Alerts
With the built-in support for alerting you can be notified on any garbage collector metric derivated from your logs, such as the number of full garbage collections, an increasing number of workers, and many, many more. Use the threshold-based alerts or fully rely on anomaly detection to detect the unusual patterns in the metrics coming from your JVM services and garbage collector logs.
Troubleshooting
If you have trouble sending logs, try out the latest version of Sematext Agent. Also, make sure Sematext Agent is configured to send logs to your JVM Garbage Collector Logs App. Last, check the Log Agents panel for any errors, and refer to our Sematext Logs FAQ for useful tips.