Apache Spark is an open-source, large-scale data processing engine built on top of the Hadoop Distributed File System (HDFS) and enables applications in Hadoop clusters to run up to 100x faster in memory, and 10x faster even when running on disk. So it’s not surprising the usage of Spark is booming as this Google Trends graph shows.
And while Spark usage has been going through the roof, Engineers and DevOps handling Spark have not had a good monitoring tool at their disposal. Well, that is, until now. By releasing the first Spark monitoring product to market Sematext has, with the addition of Spark monitoring to SPM Performance Monitoring, Alerting and Anomaly Detection, just filled a big hole in the Spark ecosystem.
Having just been added — along with other goodies — to the latest SPM release, SPM for Spark monitors all Spark metrics. It includes alerting, anomaly detection, log correlation, custom dashboards, events graphing, custom metrics, and a ton more. SPM can be installed On Premises or one can use the Cloud version run by Sematext, in which case the setup takes less than 5 minutes before graphs with performance metrics start appearing in real-time.
Enough with the words – Show me what Spark Monitoring looks like!
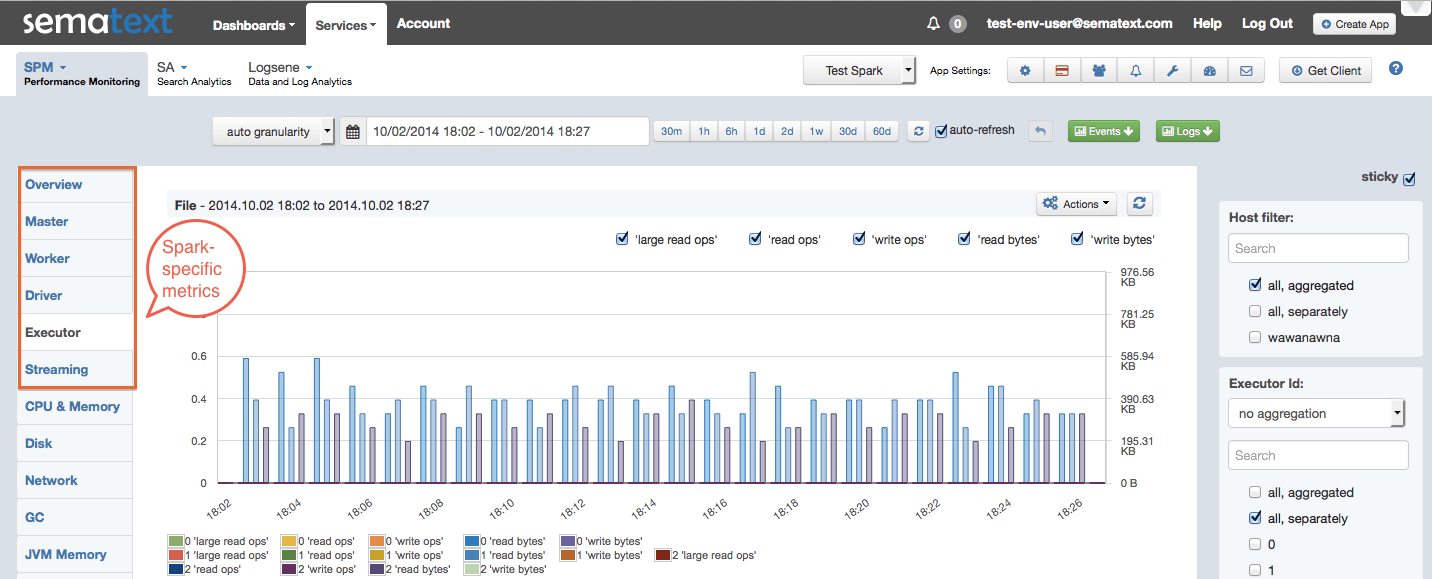
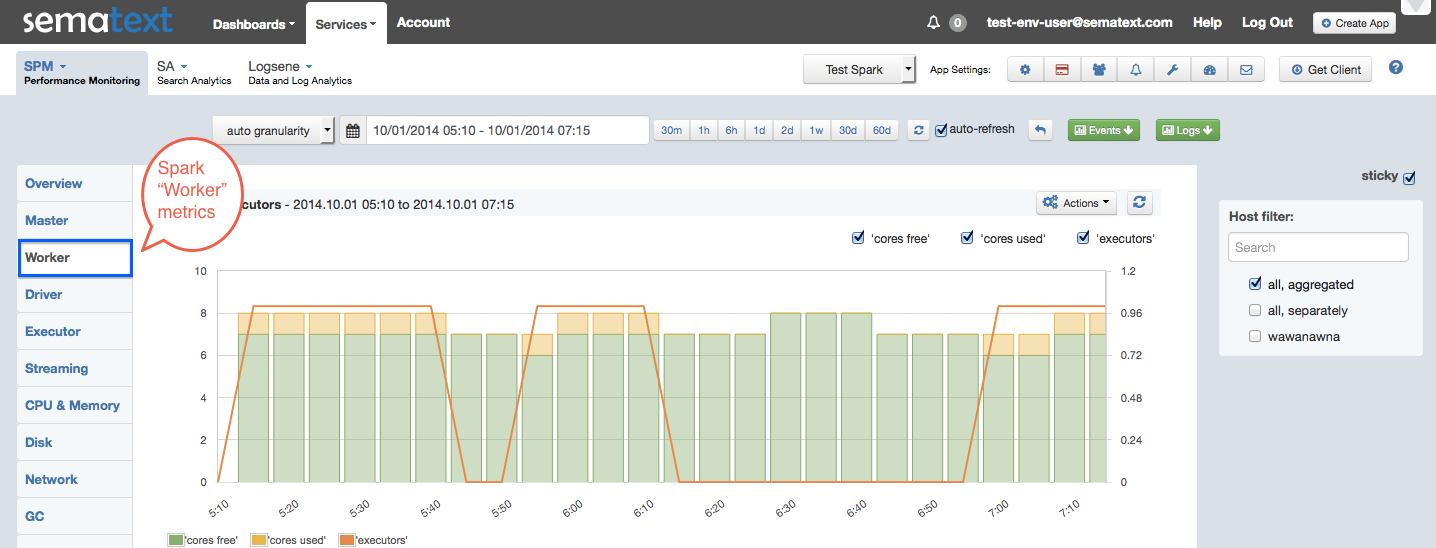
Have a look at a few screenshots to see how we graph Spark metrics in SPM. While we don’t use Spark at Sematext at this time and thus don’t have a live demo to show you, you can check out SPM’s live demo and see some other types of apps we monitor, such as Hadoop, HBase, Cassandra, Kafka, Storm, ZooKeeper, Elasticsearch, Solr, NGINX and NGINX Plus, Apache, MySQL, Redis, Java webapps and generic Java applications, as well as custom metrics.
Screenshot – Spark Executor metrics [click to enlarge]
Screenshot – Spark Worker metrics [click to enlarge]
And One More Thing…
SPM now works hand-in-hand with Logsene Log Management and Analytics. This makes the integration of performance metrics, logs, events and anomalies more robust for those of you looking to combine performance monitoring and centralized log management in one place — not only knowing that SOMETHING affected performance of your Spark cluster when you look at your performance metrics graphs or get an alert, but also exactly WHAT happened with the cluster by having immediate access to all relevant Spark event logs right there!
Take a Test Drive — It’s Easy and Free to Get Started
Like what you see here? Sound like something that could benefit your organization? Then try SPM and/or Logsene for Free for 14 days by registering here. There’s no commitment and no credit card required.

