Apache Solr monitoring
Get deep visibility into your Solr logs, metrics, and events to ensure your search server is up and running at peak levels.
14-day free trial. No credit card required.
Transparent pricing based on your needs.
Pick the plan with the features you like and customize it to meet the needs of your business. It’s as simple as that.
Stellar support
In any circumstance, whether it's through email, live chat, or phone calls, you will have a premium experience.
Plan Recommendations.
We will take this data and calculate the optimal plan based on your specific needs. Nothing more and nothing less. You pay for only what you use.
Find and fix Solr performance issues faster
Effortlessly set up and manage Solr monitoring with comprehensive monitoring tools. Pre-configured dashboards provide an in-depth view of system performance, displaying logs, metrics, and events in real time.
Monitor JVM heap and GC behavior to optimize Solr instance sizing for traffic demands
Track search and indexing latency trends to identify and alert on performance issues
Optimize Solr index performance through continuous monitoring and iterative improvements
Ensure load balance and assess I/O needs for a well-distributed, responsive cluster
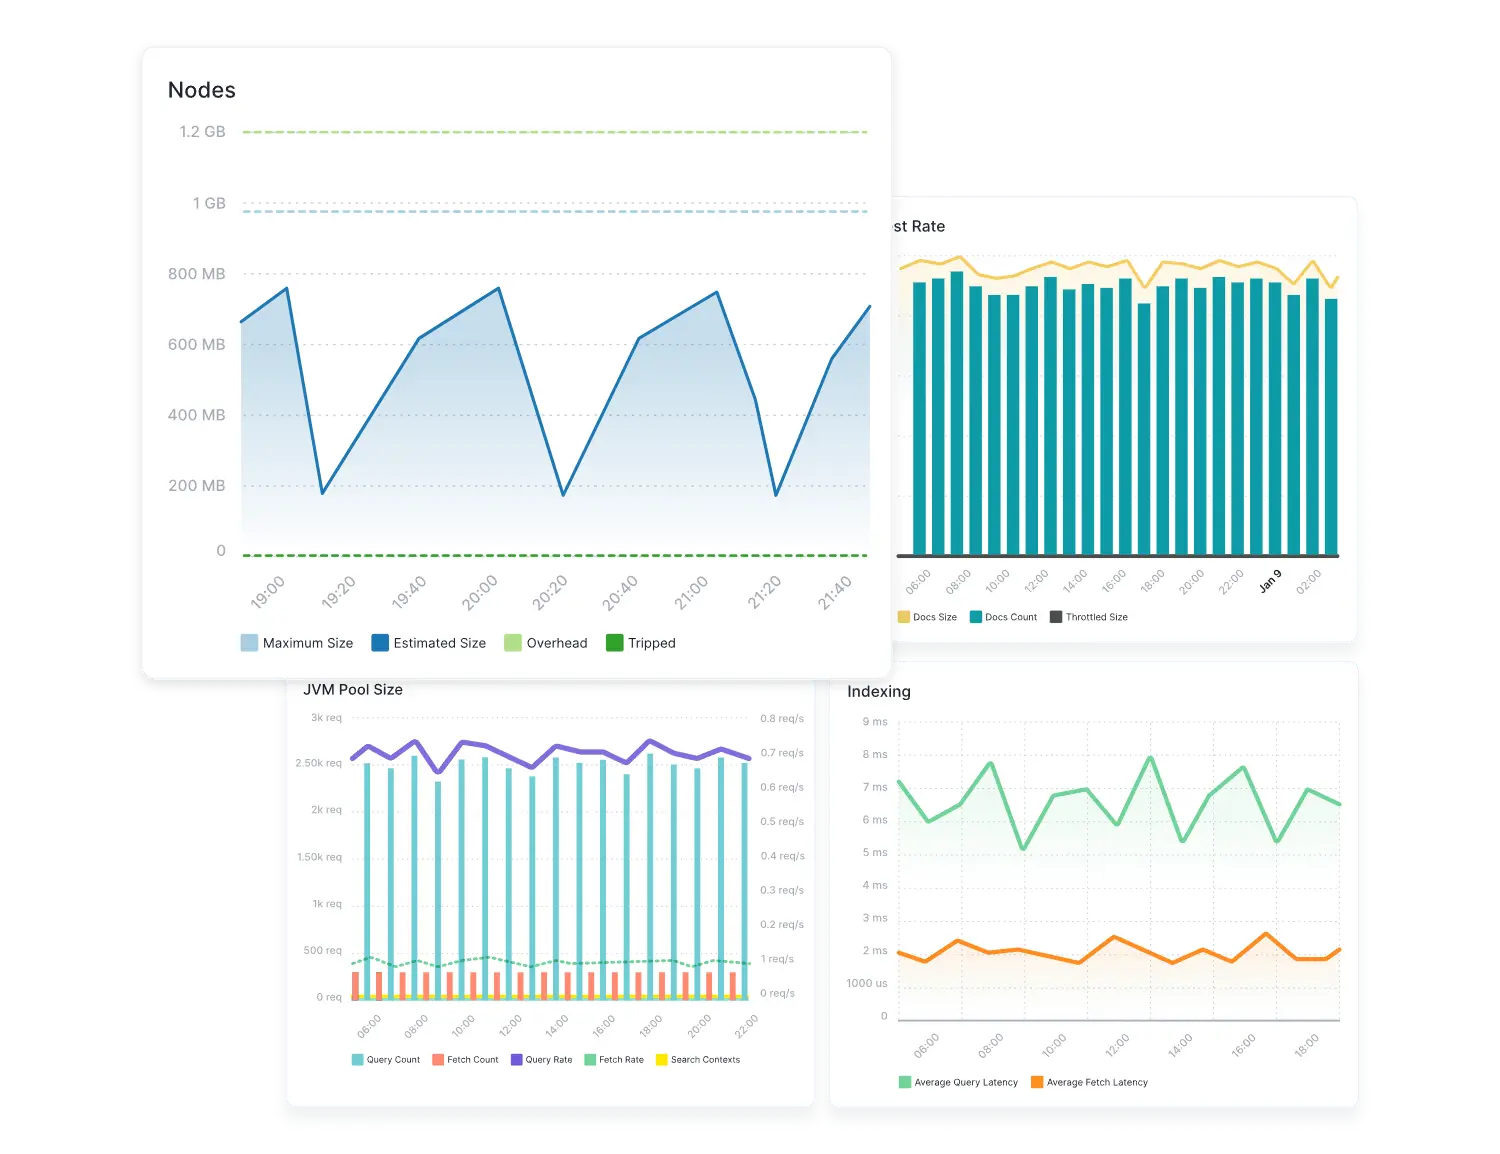
Monitor Apache Solr metrics in real time
Automatically discovers Apache Solr services, providing instant metric collection. Spot bottlenecks, optimize JVM settings, and get alerts on key performance stats—all through an intuitive interface to keep Solr running smoothly.
JVM metrics including pool size, utilization, thread counts, and open files
Garbage collection frequency, duration, and depth
Search performance metrics cover request rate, latency, and timelines
Indexing performance metrics track size, latency, file system stats, and deletion methods
Cache and collection metrics like filter, document, query result caches, commit times, and warmup times
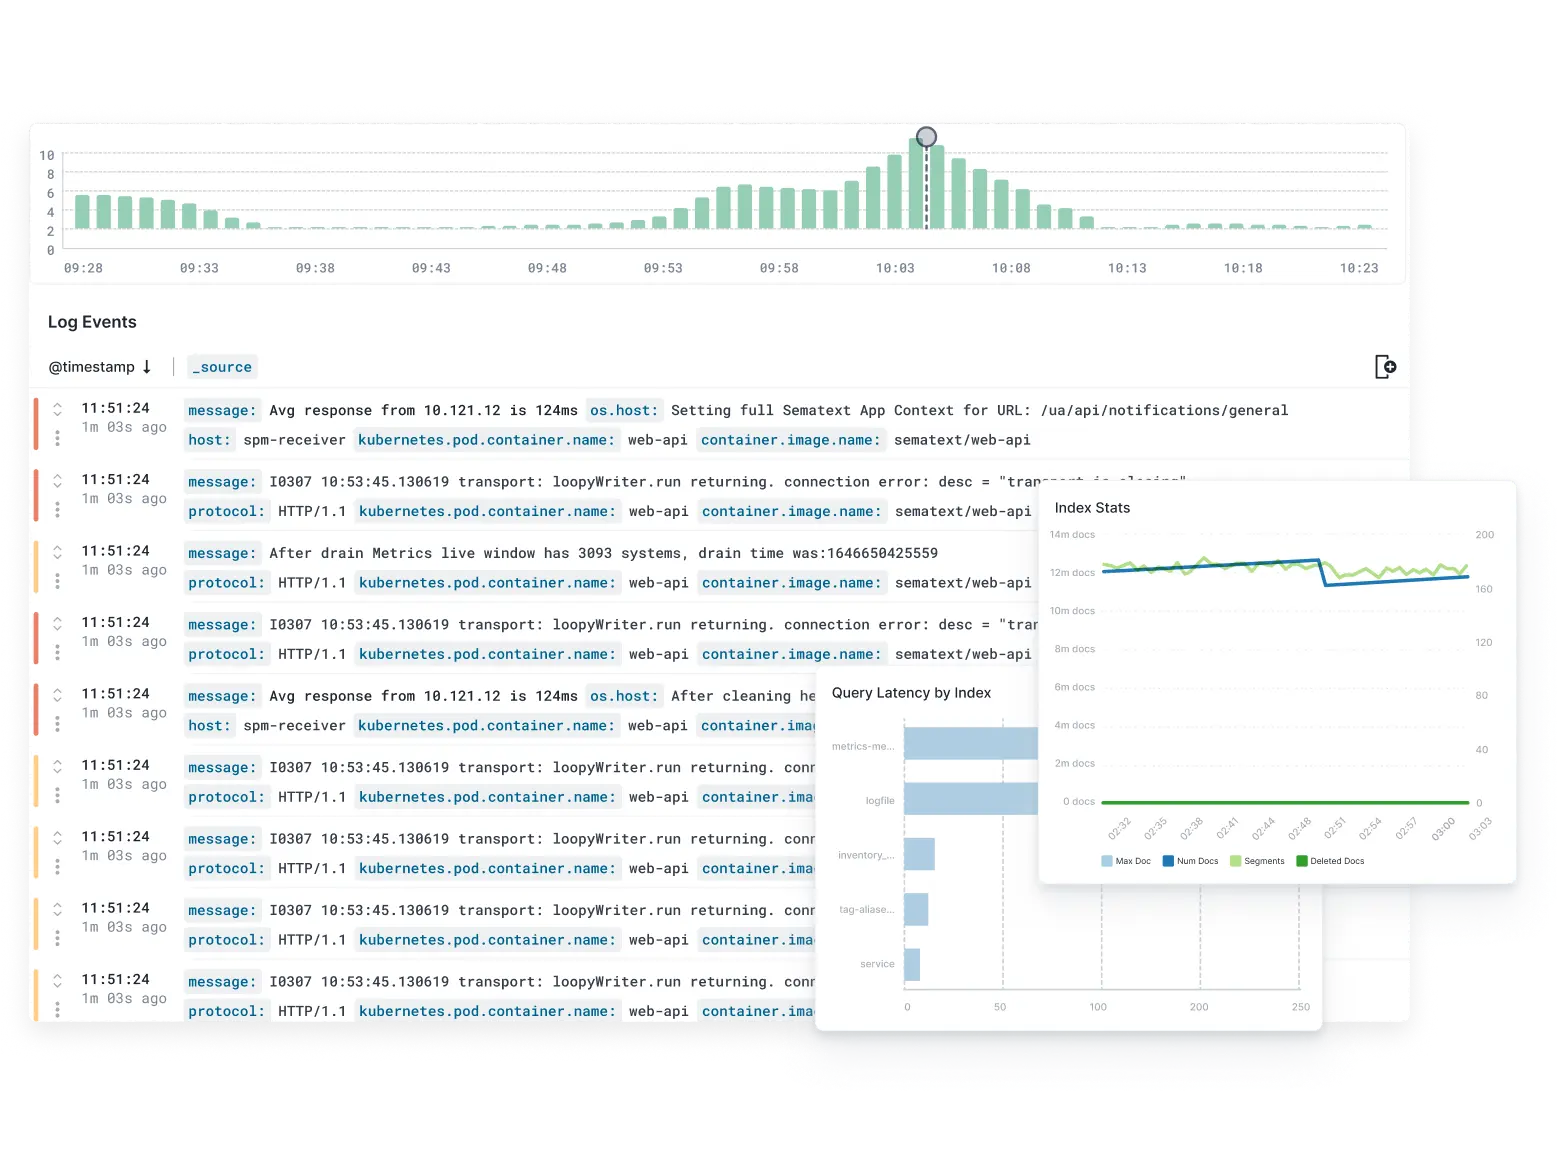
Troubleshoot faster with Apache Solr logs
Enhance your Solr performance strategy with log monitoring for improved troubleshooting. Integrate with popular log shippers and libraries to collect Solr logs effortlessly.
Find slow Solr queries, broken queries, queries returning zero hits, node timeouts, replication issues, and much more
Facet and visualize the types of log records being generated
See how many log records are generated on a per collection basis
Create timeseries visualizations of logs to see activity over time
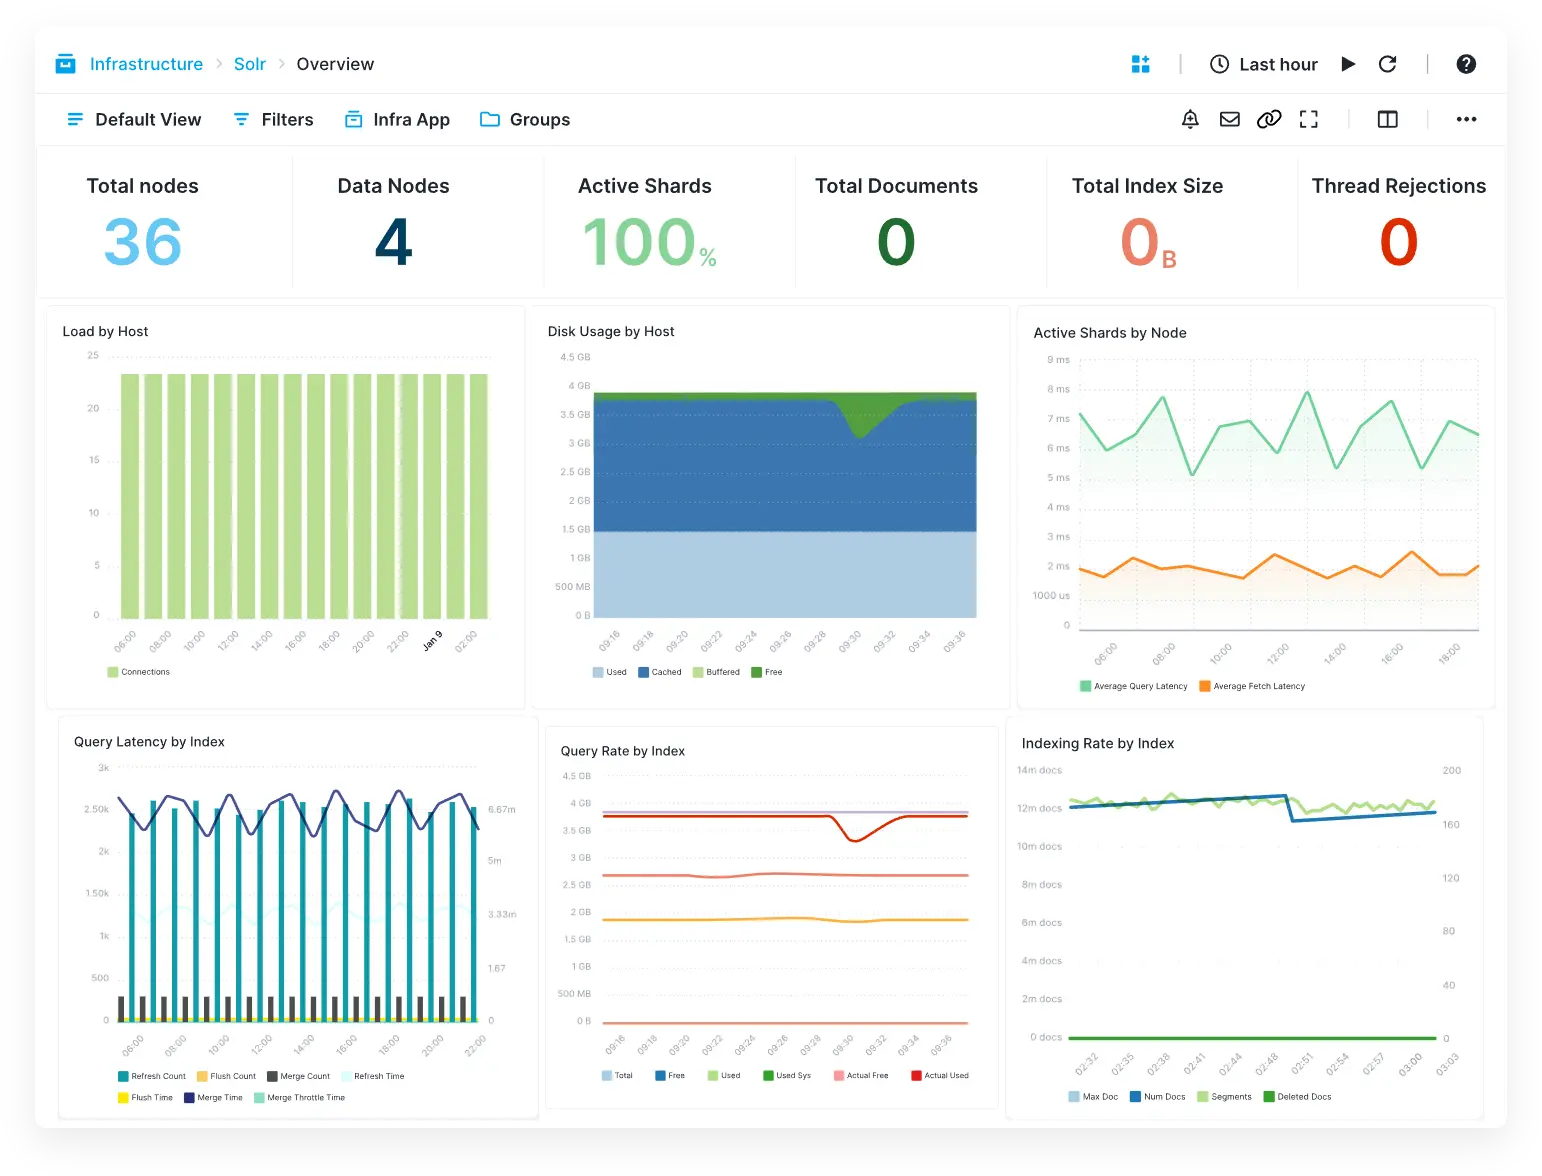
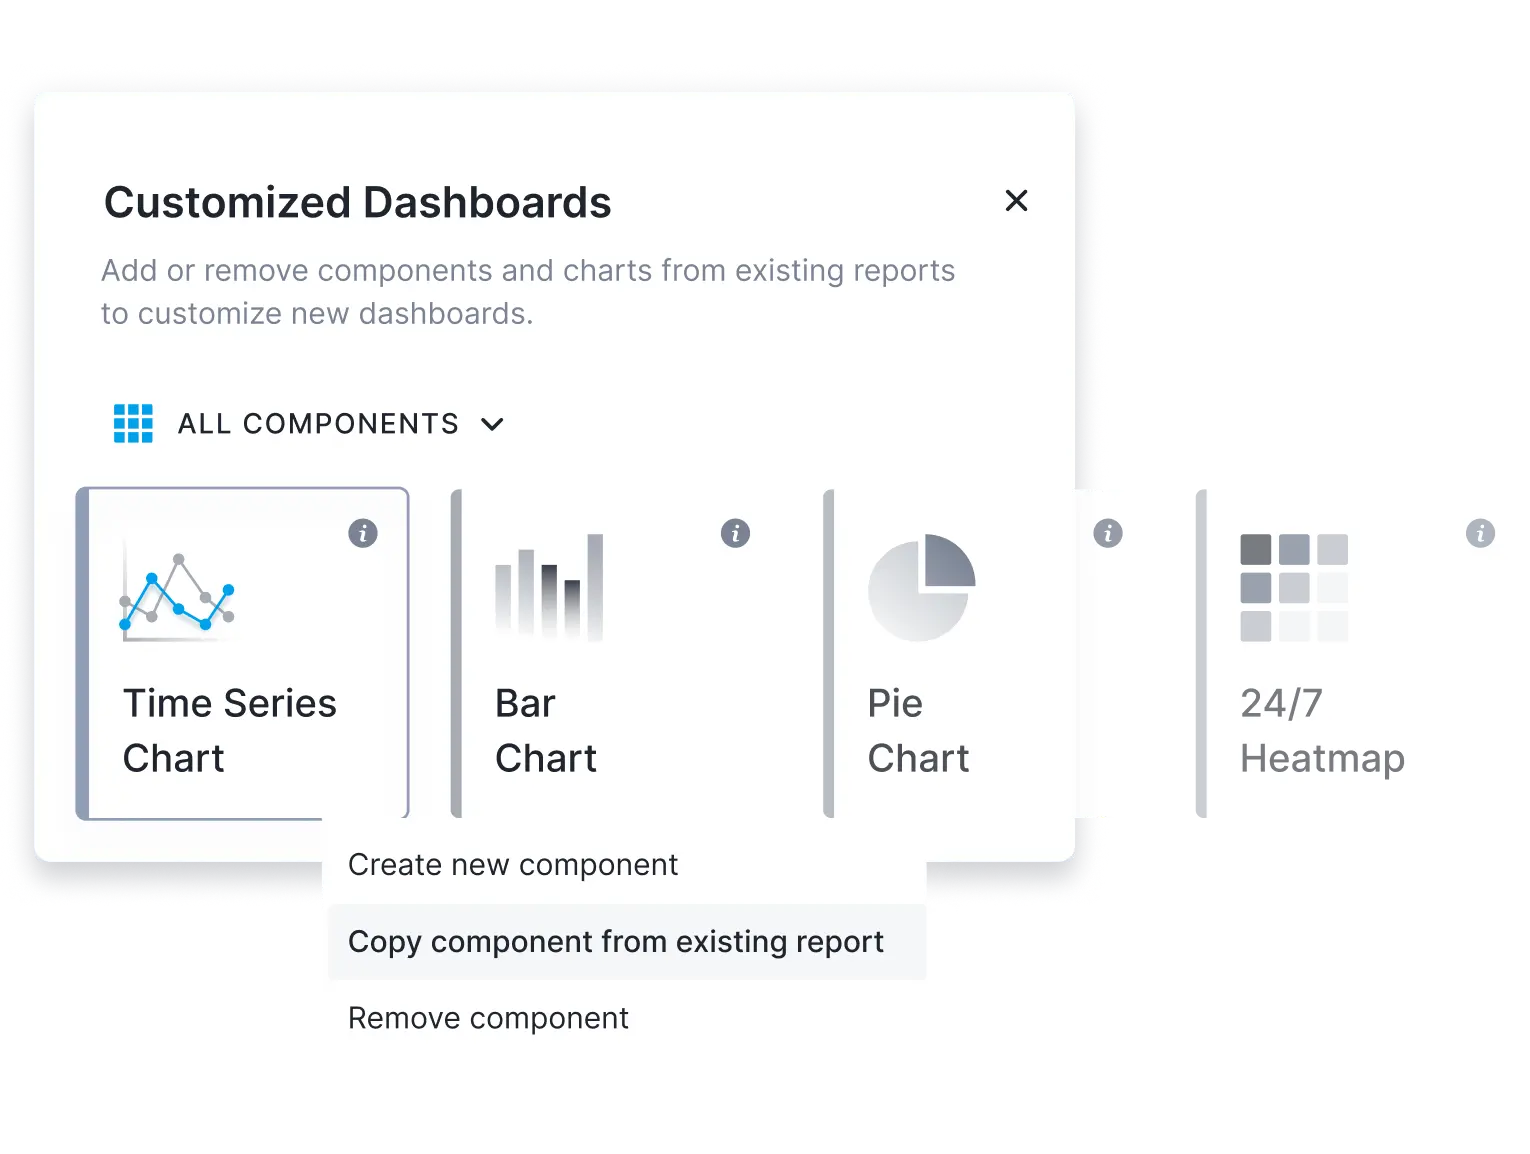
Save time with pre-built dashboards
Sematext gives you out-of-the-box dashboards to continuously monitor the availability, health, and performance of your system.
Get out-of-the-box monitoring charts
Save time and effort by tracking only the metrics that matter without spending time building your own dashboards
All your metrics in a single place
Most dashboards include tips with explanations of metrics and suggestions for what to do when a metric spikes or dips.
Notify your DevOps team about critical issues
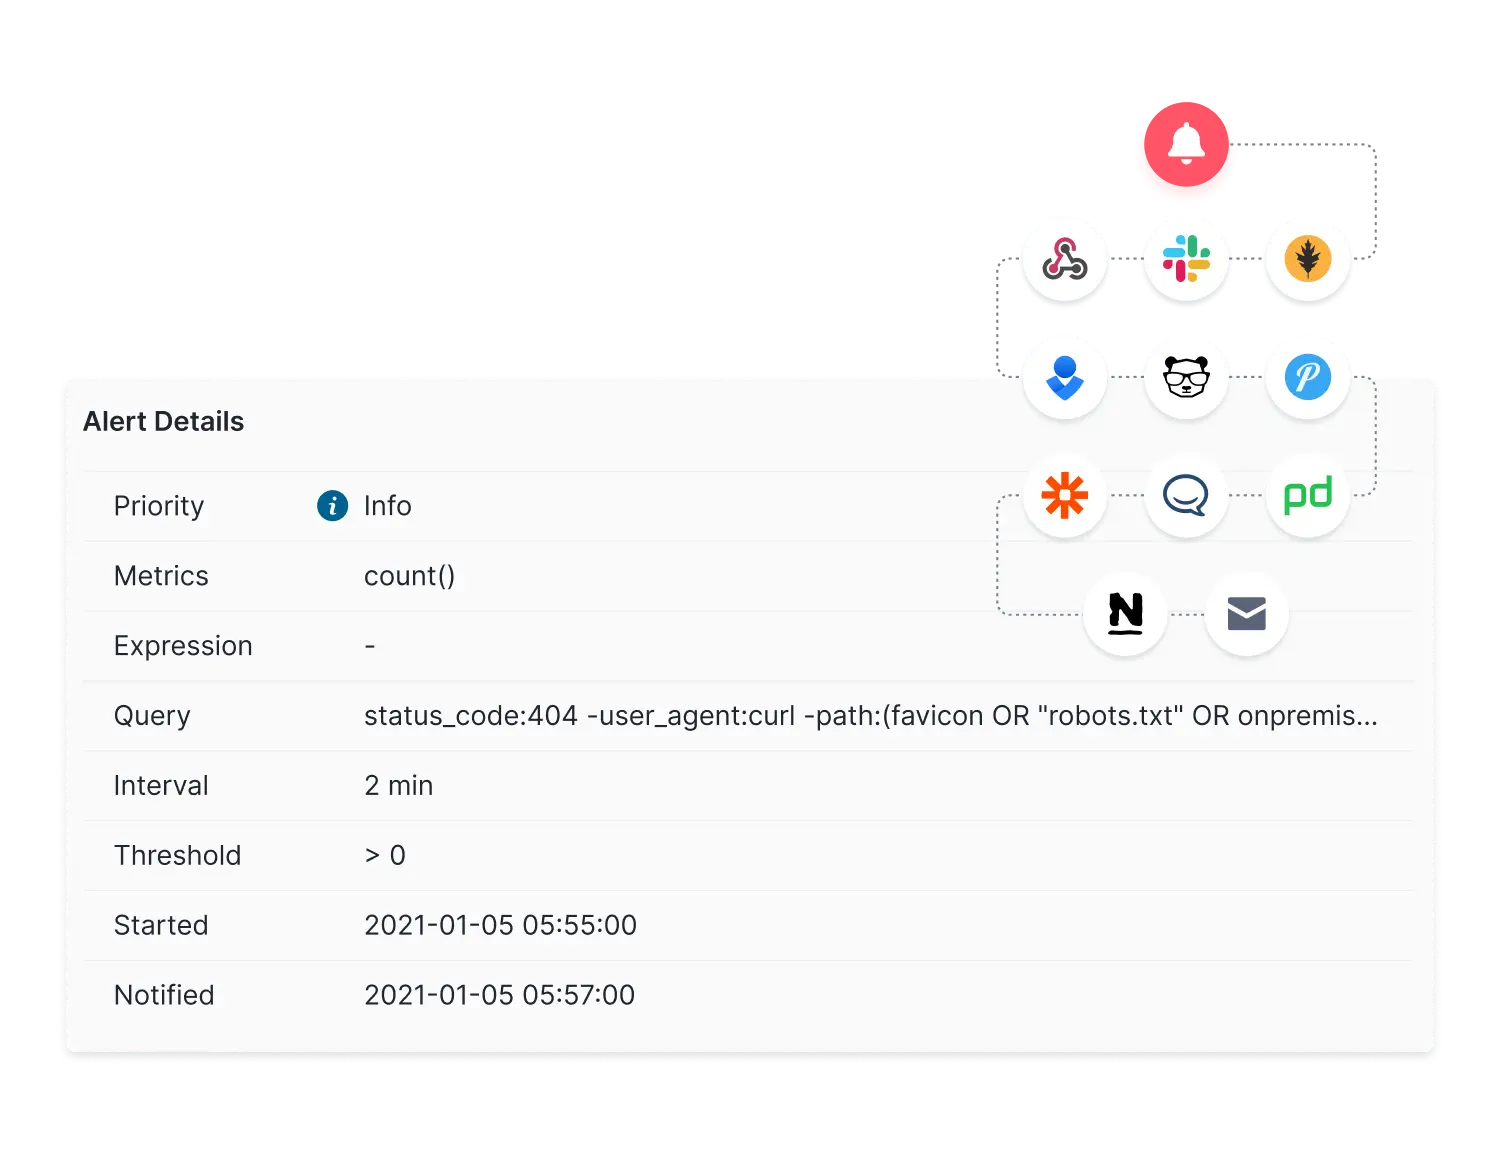
Stay on top of performance issues with customizable monitoring and alerting on any combination of metrics, filters, and logs. OpenSearch-specific alert rules are provided out of the box.
Set up anomaly detection or threshold alerts
Send notifications to Slack, PagerDuty, ServiceNow, custom Webhooks, email, etc.
Invite team members. There is no limit on the number of users!
Share logs and metrics with your team using role-based access control
Get out-of-the-box fine-tuned alerts for important OpenSearch metrics
Compare any two reports in a single view
With Split Screen you can compare any two reports. Split Screen is available across the whole product and you can open any report with events, logs, or metrics for easy correlation.
Start monitoring in minutes
Sematext features a simple monitoring agent setup with extremely low overhead.
Install the Sematext Agent in seconds.
Supported across any environment, Linux, Docker, Kubernetes, and more
Use Discovery to discover and monitor services inside containers
Select which performance metrics and logs to collect from the UI