New Year, New Feature in SPM! We are happy to announce the immediate availability of NetMaps in SPM! Check out why they are useful or watch the short video below.
Ever wondered how different components of distributed apps are actually connected over the network? When it comes to troubleshooting of distributed application stacks like Apache Kafka, Spark, Hadoop, Cassandra, Solr, or Elasticsearch — not to mention Microservice architectures or Docker Containers — information about the deployed infrastructure becomes critical. That architecture diagram you drew N months ago? It’s probably out of date. Apps we run today are often very dynamic. Instances, nodes, and containers come and go, whether because of elastic up/down scaling or other reasons.
Discovering This Dynamic Infrastructure
Watching the actual network traffic on all nodes could quickly answer many questions for DevOps engineers doing troubleshooting or planning setup changes. For example:
- Which nodes are online and active?
- How nodes are connected to other nodes?
- What are the dependencies between network services?
- What is the consumed bandwidth between nodes?
- Which applications run on a specific network node?
Visualize Network Connections
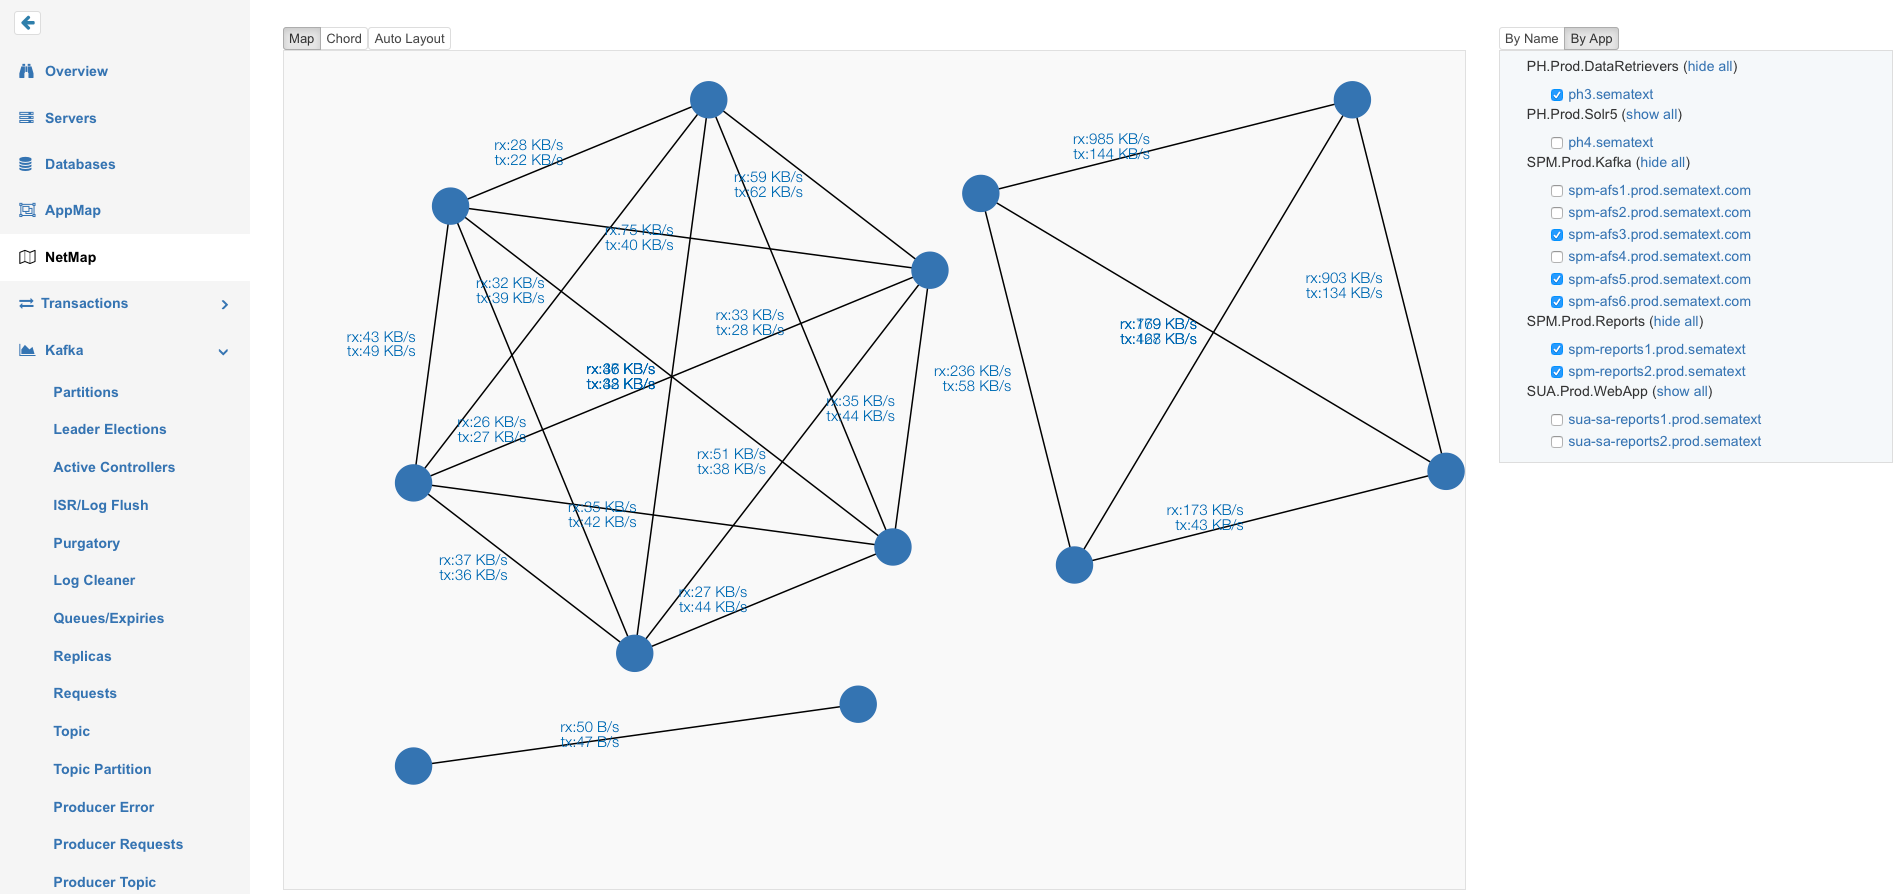
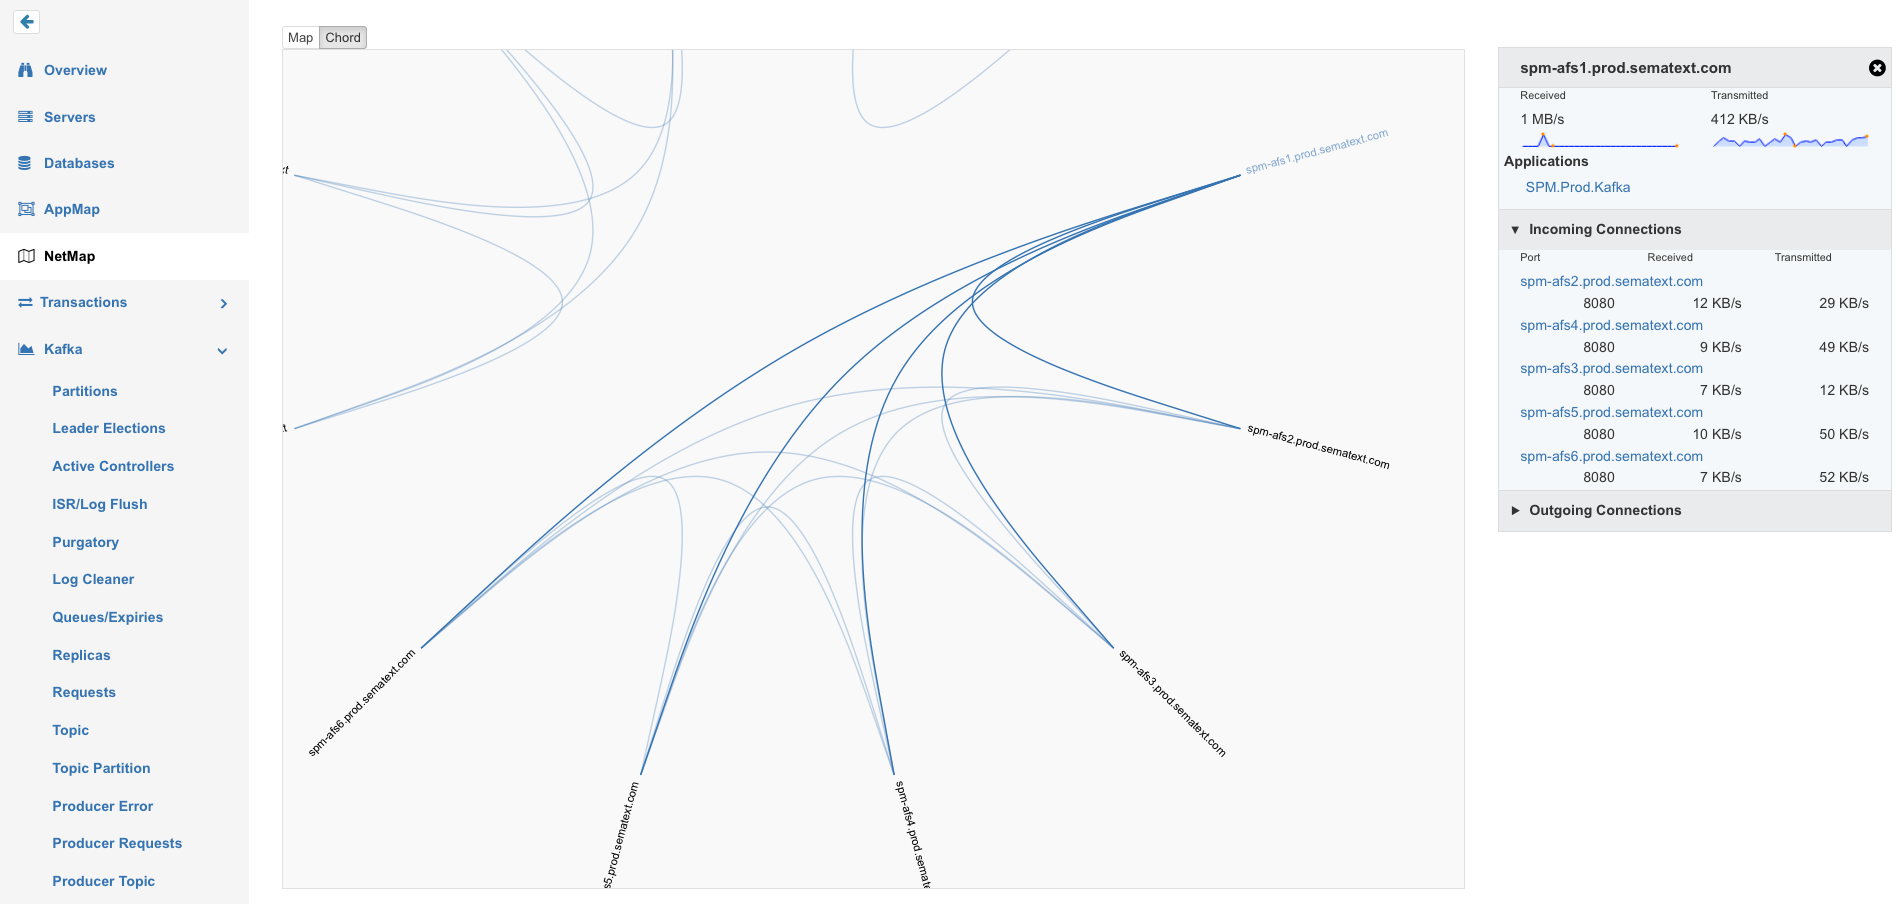
Designed to visualize network connections and answer the above questions instantly, NetMaps also include:
- Automatic Discovery of network nodes and applications
- Filtering by application and host name
- Automatic Visualizations as Network Map and Chord Diagrams
- Interactive Explorer for following network links for each application node
- Bandwidth consumption for all incoming and outgoing network connections
- Navigation from the NetMap to all nodes and related performance metrics of the monitored App
The best practice is to activate network monitoring on all application server nodes, which communicate with databases, message brokers, search engines etc. in that way it is easy to see how client applications communicate with backend servers.
NetMap “Map” View
NetMap “Chord” View
It is very easy to activate Network Monitoring in SPM Client, a collector for Host and Application Metrics. Intelligent network filters ensure that the resource usage for the network monitoring stays low while capturing all relevant packets to explore your infrastructure using the “NetMap” Tab in SPM. If you find network maps interesting, you might also be interested in SPM’s AppMap feature for JVM applications to discover relationships between monitored JVM applications such as Elasticsearch, Solr, Cassandra, Spark or Kafka, …
We hope you like this new addition to SPM. Got ideas how we could make it more useful for you? Let us know via comments, email or @sematext.
Not using SPM yet? Check out the free 30-day SPM trial by registering here. There’s no commitment and no credit card required.

