In this article, you’ll learn how to understand and debug the memory usage of a Node.js application and use monitoring tools to get a complete insight into what is happening with the heap memory and garbage collection. Here’s what you’ll get by the end of this tutorial.
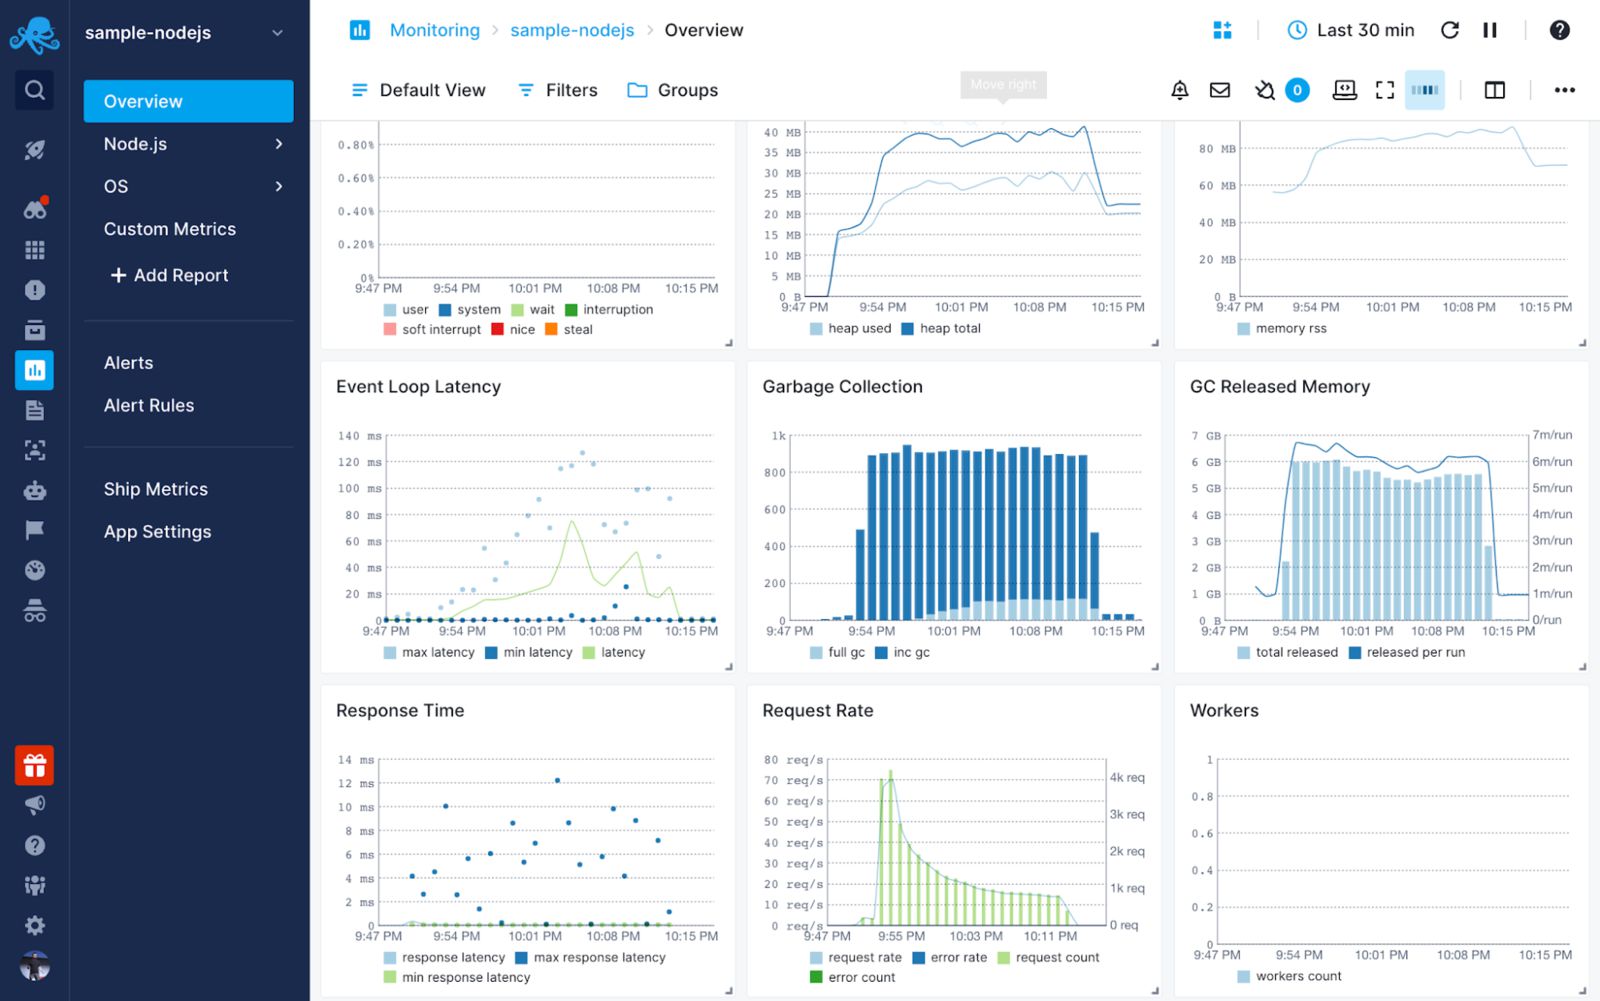
Memory leaks often go unnoticed. This is why I suggest using a tool to keep track of historical data of garbage collection cycles and to notify you if the heap memory usage starts spiking uncontrollably.
You can restart the app and make it all magically go away. But, you ultimately want to understand what happened and how to stop it from recurring.
That’s what I want to teach you today. Let’s jump in!
What Are Memory Leaks in Node.js?
Long story short, it’s when your Node.js app’s CPU and memory usage increases over time for no apparent reason.
In simple terms, a Node.js memory leak is an orphan block of memory on the Heap that is no longer used by your app because it has not been released by the garbage collector.
It’s a useless block of memory. These blocks can grow over time and lead to your app crashing because it runs out of memory.
Let me tell you what all of this means, under the hood.
What Is Garbage Collection in Node.js?
If a piece of memory segment is not referenced from anywhere, it can be released. However, the garbage collector can have a hard time keeping track of every piece of memory. That’s how you get the strange increase in app load even if it doesn’t make any sense.
Node.js uses Chrome’s V8 engine to run JavaScript. Within V8, memory is categorized into Stack and Heap memory.
- Stack: Stores static data, method and function frames, primitive values, and pointers to stored objects. The stack is managed by the operating system.
- Heap: Stores objects. Because everything in JavaScript is an object this means all dynamic data like arrays, closures, etc. The heap is the biggest block of memory and it’s where Garbage Collection (GC) happens.
Garbage collection frees up memory in the Heap used by objects that are no longer referenced from the Stack, either directly or indirectly. The goal is to create free space for creating new objects. Garbage collection is generational. Objects in the Heap are grouped by age and cleared at different stages.
There are two stages and two algorithms used for garbage collection.
New Space and Old Space
The heap has two main stages.
- New Space: Where new allocations happen. Garbage collection is quick. Has a size of between 1 and 8 MBs. Objects in the New Space are called the Young Generation.
- Old Space: Where objects that survived the collector in the New Space are promoted to. Objects in the Old Space are called the Old Generation. Allocation is fast, however, garbage collection is expensive and infrequent.
Young Generation and Old Generation
Roughly a fifth of the Young Generation survives garbage collection and gets moved to the Old Generation. Garbage collection of Old Generation objects will only start when the memory gets exhausted. In that case V8 uses two algorithms for garbage collection.
Scavenge and Mark-Sweep collection
- Scavenge collection: Fast and runs on the Young Generation.
- Mark-Sweep collection: Slower and runs on the Old Generation.
Why is garbage collection expensive?
Sadly, V8 stops the program execution while garbage collection is in progress. This can causes increased latency. It’s obvious you do not want garbage collection cycles to take up significant time and block the main thread of execution.
Woah, that was a lot to soak in. But, now once you know all of this, let’s move on to figuring out what causes memory leaks and how to fix them.
What Causes Them: Common Node.js Memory Leaks
Some Node.js memory leaks are caused by common issues. These can be circular object references that are caused by a multitude of reasons.
Let me tell you about the most common causes for memory leaks.
Global variables
Global variables in Node.js are the variables referenced by the root node, which is global. It’s the equivalent of window for JavaScript running in the browser.
Global variables are never garbage collected throughout the lifetime of an app. They occupy memory as long as the app is running. Here’s the kicker: this applies to any object referenced by a global variable, and all their children, as well. Having a large graph of objects referenced from the root can lead to a memory leak in Node.js applications.
Let me start a trend of saying, “please, don’t do this.”
Multiple references
If you reference the same object from multiple objects, it can lead to a memory leak if one of the references is garbage collected while the other one is left dangling.
Closures
Closures memorize their surrounding context. When a closure holds a reference to a large object in heap, it keeps the object in memory as long as the closure is in use.
This implies easily ending up in situations where a closure holding such a reference can be improperly used leading to a memory leak.
Timers & Events
The use of setTimeout, setInterval, Observers, and event listeners can cause memory leaks when heavy object references are kept in their callbacks without proper handling.
How to Avoid Memory Leaks in Node.js Applications: Prevention Best Practices
Now that you have a better understanding of what causes memory leaks in Node.js applications, let me explain how to avoid them and a few best practices to use to make sure the memory is used efficiently.
Reduce Use of Global Variables
Since global variables are never garbage collected, it’s best to ensure you don’t overuse them. Here are a few ways you can make sure this does not happen.
Avoid Accidental Globals
When you assign a value to an undeclared variable, JavaScript automatically “hoists” it. This means it’s assigned to the global scope. Very bad!
This could be the result of a typo and could lead to a memory leak. Another way could be when assigning a variable to this within a function in the global scope.
// This will be hoisted as a global variable
function hello() {
  foo = "Message";
}

// This will also become a global variable as global functions have
// global `this` as the contextual `this` in non strict mode
function hello() {
  this.foo = "Message";
}
To avoid issues like this, always write JavaScript in strict mode using the ‘use strict’; annotation at the top of your JS file.
When you use ES modules or transpilers like TypeScript or Babel, you don’t need it as it’s automatically enabled.
In Node.js, you can enable strict mode globally by passing the –use_strict flag when running the node command.
"use strict";

// This will not be hoisted as a global variable
function hello() {
  foo = "Message"; // will throw runtime error
}

// This will not become global variable as global functions
// have their own `this` in strict mode
function hello() {
  this.foo = "Message";
}
When you use arrow functions, you also need to be mindful not to create accidental globals, and unfortunately, strict mode will not help with this. You can use the no-invalid-this rule from ESLint to avoid such cases.
If you are not using ESLint, just make sure not to assign to this from global arrow functions.
// This will also become a global variable as arrow functions
// do not have a contextual `this` and instead use a lexical `this`
const hello = () => {
    this.foo = 'Message";
}
Finally, keep in mind not to bind global this to any functions using the bind or call method, as it will defeat the purpose of using strict mode.
Use Global Scope Sparingly
You should always avoid using the global scope whenever you can, including global variables. Here are some best practices you should follow in this regard:
- Use local scope inside functions, as it will be garbage collected. This frees up memory. If you have to use a global variable due to some constraints, set the value to null when it’s no longer needed. This means you can garbage collect it “manually”.
- Use global variables only for constants, cache, and reusable singletons.
- Never use global variables for the convenience of avoiding passing values around. For sharing data between functions and classes, pass the values around as parameters or object attributes.
- Never store big objects in the global scope. If you have to store them, set the values to null when they’re not needed.
- When you’re using objects as cache, set a handler to clean them up once in a while and don’t let them grow indefinitely.
Use Stack Memory Effectively
Accessing the stack memory is more efficient and performant than accessing the heap. It’s illogical to only use static values as in the real world you use objects and dynamic data.
However, there are few things you can do to make this process more memory friendly.
First, avoid heap object references from stack variables when possible. Secondly, delete unused variables. Third, destructure objects and use only the fields you need from an object or array rather than passing around entire objects or arrays to functions, closures, timers, and event handlers.
If you follow these simple suggestions you’ll avoid keeping references to objects inside closures. The fields you pass are primitives, which will be kept in the stack. Here’s an example below.
function outer() {
    const obj = {
        foo: 1,
        bar: "hello",
    };

    const closure = () {
        const { foo } = obj;
        myFunc(foo);
    }
}

function myFunc(foo) {}
[sematext_banner type=”infrastructure”]
Use Heap Memory Effectively
You have to use the heap in every Node.js application you build. It’s up to you to use it efficiently.
Passing object references is more expensive regarding heap usage than copying objects. You should pass a reference only if the object is absolutely massive. But, this won’t happen often at all in your day-to-day Node.js development.
You can use the object spread syntax (…) or Object.assign to copy an object. This paradigm is aligned with immutability in functional programming where you are constantly creating new objects while making sure functions are as “pure” as possible.
This also means you should avoid creating huge object trees. If you can’t avoid it, try to keep them short-lived in the local scope.
This is also what you should do with variables in general, make them short-lived.
And while you are at it, make sure you monitor your heap size. I’ll explain how to do this with Sematext a bit further down in this article.
Properly Using Closures, Timers, and Event Handlers
Closures, timers, and event handlers can often create memory leaks in Node.js applications.
Let’s look at a piece of code from the Meteor team explaining a closure that leads to a memory leak.
It leads to a memory leak as the longStr variable is never collected and keeps growing in memory. The details are explained in this blog post.
var theThing = null;
var replaceThing = function () {
  var originalThing = theThing;
  var unused = function () {
    if (originalThing) console.log("hi");
  };
  theThing = {
    longStr: new Array(1000000).join("*"),
    someMethod: function () {
      console.log(someMessage);
    },
  };
};
setInterval(replaceThing, 1000);
The code above creates multiple closures, and those closures hold on to object references. The memory leak, in this case, can be fixed by nullifying originalThing at the end of the replaceThing function.
You avoid issues like this by creating copies of the object and using the immutable objects approach I mentioned above.
The same logic applies to timers as well. Remember to pass copies of objects and avoid mutations. Clear the timers when you don’t need them anymore by using the clearTimeout and clearInterval methods.
The same goes for event listeners and observers. Clear them once they’re done doing what you want them to. Don’t leave event listeners running forever, especially if they are going to hold on to any object reference from the parent scope.
Node.js Memory Leak Detectors
Fixing a memory leak is not as straightforward as it may seem. You’ll need to check your codebase to find any issues with your global scope, closures, heap memory, or any other pain points I outlined above.
A quick way to fix Node.js memory leaks in the short term is to restart the app. Make sure to do this first and then dedicate the time to seek out the root cause of the memory leak.
Here are a few tools to help you detect memory leaks.
Memwatch
It’s been 9 years since memwatch was published on npm, but you can still use it to detect memory leaks.
This module is useful because it can emit leak events if it sees the heap grow over 5 consecutive garbage collections.
Heapdump
Heapdump is another great tool for taking snapshots of the heap memory. You can then later inspect them in the Chrome Developer Tools.
node-inspector
Sadly memwatch and heapdump can’t connect to a running app. However, node-inspector can! It lets you connect to a running app by running the node-debug command. This command will load Node Inspector in your default browser.
V8 Inspector & Chrome Dev Tools
You can use Dev Tools in Chrome to inspect Node.js apps. How? They both run the same V8 engine which contains the inspector used by the Dev Tools.
Here’s an example with a sample Express app. Its only purpose is to display all the requests that it has ever received.
const express = require('express')
const app = express()
const port = 3000
const requestLogs = [];

app.get('/', (req, res) => {
  requestLogs.push({ url: req.url, date: new Date() });
  res.status(200).send(JSON.stringify(requestLogs));
})

app.listen(port, () => {
  console.log(`Sample app listening on port ${port}.`)
})
In order to expose the inspector, let’s run Node.js with the –inspect flag.
node --inspect index.js

Debugger listening on ws://127.0.0.1:9229/7fc22153-836d-4ed2-8090-a84a842a199e
For help, see: <https://nodejs.org/en/docs/inspector>
Sample app listening on port 3000.
Open up Chrome and go to chrome://inspect. Voila! A full-featured debugger for your Node.js application. Here you can take snapshots of the memory usage.
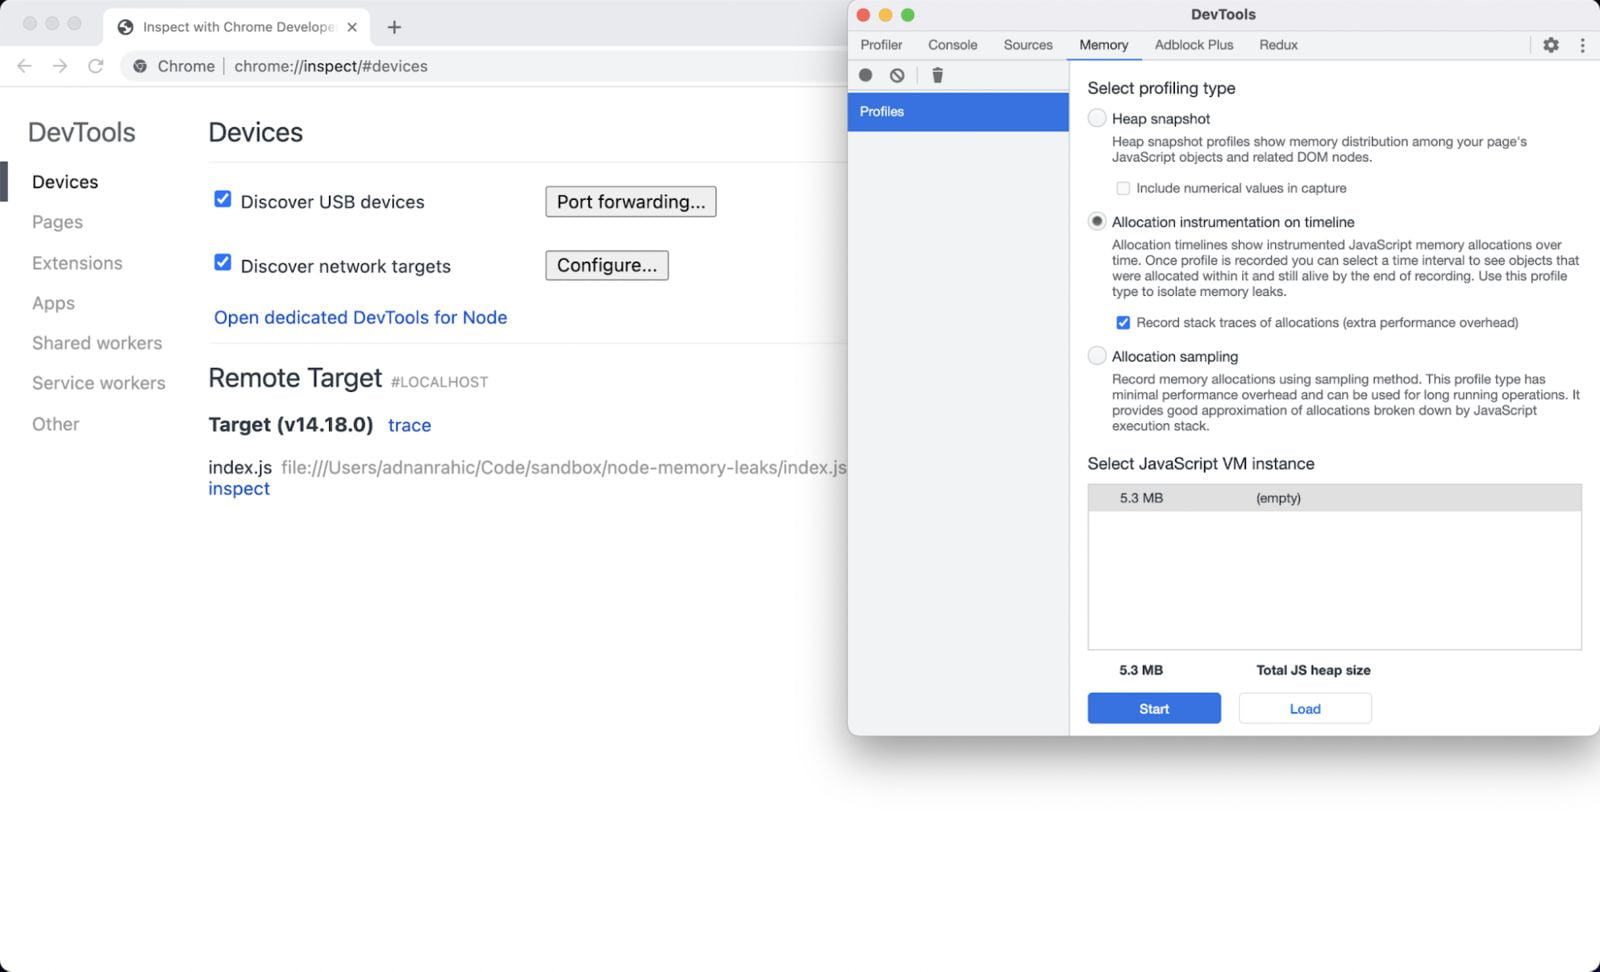
Watching Memory Allocation in Real Time
A more optimized method to measure the memory allocation is to view it live instead of taking multiple snapshots.
You use the Allocation instrumentation on timeline option in this case. Select that radio button and check the Record stack traces of allocations checkbox. This will start a live recording of the memory usage.
For this use case, I used loadtest to run 1000 requests against the sample Express app with a concurrency of 10.
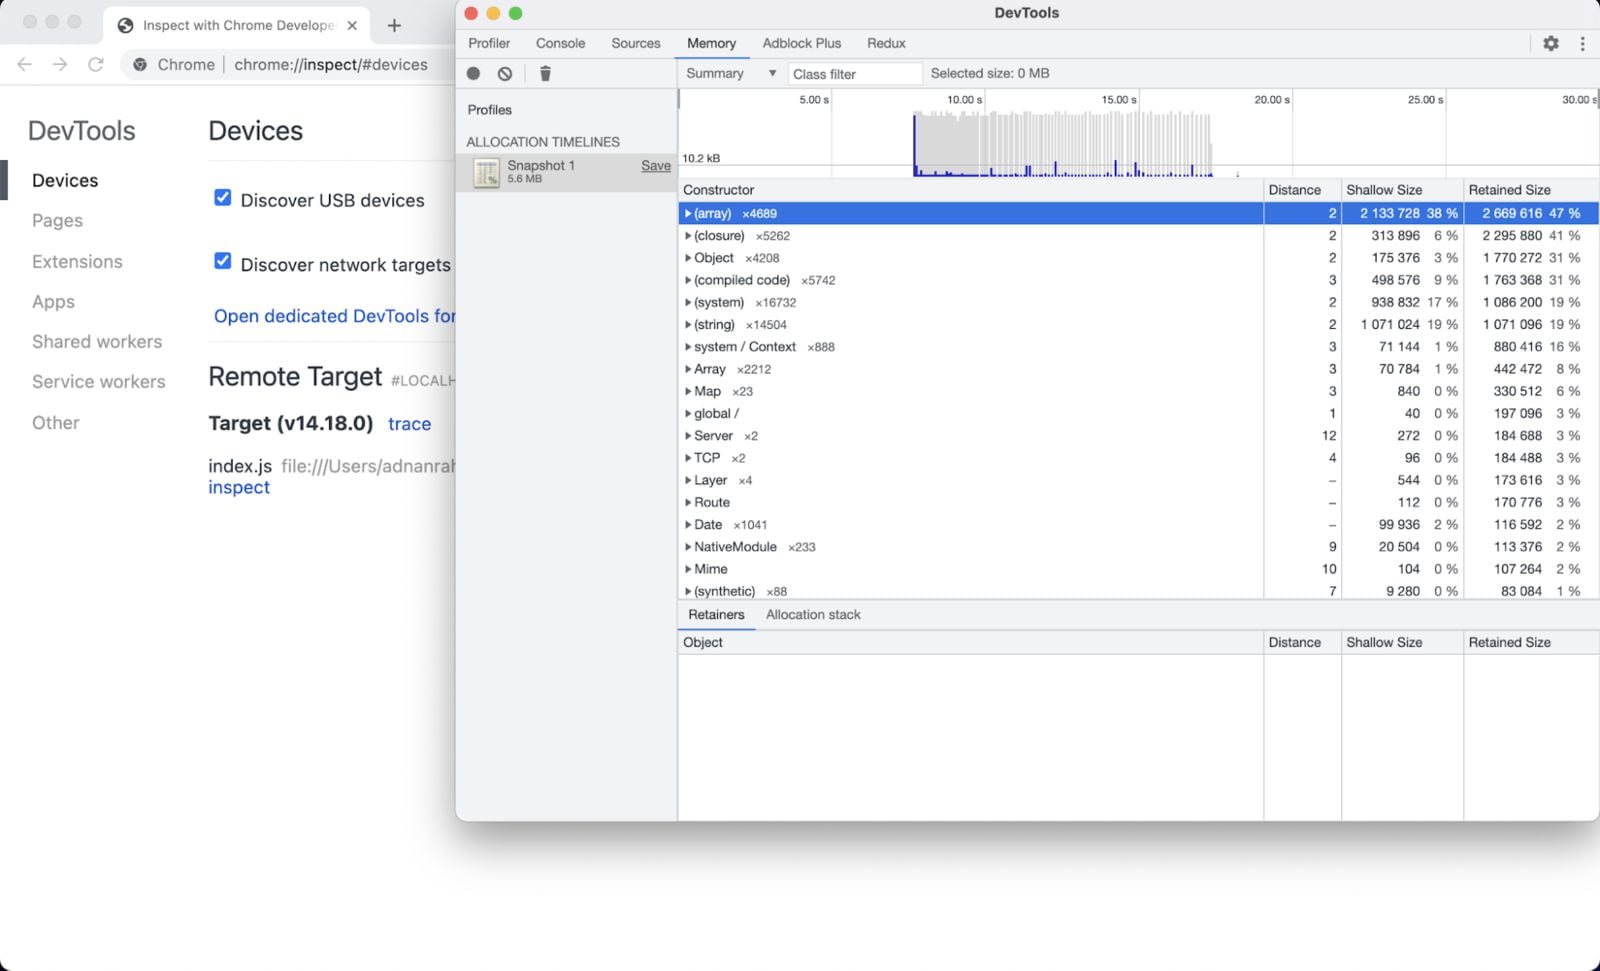
For the first few requests, you can see a spike in memory allocation. But it’s obvious that most memory is allocated to the arrays, closure, and objects.
Monitoring Tools
Using debugging tools to watch memory allocation and find memory leaks is one thing, but tracking it in real-time all the time is another cup of tea.
You need proper monitoring tools to give you historical data a time dimension where you can track and gain real insight into how your app is behaving.
Here are some tools to look into:
If you want to gain more insight into the many options to detect memory leaks you can take a look at another article I wrote a while back: Node.js monitoring tools.
Now, let’s take this to the next level and watch for Node.js memory leaks in real-time with a proper monitoring tool.
Debugging Example: How to Find Leaks with Sematext
Sematext Monitoring enables you to monitor your entire infrastructure stack, from top to bottom, with one tool. You can map out, and monitor, your whole infrastructure in real-time, down to below a granularity of below a minute.
You also get real-time insight into the performance of your Node.js app. This includes garbage collection, worker threads, HTTP request and response latency, event loop latency, CPU and memory usage, and much more.
You’re ready to set up your monitoring!
Start by creating a Node.js App in Sematext Cloud.

Follow the instructions in the UI to install the required Agents that will collect infra and Node.js metrics.

Create a .env file at the root of your project. Add this snippet.
MONITORING_TOKEN=b2b0b02b-xxxx-xxxx-xxxx-11f89c2ccc64
Edit the index.js of your app to require the sematext-agent-express. Make sure to include it at the very top of the index.js file.
// Load env vars
require('dotenv').config()

// require stMonitor agent
const { stMonitor } = require('sematext-agent-express')

// Start monitoring metrics
stMonitor.start()
You’ll see the dashboards get populated with Node.js metrics within a few minutes.
By using the garbage collection and memory charts, you can get a complete insight into what is happening in your app.

If the Garbage Collection and Heap Memory keep rising without releasing constant amounts of memory consistently, you most definitely have an issue. A quick solution would be to restart your app. But in the long run, this won’t do. You need to apply all the steps I outlined above to reduce the chance of memory leaks.
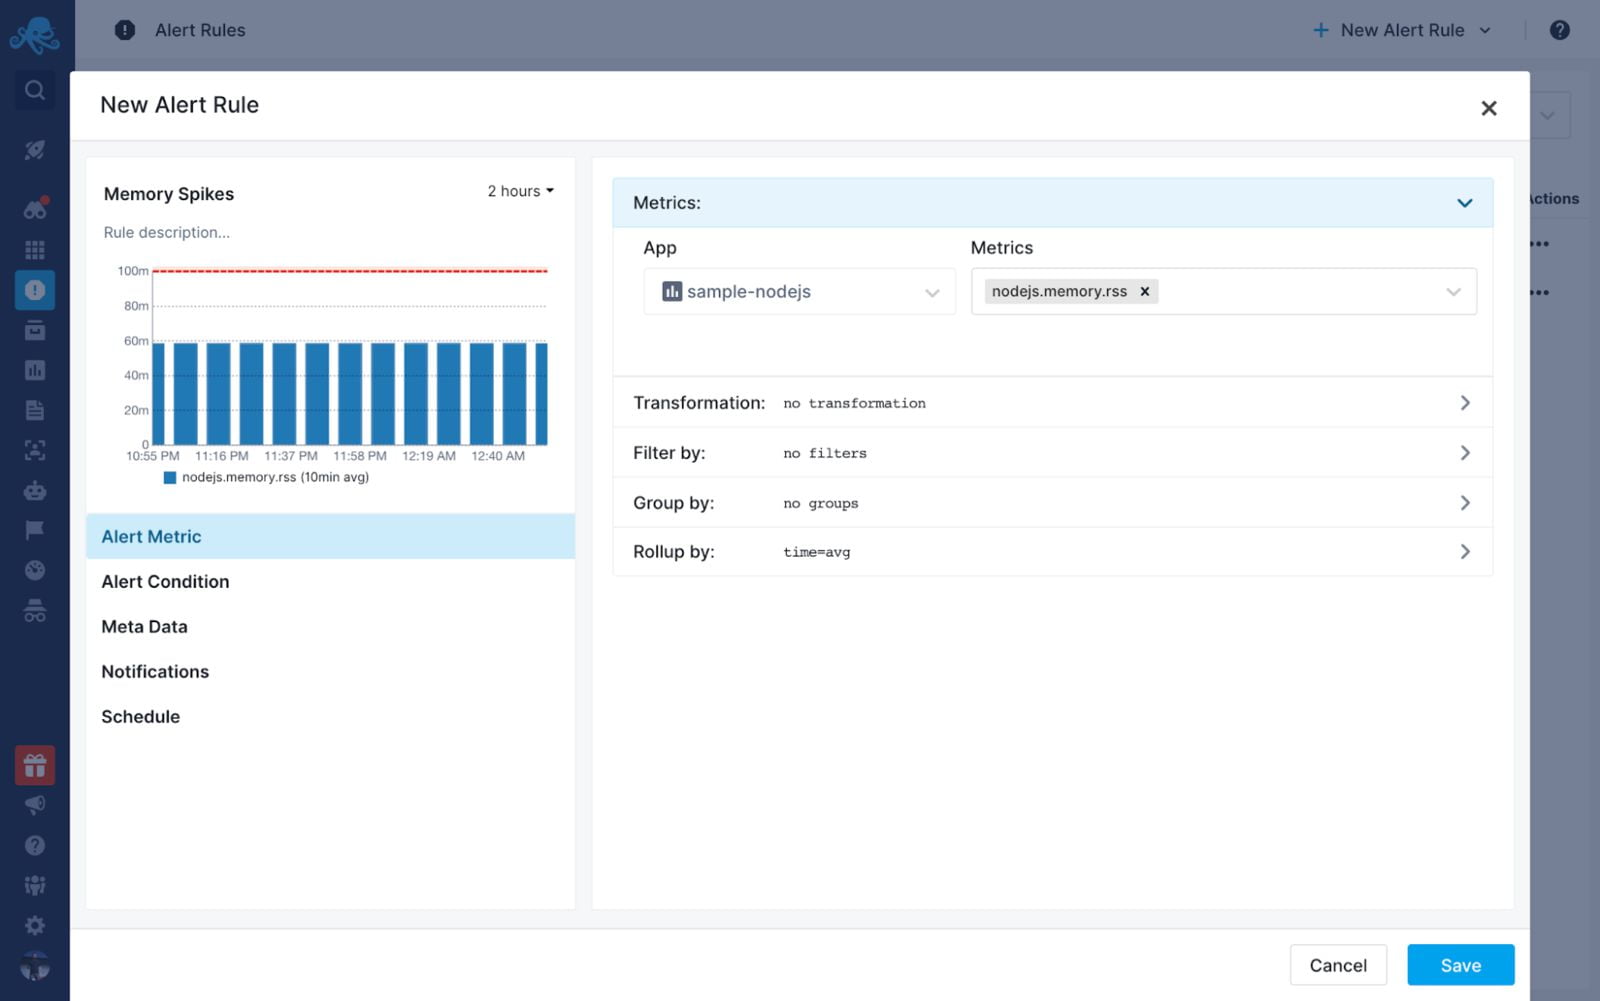
A great option when using a tool like Sematext is to create alerts when your memory reaches a certain threshold.
Here’s how you do it!
Click the Alert Rules on the left-hand side nav and create a new Alert Rule with the memory as a metric and the amount of memory you want to set to the threshold.
Want to learn more? Check out this quick video to see exactly what Sematext Monitoring is, and how it can help you.
Conclusion
This sure was a roller-coaster ride of emotions. You learned how to understand and debug the memory usage of a Node.js application and use monitoring tools such as Sematext Monitoring to get a complete insight into what is happening with the heap memory and garbage collection. Now you know how to detect Node.js memory leaks so they never go unnoticed. Hope this helps you build more reliable and performant Node.js apps, ultimately saving you time on debugging issues and your sanity. If you’re looking for the right solution for your use case, give Sematext a try! There’s a 14-day free trial available for you to test all its features.
Hope you liked reading this article, leave a comment and feel free to share your thoughts on Twitter!