Wouldn’t it be great to have metrics for your AWS resources captured in one place? And beyond just capturing them, to also have the ability to do useful things with those metrics like create custom dashboards, detect and get alerted on metric anomalies, correlate them with other application events and logs, etc., all in a single pane of glass? Well…you can! SPM Performance Monitoring Alerting and Anomaly Detection now captures metrics about your AWS resources via AWS CloudWatch. This includes system-wide visibility into resource utilization, application performance, and operational health.
Why is this important?
AWS shows metrics for various AWS resources in CloudWatch available via AWS Management Console. This is nice, but it is not very practical if you already use and prefer SPM for your non-AWS resources (e.g. servers and applications running in your data center) or if you are already shipping your logs to Logsene. Do you really want to use another, separate UI for monitoring just your AWS resources? It’s also not practical to use alerting in CloudWatch if you already use alerting and anomaly detection functionality in SPM. Now that SPM gathers metrics for your AWS resources you can have a single place to see all your metrics, alerts, and anomalies.
Today we are exposing all Elastic Cloud Compute (EC2), Elastic Load Balancer (ELB), and Elastic Block Store (EBS) metrics in SPM. We will continue to add other AWS services to this list. Having AWS metrics in SPM means that you can apply not only threshold-based alerting to your AWS metrics, which AWS itself provides, but also SPM Anomaly Detection which is much more useful and which AWS CloudWatch does not offer.
Headache-relieving and Time-saving Benefits for Your Organization
Major benefits to using SPM to monitor AWS CloudWatch include:
- there is nothing to install (i.e., it’s all agentless)
- AWS cost and performance optimization
- increase in transparency (i.e., now that AWS metrics are in a common monitoring app more people in your organization can see what you have running in AWS)
Have a look at a few of the screenshots to see some of the AWS metrics SPM graphs. You can also check out SPM’s live demo. Or, if you prefer to see the full list of AWS metrics SPM captures, just jump down past the screenshots to see them listed below.
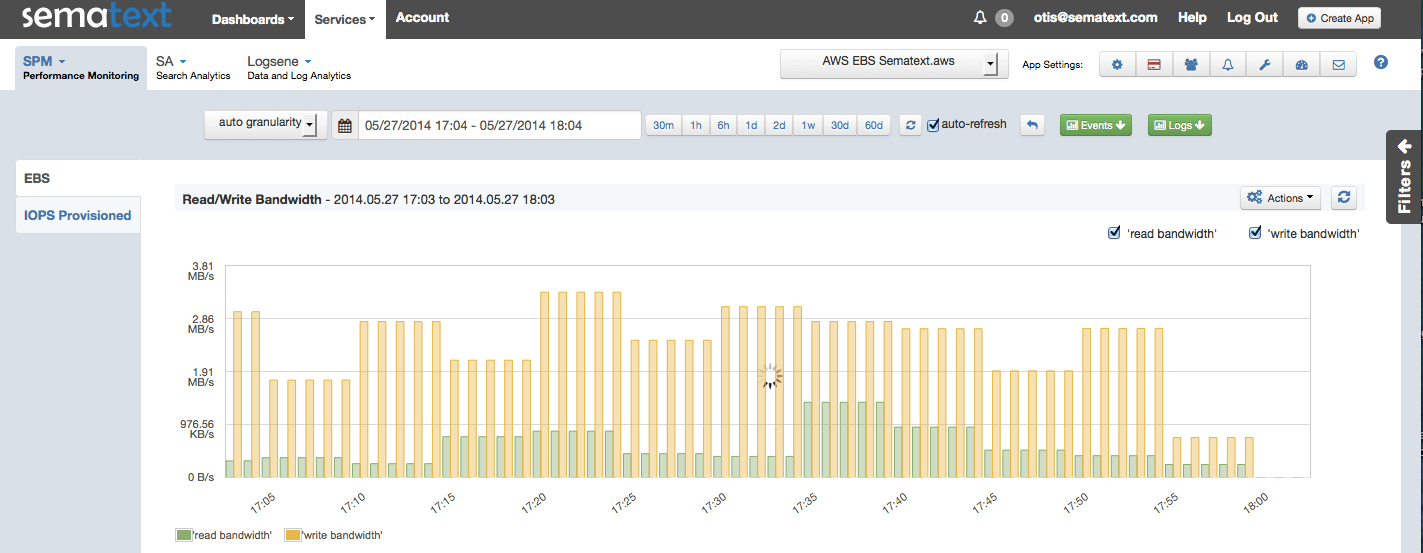
EBS Read/Write Bandwidth (click to enlarge)
EBS Read/Write Latency (click to enlarge)
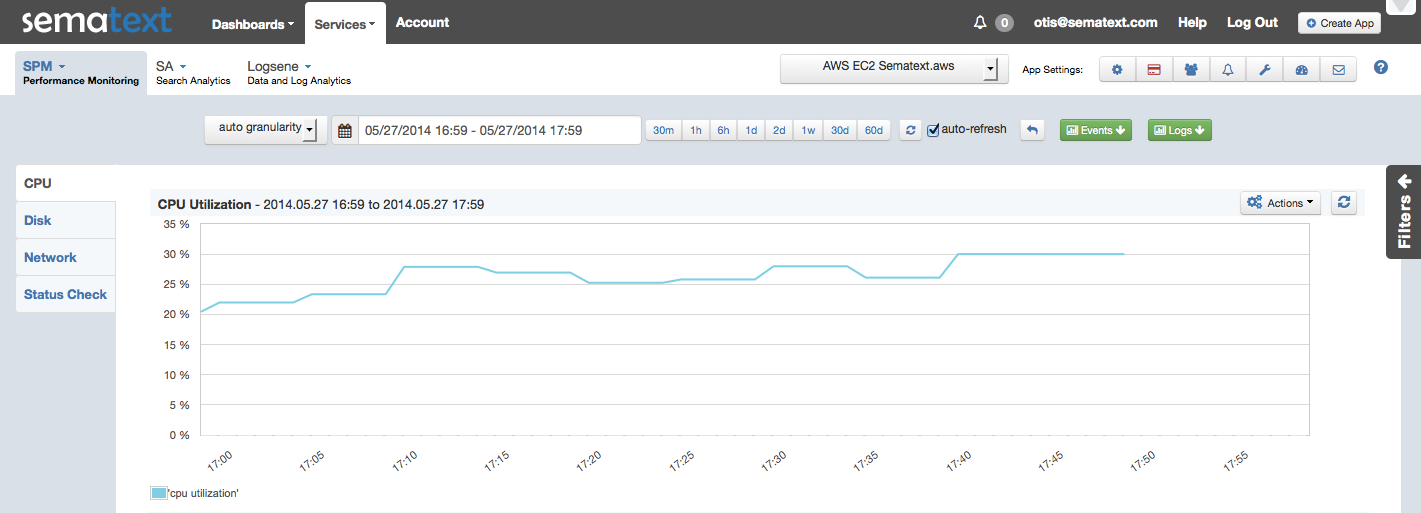
EC2 CPU Utilization (click to enlarge)
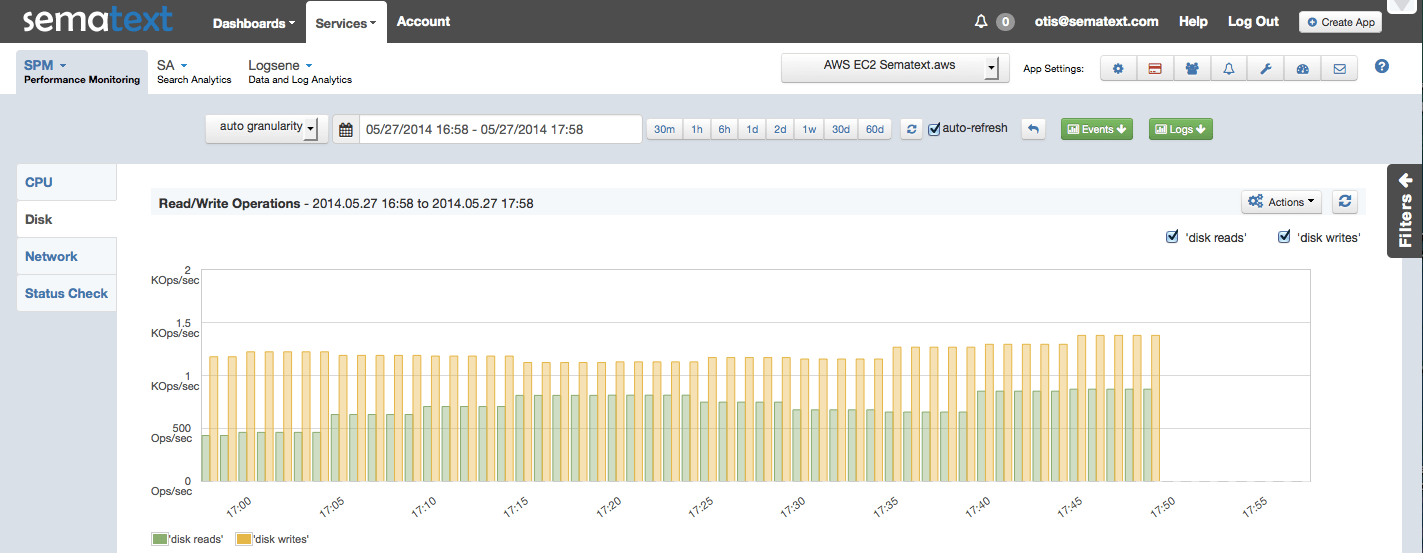
EC2 Read/Write Operations per Second (click to enlarge)
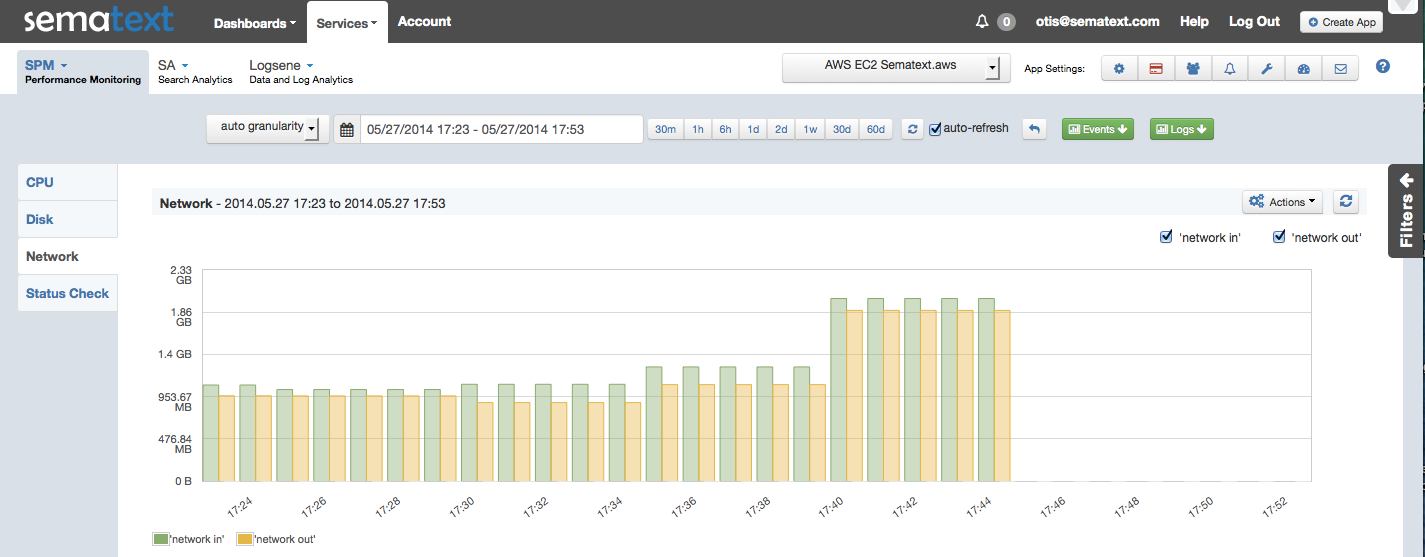
EC2 Network In/Out (click to enlarge)
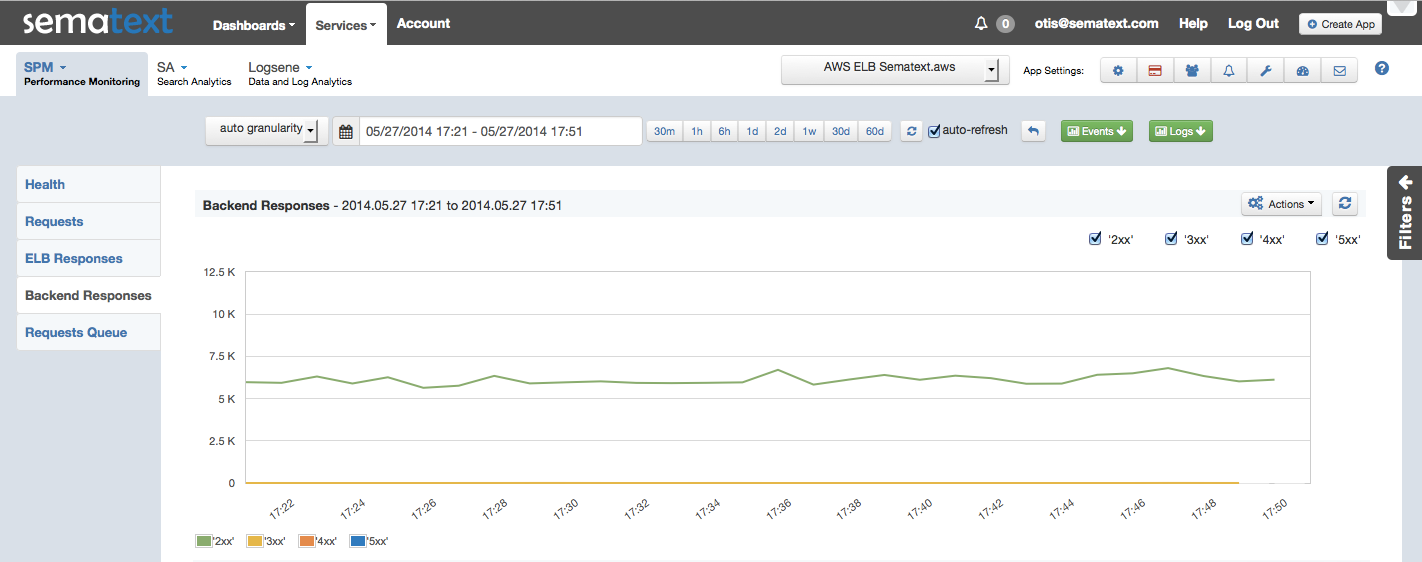
ELB Backend 2XX/3XX/4XX/5XX Response Counts (click to enlarge)
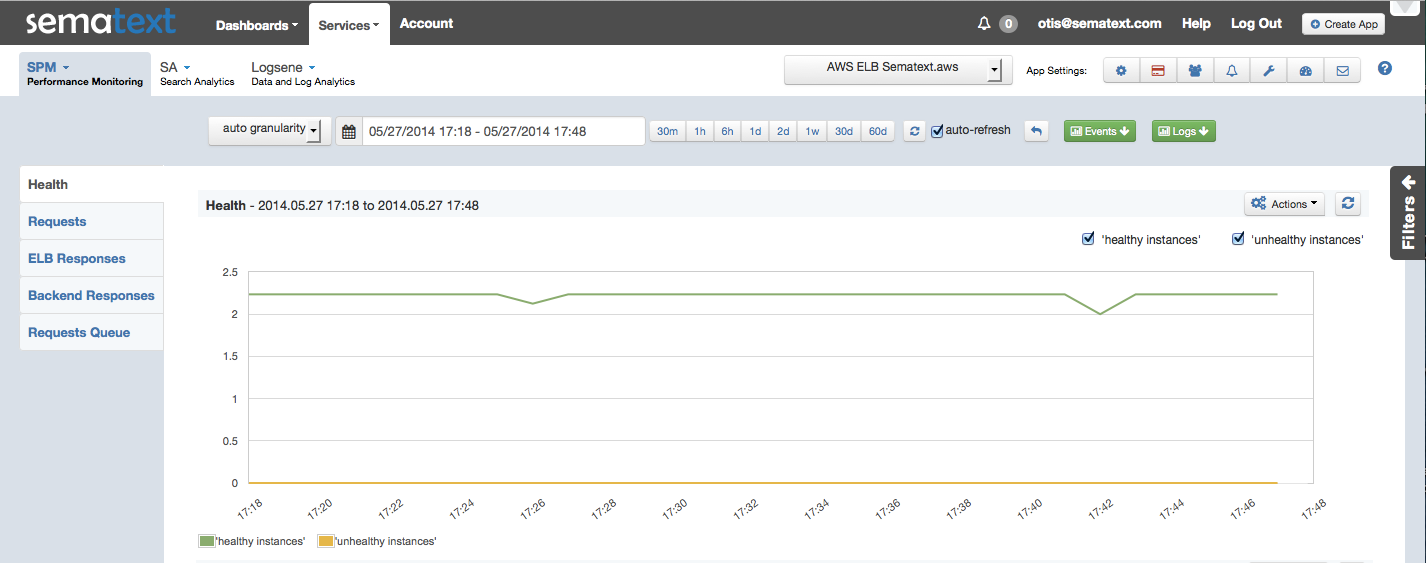
ELB Healthy and Unhealthy Instance Counts (click to enlarge)
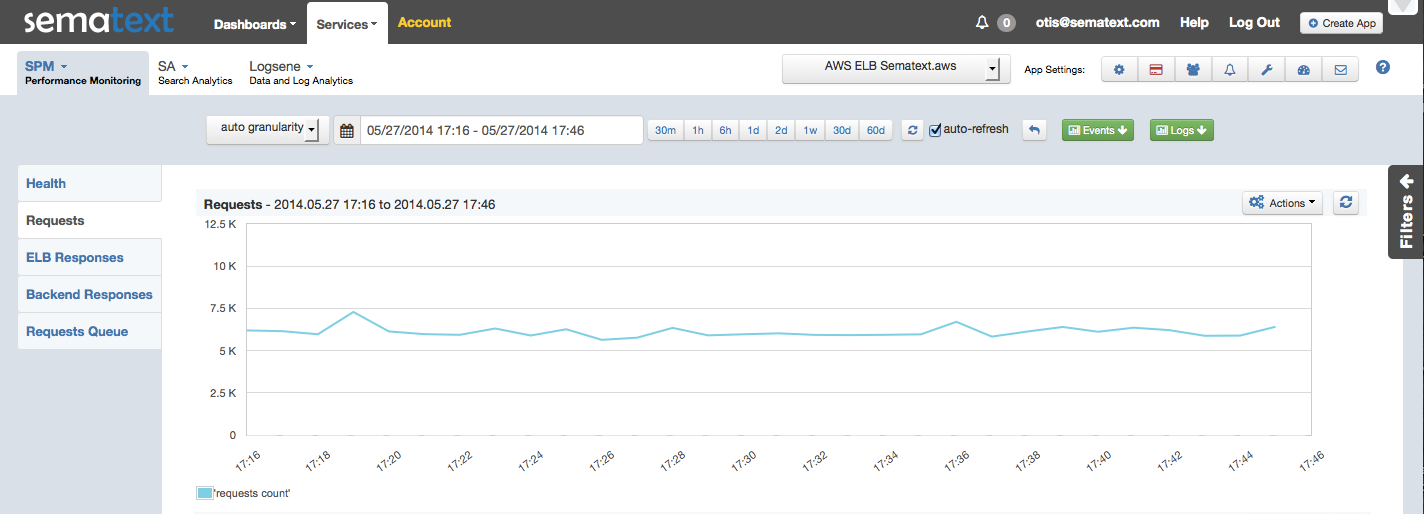
ELB Request Count (click to enlarge)
AWS Metrics List
Here is the complete list of AWS metrics that SPM gathers as of today:
EC2:
- CPU Utilization
- Disk Read Operations
- Disk Write Operations
- Disk Read Bytes
- Disk Write Bytes
- Network In
- Network Out
- Status Check Failed
- Status Check Failed (Instance)
- Status Check Failed (System)
ELB:
- Healthy Host Count
- UnHealthy Host Count
- Request Count
- Latency
- ELB 4XX Responses Count
- ELB 5XX Responses Count
- Backend 2XX Responses Count
- Backend 3XX Responses Count
- Backend 4XX Responses Count
- Backend 5XX Responses Count
- Backend Connection Errors Count
- Surge Queue Length
- Spillover Count
EBS:
- Volume Read Bytes
- Volume Write Bytes
- Volume Read Ops
- Volume Write Ops
- Volume Total Read Time
- Volume Total Write Time
- Volume Idle Time
- Volume Queue Length
Metrics available for IOPS provisioned instances:
- VolumeThroughputPercentage
- VolumeConsumedReadWriteOps
Please tell us what you think – @sematext is always listening! Is there something SPM Performance Monitoring doesn’t monitor that you would really like to monitor?
Try SPM for Free for 14 Days
Try SPM Performance Monitoring for Free for 14 days by registering here. There’s no commitment and no credit card required.
We’re Hiring!
If you enjoy performance monitoring, log analytics, or search analytics, working with projects like Elasticsearch, Solr, HBase, Hadoop, Kafka, and Storm, then drop us a line. We’re hiring planet-wide! Front end and JavaScript Developers, Developer Evangelists, Full-stack Engineers, Mobile App Developers…get in touch!
