A new SPM Performance Monitoring release was just pushed to production and it’s chock full of great new stuff to complement its proactive performance monitoring, alerting, anomaly detection, etc., available in the Cloud or On Premise. Here is a run-down of the juicier additions. The slightly longer version can be found in the SPM Changelog.
Integration with Logsene Log Management and Analytics
SPM performance monitoring now gives users access to even more metrics by seamlessly integrating with event data and logs via Logsene Log Management and Analytics. This enables correlation across performance metrics, alerts, anomalies, events, logs, and provides a single pane of glass across any organization’s IT infrastructure.
Monitoring Support for More Applications
We’ve added native monitoring support for the following applications to complement monitoring for Solr, Elasticsearch, Hadoop, HBase, Storm, Redis, Kafka, ZooKeeper and many others.
Screenshots
Eager to see pictures instead of reading content? Then jump below to see screenshots of these apps being monitored.
UI/UX Improvements
UI/UX improvements include: zooming and panning, client-side caching, wider and simpler metric charts, new filter slide-out panels with search capabilities, quick access to all dashboards and easier dashboard creation, and more.
Event Graphs
Events and event graphs are now integrated into SPM Performance Monitoring. You can now correlate various types of events, such as alerts, anomalies, application deployments, restarts, releases, server reboots, etc., with performance metrics graphs, as well as with logs and log graphs. Many of you will also be happy to hear that SPM can now turn Alerts into Events, and graph them as well. Check out Event Integration if you want to publish your own Events.
More Powerful Storm Monitoring
SPM Storm monitoring now serves up more metrics, more graphs and provides more granular details. This includes the addition of metric filters and the ability to monitor not just Spouts and Bolts, but also monitor Storm Workers.
Dashboard Enhancements
Creating and working with dashboards just got a lot more intuitive and flexible. This includes:
- creating new dashboards via an intuitive “build your own dashboard” tool
- easier navigation via Miller Columns (think column-oriented view in OSX Finder)
- adding whatever graphs you want to an existing or brand new dashboard from within that dashboard
- a pull down menu to select specific dashboards for much quicker access to a specific dashboard
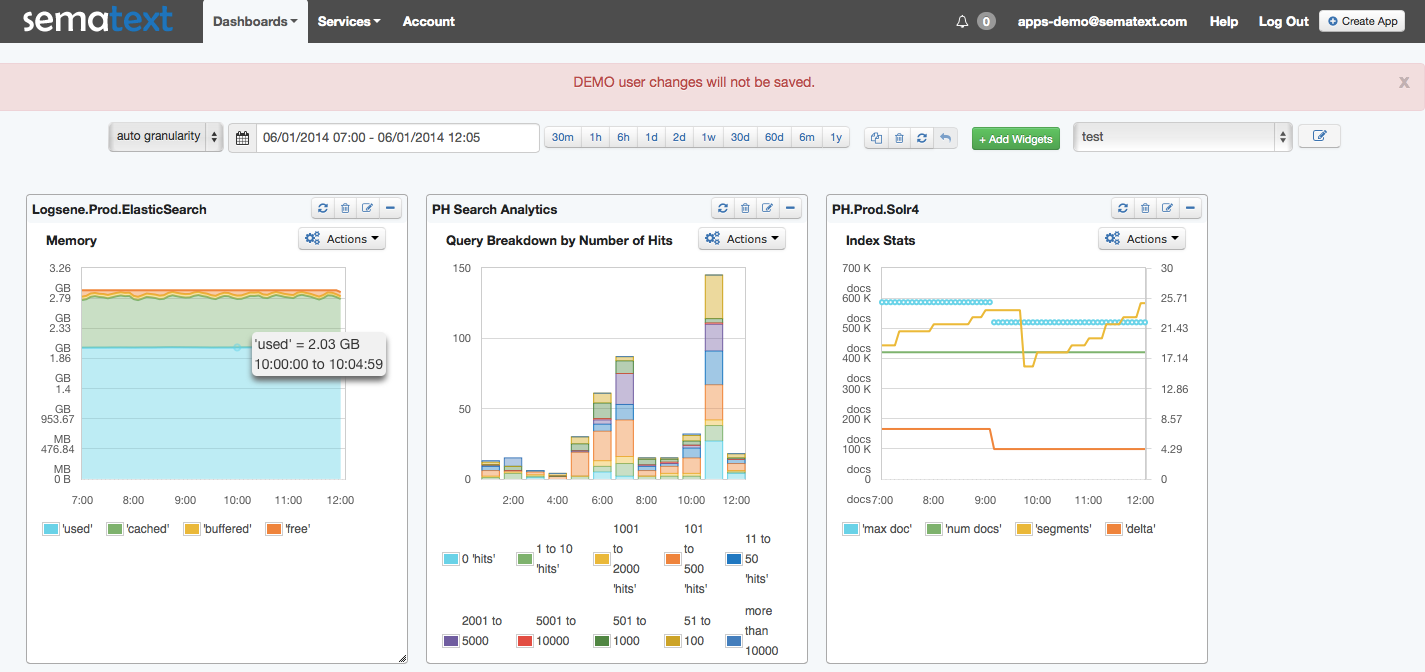
Screenshot – SPM Dashboard (one of many possible views; click to enlarge)
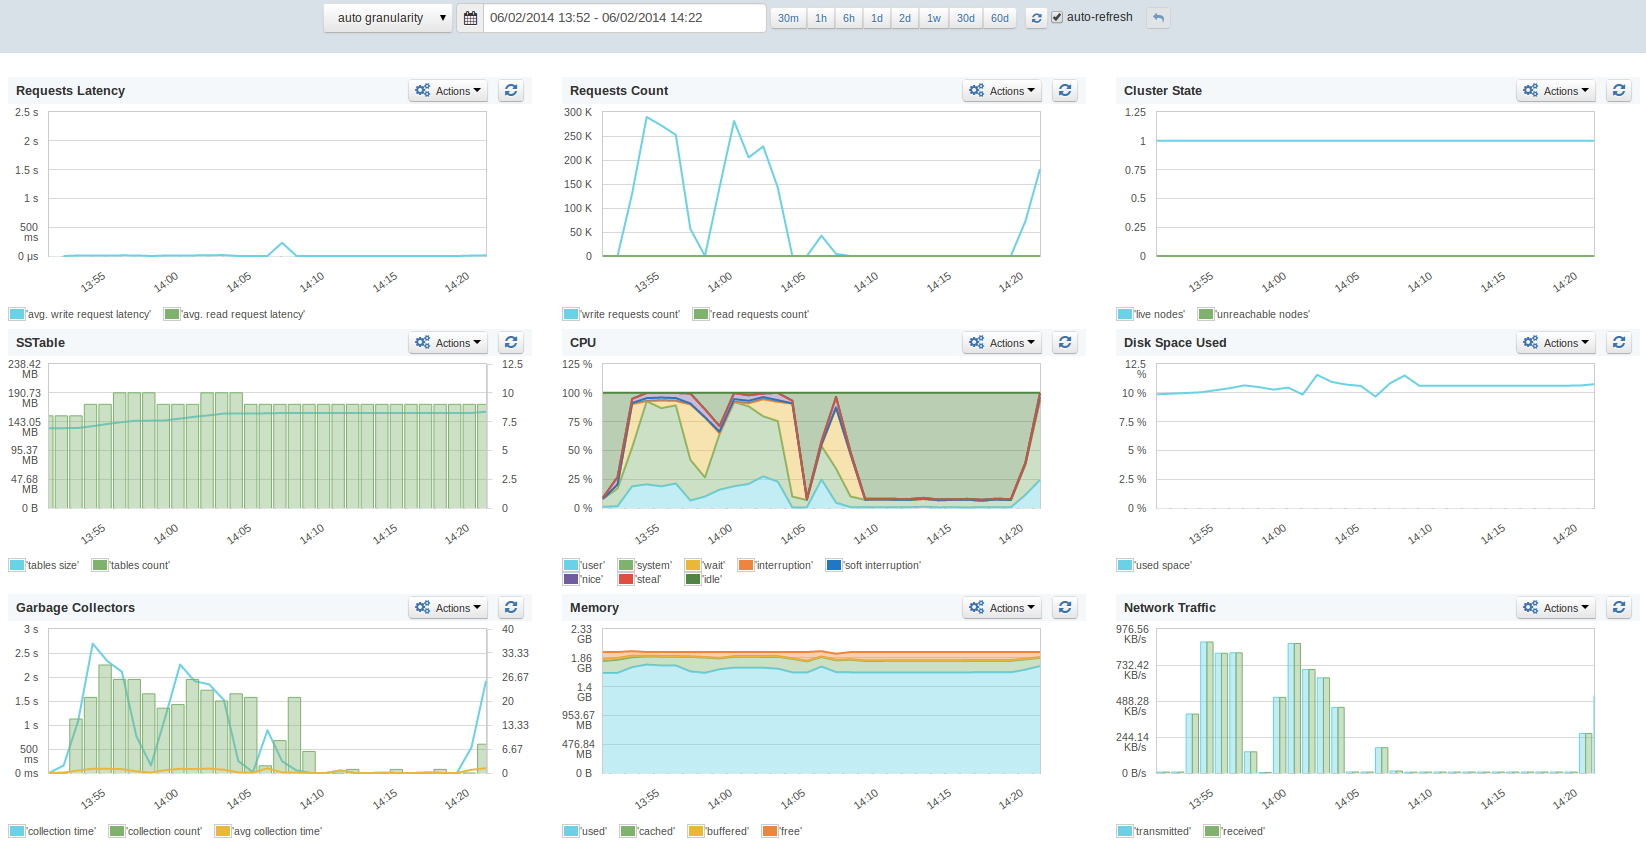
Screenshot – Cassandra Overview (click to enlarge)
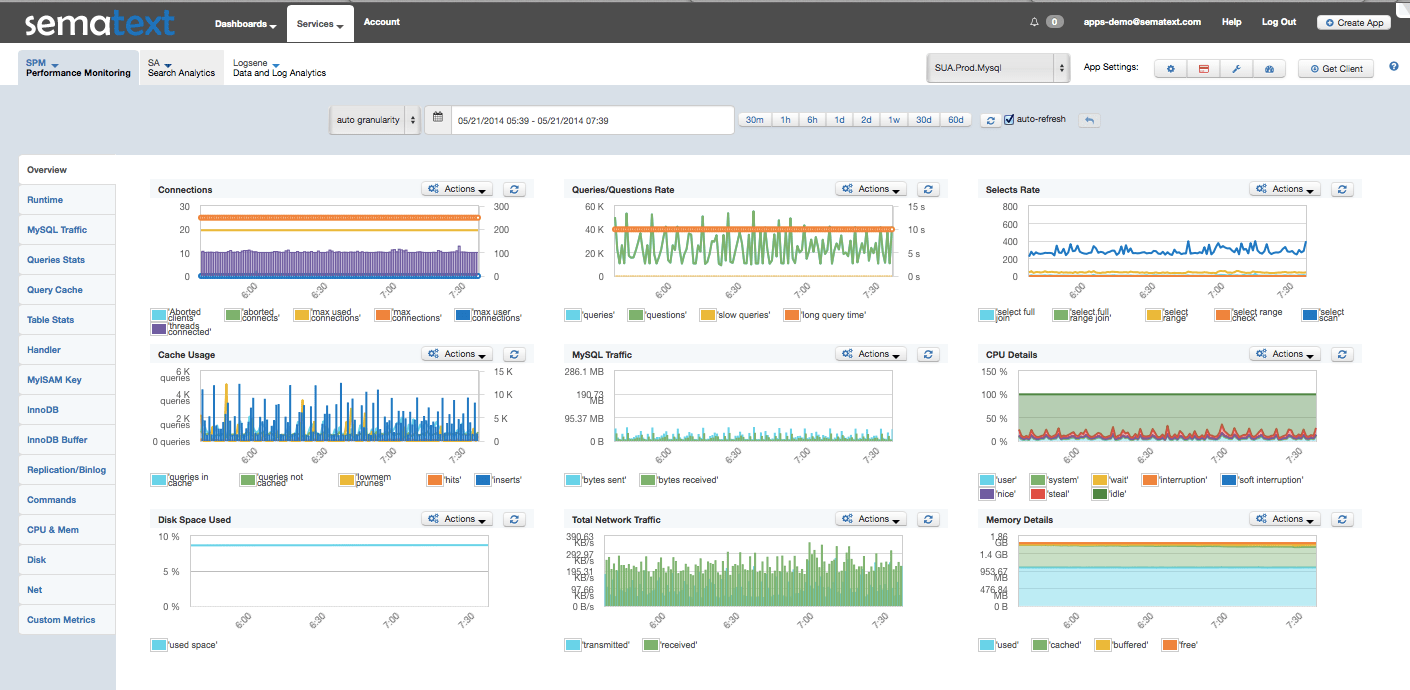
Screenshot – MySQL Overview (click to enlarge)
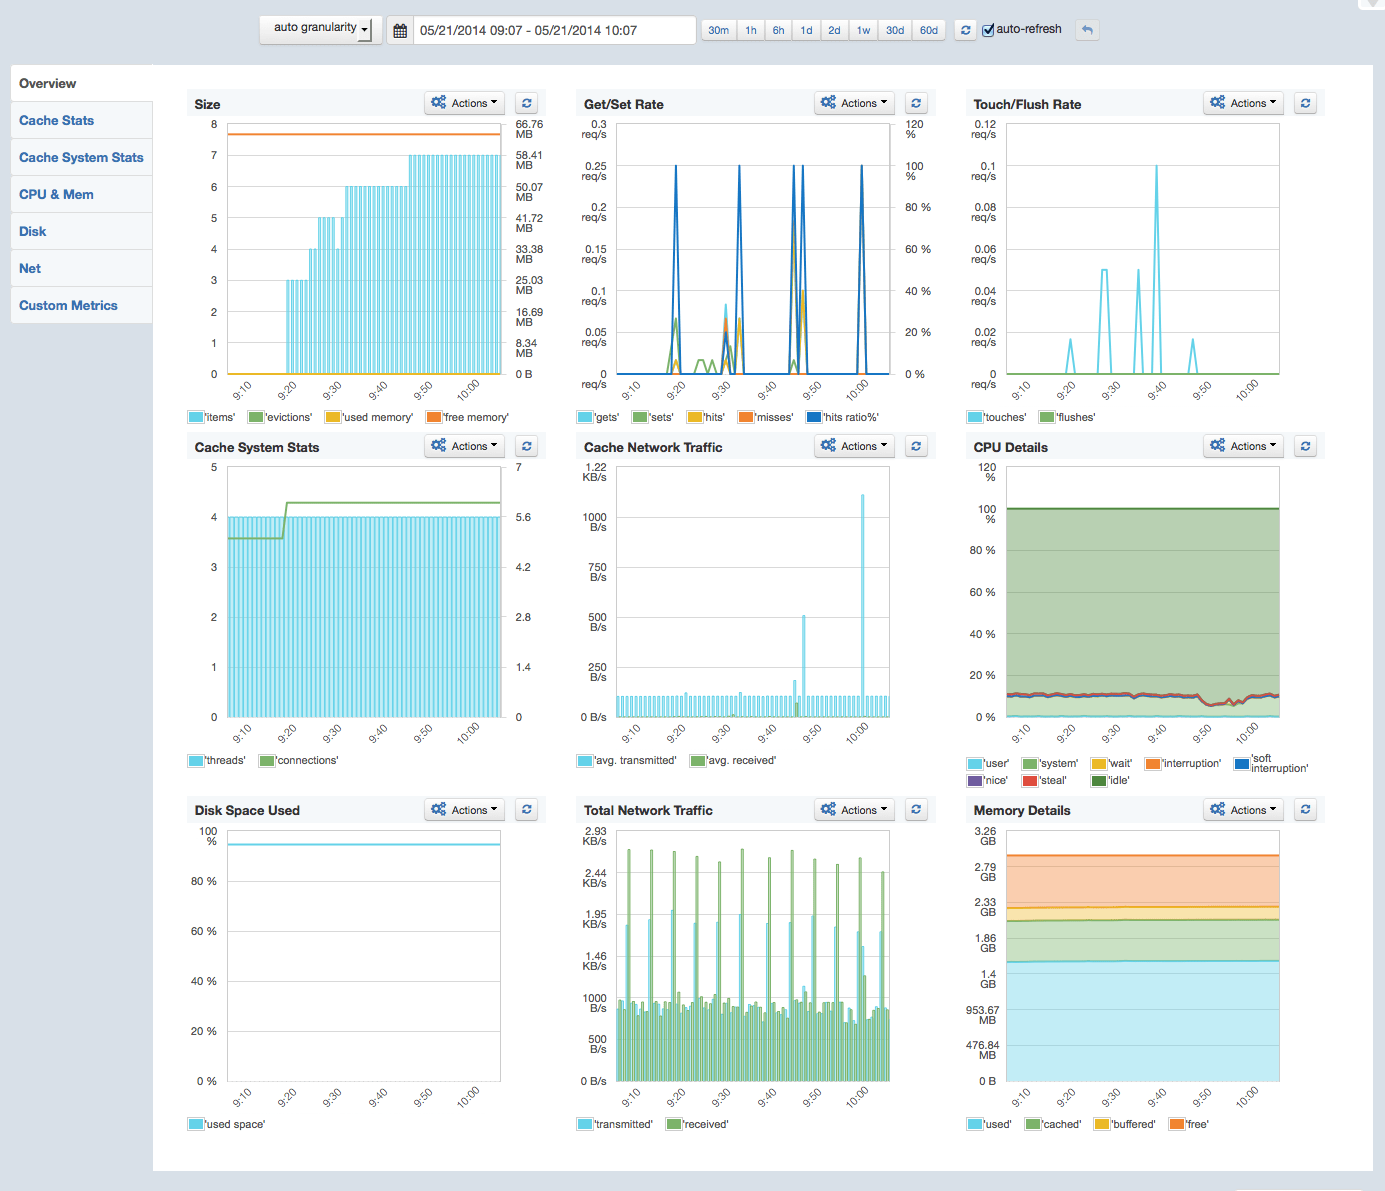
Screenshot – Memcached Overview (click to enlarge)
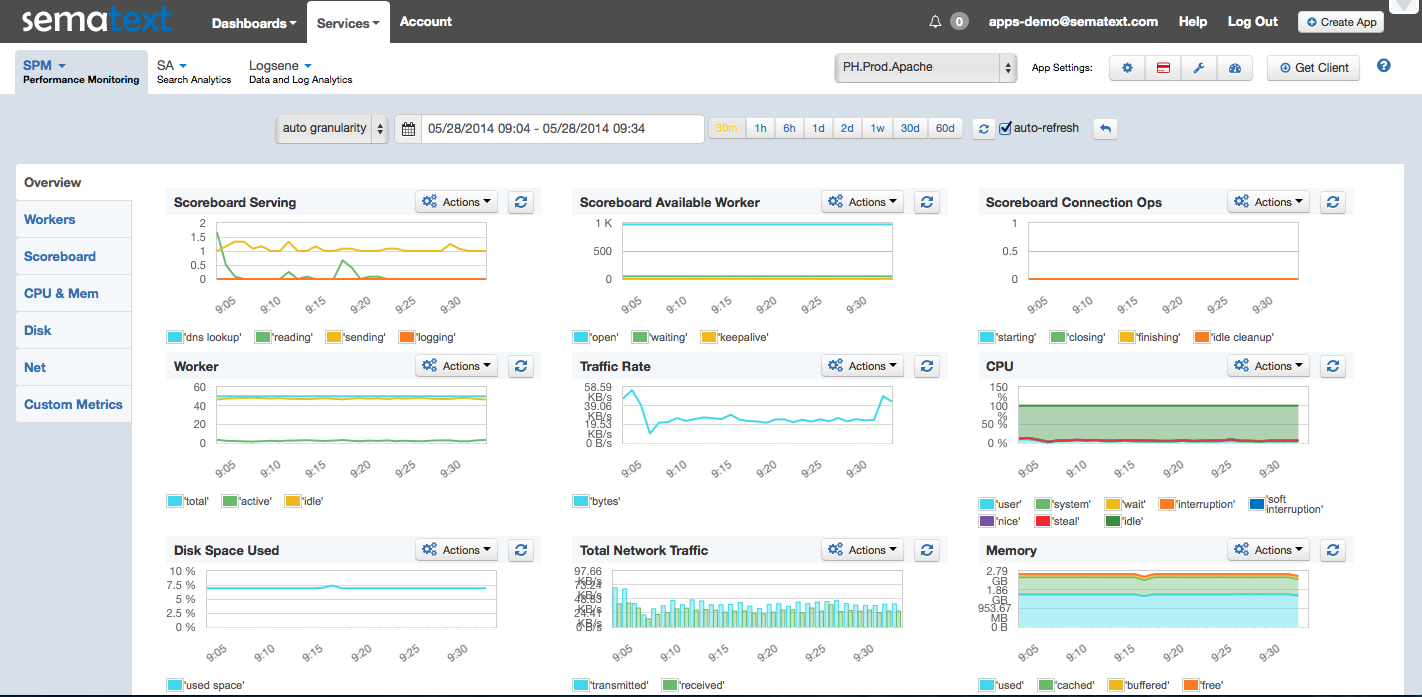
Screenshot – Apache Monitoring Overview (click to enlarge)
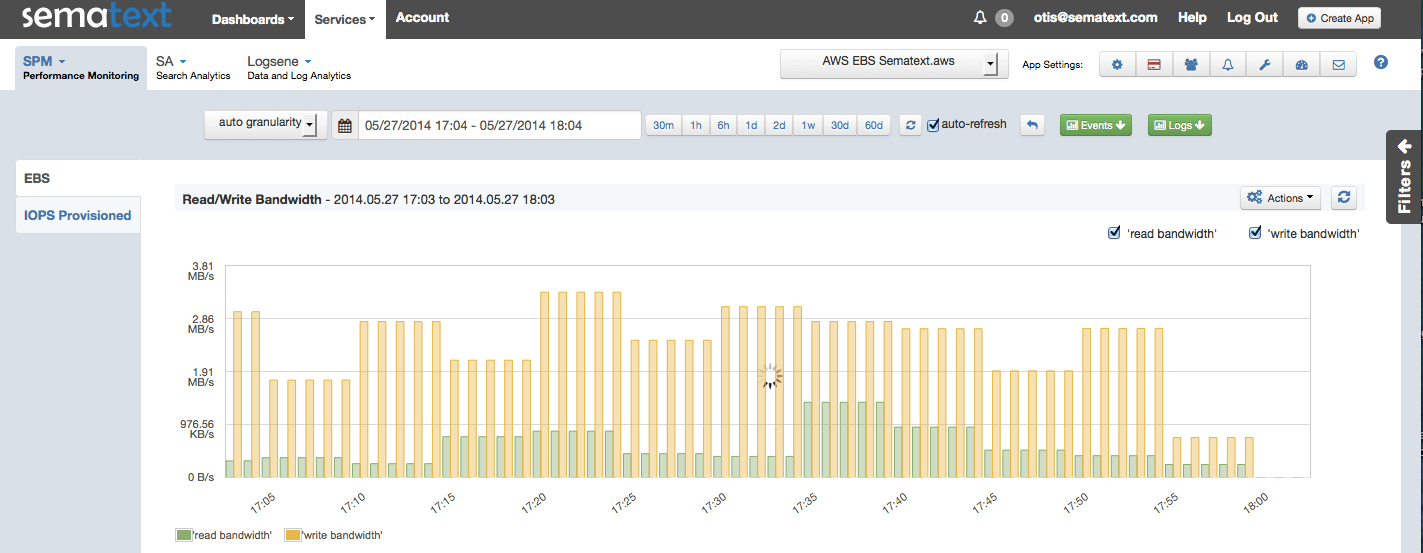
Screenshot – AWS CloudWatch EBS Read/Write Bandwidth (click to enlarge)
Live Demo
Check out SPM’s live demo to see it for yourself. You won’t find any demo apps showing Cassandra or Memcached metrics because we don’t use them at Sematext yet, but you’ll be able to poke around and see other types of apps being monitored — like Solr, Kafka, Hadoop and HBase, for example — along with MySQL, AWS, and Apache.
Consolidate Your App Monitoring — It’s Easy!
Many organizations tackle performance monitoring with a mish-mash of different monitoring and alerting tools cobbled together in an uneasy coexistence that is often far from seamless. SPM takes all that hassle away and makes it easy and comprehensive in one step.
Try SPM for Free for 14 Days
Try SPM Performance Monitoring for Free for 14 days by registering here. There’s no commitment and no credit card required.
We’re Hiring!
If you enjoy performance monitoring, log analytics, or search analytics, working with projects like Elasticsearch, Solr, HBase, Hadoop, Kafka, and Storm, then drop us a line. We’re hiring planet-wide! Front end and JavaScript Developers, Developer Evangelists, Full-stack Engineers, Mobile App Developers…get in touch!
