Kafka, Storm and Cassandra — Big Data’s Three Amigos? Not quite. And while much less humorous than the movie, this often-used-together trio of tools work closely together to make in-stream processing as smooth, immediate and efficient as possible. Needless to say, it makes a lot of sense to monitor them together. And since you’re reading the Sematext blog you shouldn’t be surprised to hear that we offer an all-in-one solution that can be used for Kafka, Storm and Cassandra performance monitoring, alerts and anomaly detection — SPM Performance Monitoring. Moreover, if you ship logs from any of these three systems to Logsene, you can correlate not only metrics from these three systems but also their logs and really any other type of event!
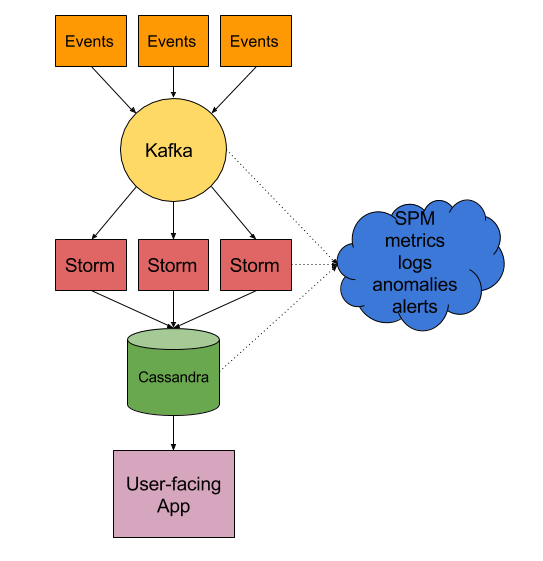
Enough with all the words — here is an illustration of how these three tools typically work together:
Of course, you could also be storing data into some other type of data store, like Elasticsearch or HBase or MySQL or Solr or Redis. SPM monitors all of them, too.
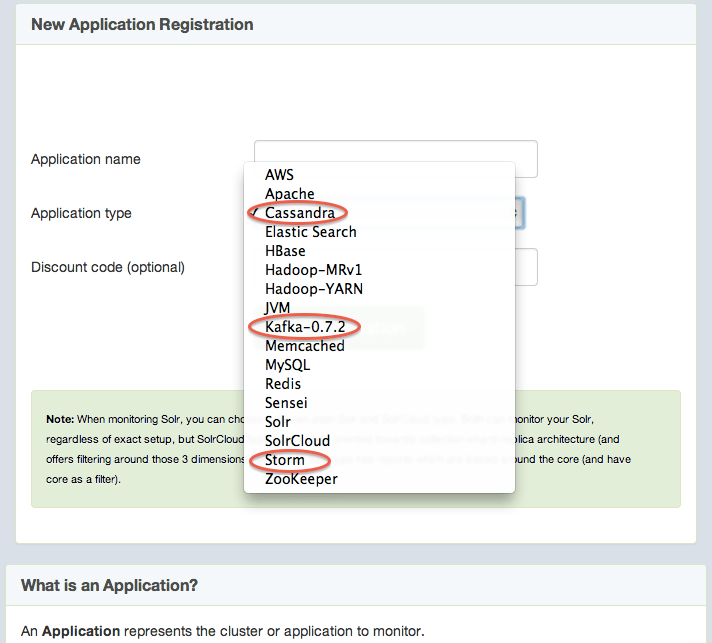
So what do you get if you monitor Kafka, Storm, and Cassandra with SPM?
You get a single pane pane of glass, a single access point through which you can see visualizations of well over 100 metrics you can slice and dice by a number applications-specific dimensions. For example, various Kafka performance metrics can be filtered by one or more topics, while some Storm performance metrics can be filtered by topology or worker. Of course, you can set alerts on any of the metrics and you can even make use of SPM’s anomaly detection capabilities.
Consolidate Your App Monitoring, Alerting, and Centralize Logging — It’s Easy!
Many organizations tackle performance monitoring with a mish-mash of different monitoring and alerting tools cobbled together in an uneasy coexistence that is often far from seamless. SPM takes all that hassle away and makes it easy and comprehensive in one step.
Live Demo — See SPM for Yourself
Check out SPM’s live demo to see this monitoring for yourself. You won’t find any demo apps showing Cassandra metrics because we don’t use it at Sematext yet, but you’ll be able to poke around and see Kafka, HBase, Elasticsearch, MySQL, and other types of apps being monitored.
See how Sematext SPM stacks up against other similar tools in our full reviews:
Love the Idea of Monitoring Kafka, Storm & Cassandra Together?
Take a Test Drive — It’s Easy to Get Started.
Try SPM Performance Monitoring for Free for 14 days by registering here. There’s no commitment and no credit card required.
We’re Hiring!
If you enjoy performance monitoring, log analytics, or search analytics, working with projects like Elasticsearch, Solr, HBase, Hadoop, Kafka, and Storm, then drop us a line. We’re hiring planet-wide! Front end and JavaScript Developers, Developer Evangelists, Full-stack Engineers, Mobile App Developers…get in touch!

