If you are running apps on top of JVM and want to be able to profile them in production, on-demand, without affecting your app’s performance and users, read on! Screenshots, features, and other juicy stuff are further down.
Do you run any apps on the JVM? How do you find bottlenecks in your apps once they are in production, so you can optimize them? If they become slow, how do you find which part of code in your app is slow?
Maybe you look at JVM metrics like Garbage Collection. Maybe you run commands like jstat to see if various memory pools are full or if there are too many FGCs (Full Garbage Collections). Or perhaps you run jstack or do kill -SIGHUP PID and look at thread dumps?
All of these are reasonable Java monitoring approaches… until your infrastructure grows and/or you get tired of running around, sshing to machines, running jstat and jstack or kill with sudo so you have sufficient rights to execute those commands, and so on.
Another way to tackle this is to simply have your standard profiler attached to the process, or try to attach it on the fly, but that tends to be difficult, requires more manual work, and we all know full-blown profilers typically slow down apps to the point where they could become unusable. In short, such a profiling approach is not really suitable for production.
There’s got to be a better way, right?
Indeed, there is. Meet Sematext Monitoring‘s On-demand JVM Profiler!
This low-impact profiler is designed to help you identify bottlenecks in your production environment without slowing down your apps. It provides rich analysis of the running code, much like a typical profiler.
What Types of Apps can you Profile?
The Sematext JVM profiler can profile anything that runs on top of the JVM. This means it can profile Java apps, Scala apps, even things like Clojure and Groovy. You are not limited to profiling only your own apps – the apps you developed. You can also use it to profile any of the other integrations that run on the JVM – you profile your webapps running in Tomcat, Jetty, JBoss, or Glassfish, you can profile Solr or Elasticsearch, Spark, Kafka, Storm, and so on.
See also: Java Monitoring Guide
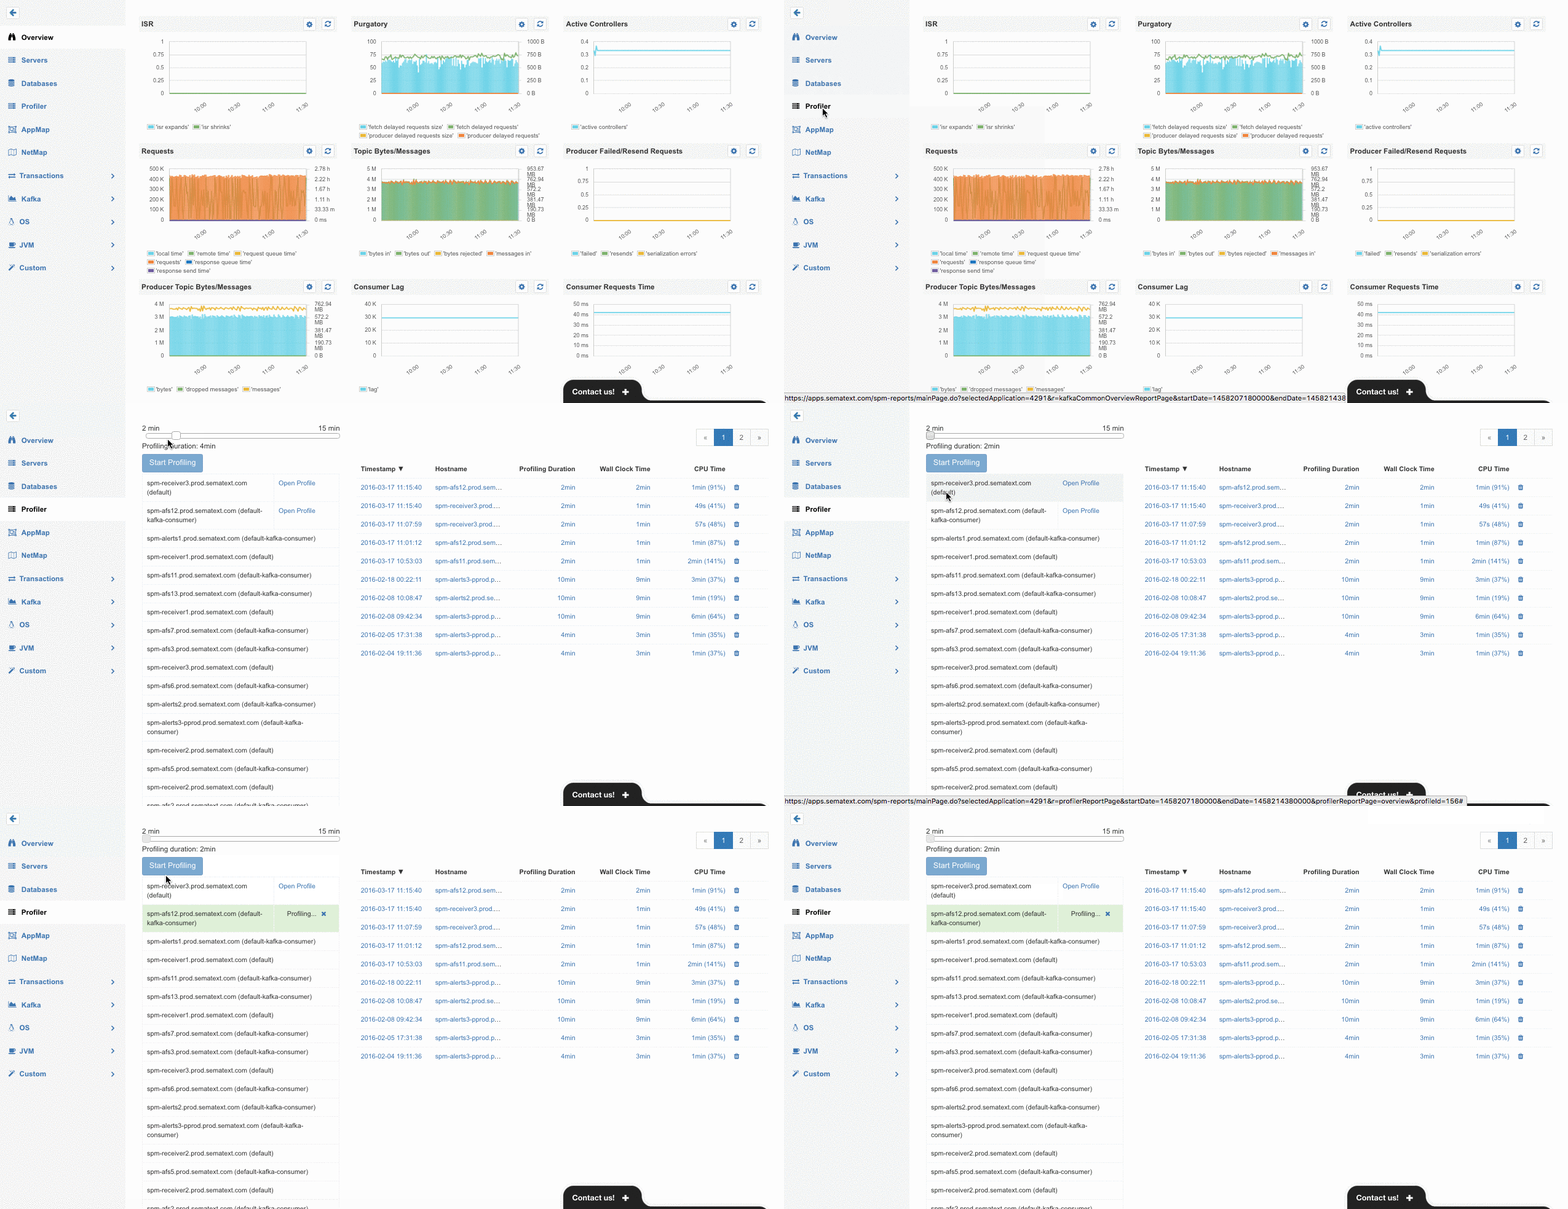
How to Profile your Java applications with Sematext
If your Sematext agent version is 1.29.2 or newer, you’re set. If you have an older version update it first.
You specify the application you want to profile by:
- selecting the Sematext agent that monitors it,
- how long you want profile it,
- … and Sematext does the rest.
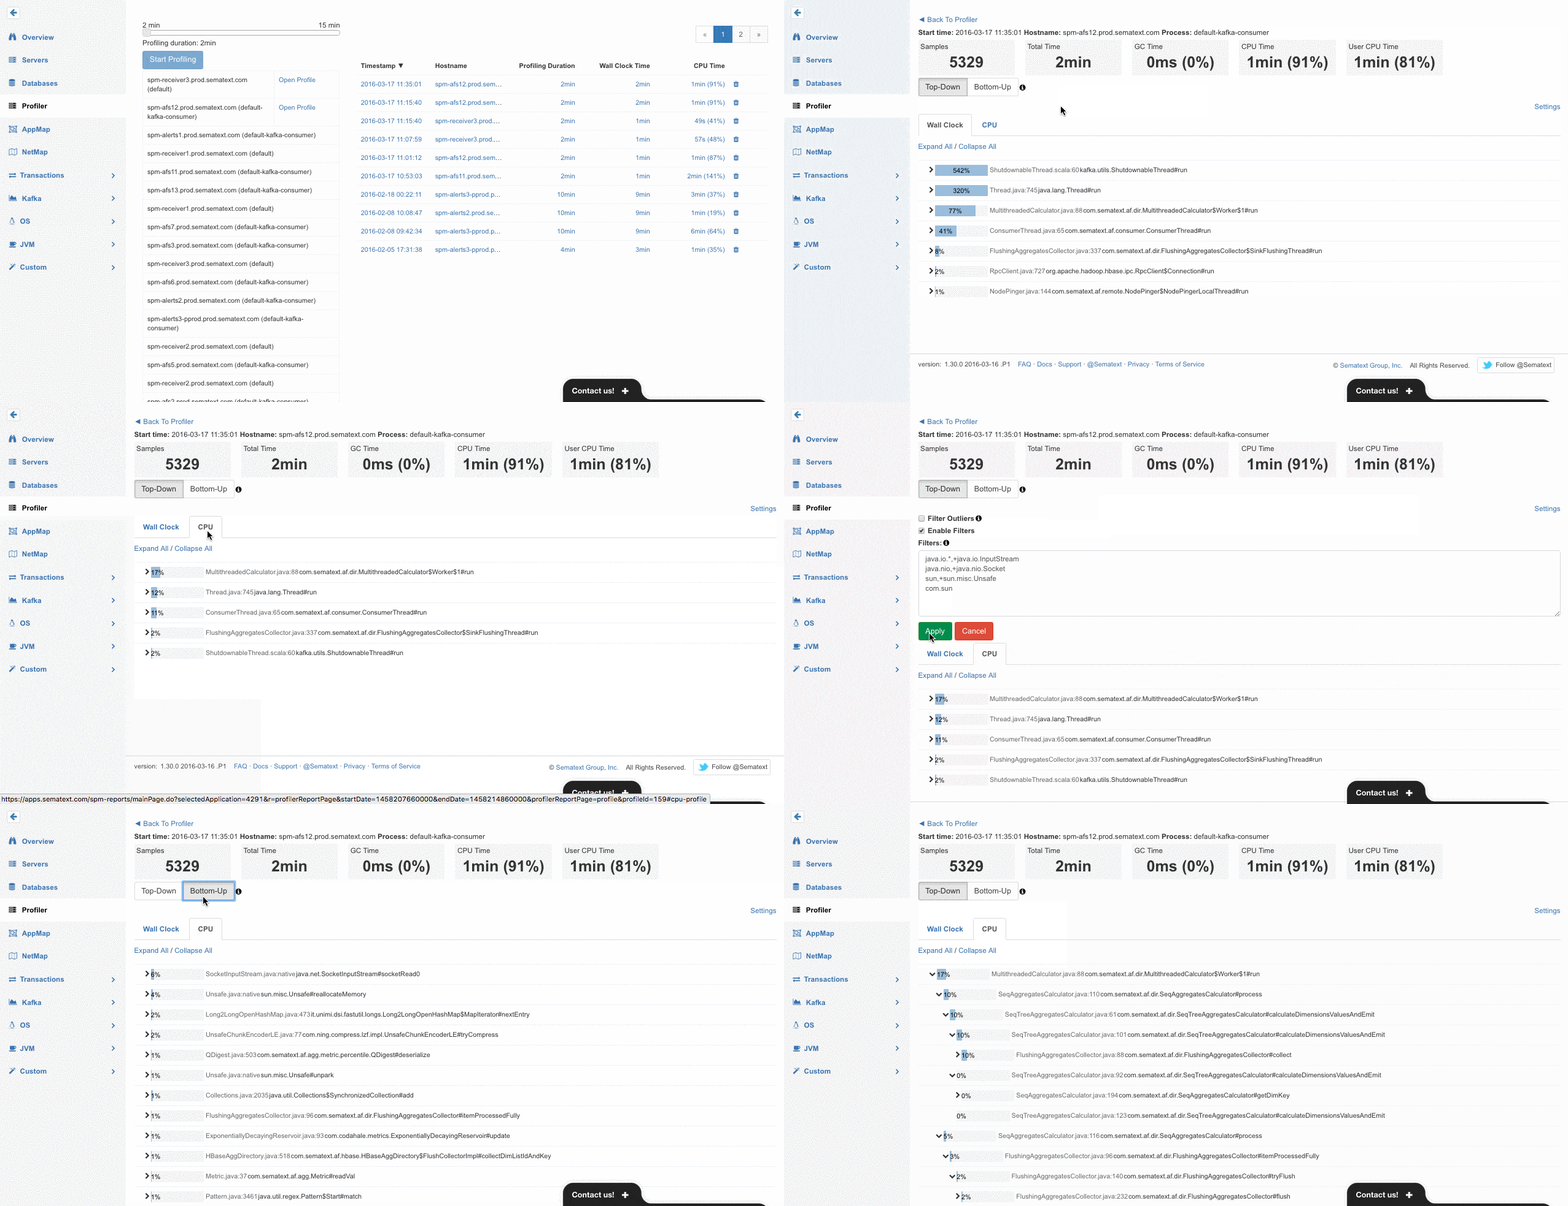
The selected agent will then start profiling. When done, the profiler will show you things like time spent in various methods and in their children. It will show you the call tree, which you can look at top-down or bottom-up, etc. It is really quite useful — in our very first profiler test run we immediately identified a suboptimal piece of code in one of our own applications! Talking about instant gratification!
Profiling Features and Benefits
With Sematext’s On-demand profiler you can:
- Profile anything that runs on the JVM, such as Java, Scala, Clojure, Groovy, etc.
- Start the profiling on demand and without having to add anything to the Java command-line and without needing to restart the process/app you want to monitor.
- Find the root cause of performance bottlenecks in your or in 3rd party apps.
- Capture stack traces and view aggregated call trees that let you drill down to a specific line in a method.
- View the profiled call stack using top-down or bottom-up fashion. The former shows a standard call tree from the entry point/method down to the leaf methods being called, while bottom-up surfaces the hottest methods and points out from where they are called.
- See both CPU and Wall clock time. The former shows how much CPU time is taken by each method, while Wall clock time shows how much real time each method took.
- Exclude specific classes and methods from profiling through easy to use filtering. This helps reduce the noise and volume of output, thus making it easier and faster to analyze.
- Hide outliers – methods which are either not called frequently or are super fast and thus not worth looking at.
We hope you like this new addition to Sematext. Got ideas how we could make it more useful for you? Let us know via comments, email or @sematext.
Not using Sematext yet? Check out the free 30-day trial by registering here. There’s no commitment and no credit card required. We even offer On Premises Sematext Monitoring and Sematext Logs packages in addition to SaaS if that’s more to your liking. And, even better — combine Monitoring with Logs to make the integration of JVM metrics, Java logs, events, and anomalies more robust for those looking for a single pane of glass.

