[Note: This post is part of a series on Transaction Tracing — links to the other posts are at the bottom of this post]
If you missed the Distributed Transaction Tracing Intro, here’s the key bit you should know:
Distributed Transaction Tracing is great for:
- Pinpointing root causes of poor application performance
- Finding the slowest parts of your application
- Tracing requests across networks and apps (hence “Distributed”!)
- Works for Java and Scala apps
It’s also worth repeating that enabling Transaction Tracing provides more than just transaction traces, such as:
- Your app’s Request Throughput, Response Latency, plus Error & Exception Rates
- AppMap, which which how various components in your infrastructure communicate with each other
Now let’s run through a few reports Transaction Tracing provides in SPM.
Top 10 Slowest / Fastest Controllers
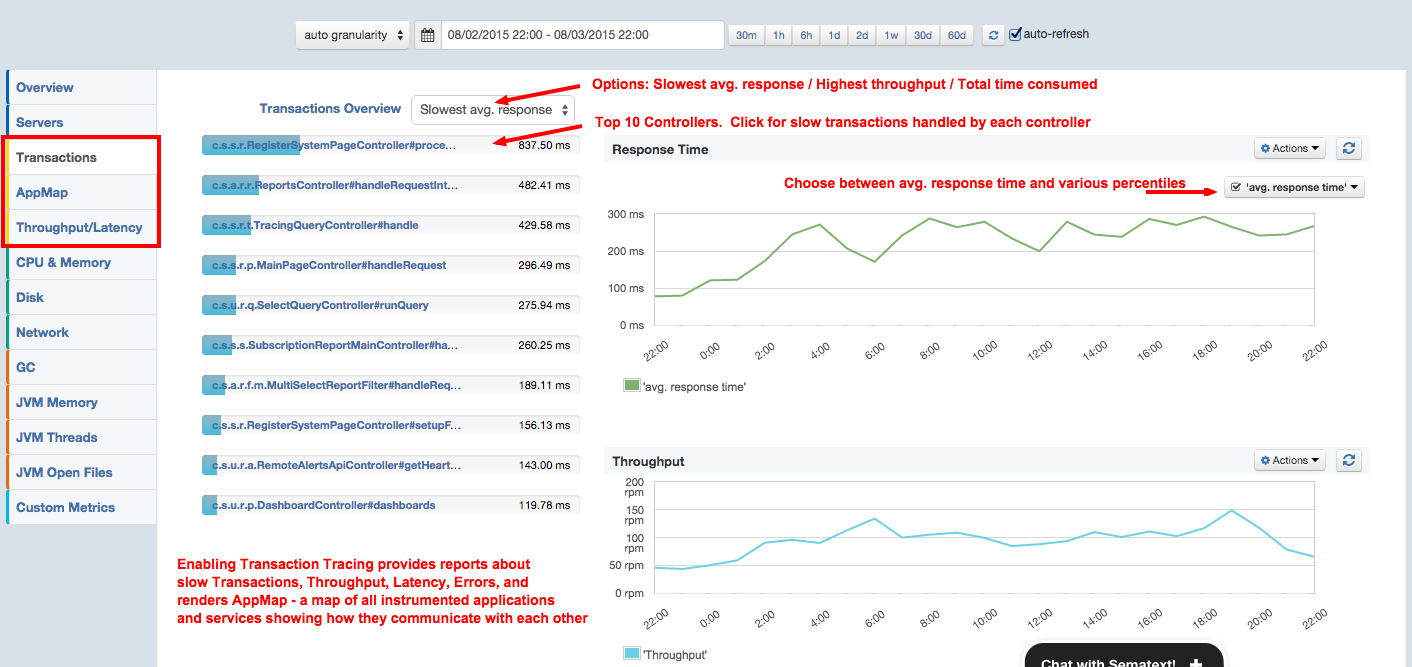
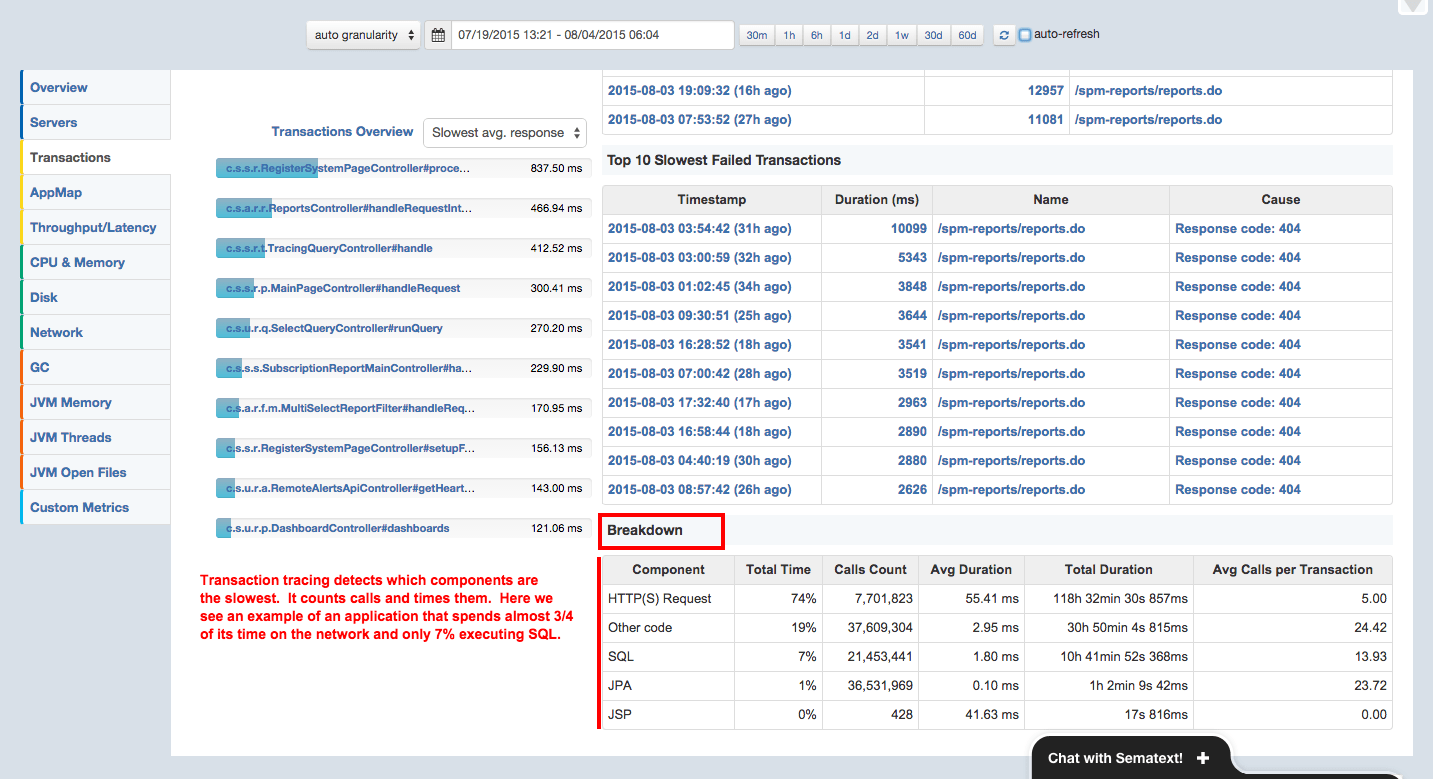
Under the new Transactions tab you will first see an overview like this:
On the left side we see the 10 slowest Controllers (actually methods inside them). You can also see Top 10 Controllers by throughput or time consumed.
On the right side you can see request latency and throughput.
Not shown in this screenshot are a few more charts that show counts and rates of errors, exceptions, and requests that resulted in a 4XX or 5XX response code.
Top 10 Slowest Transactions
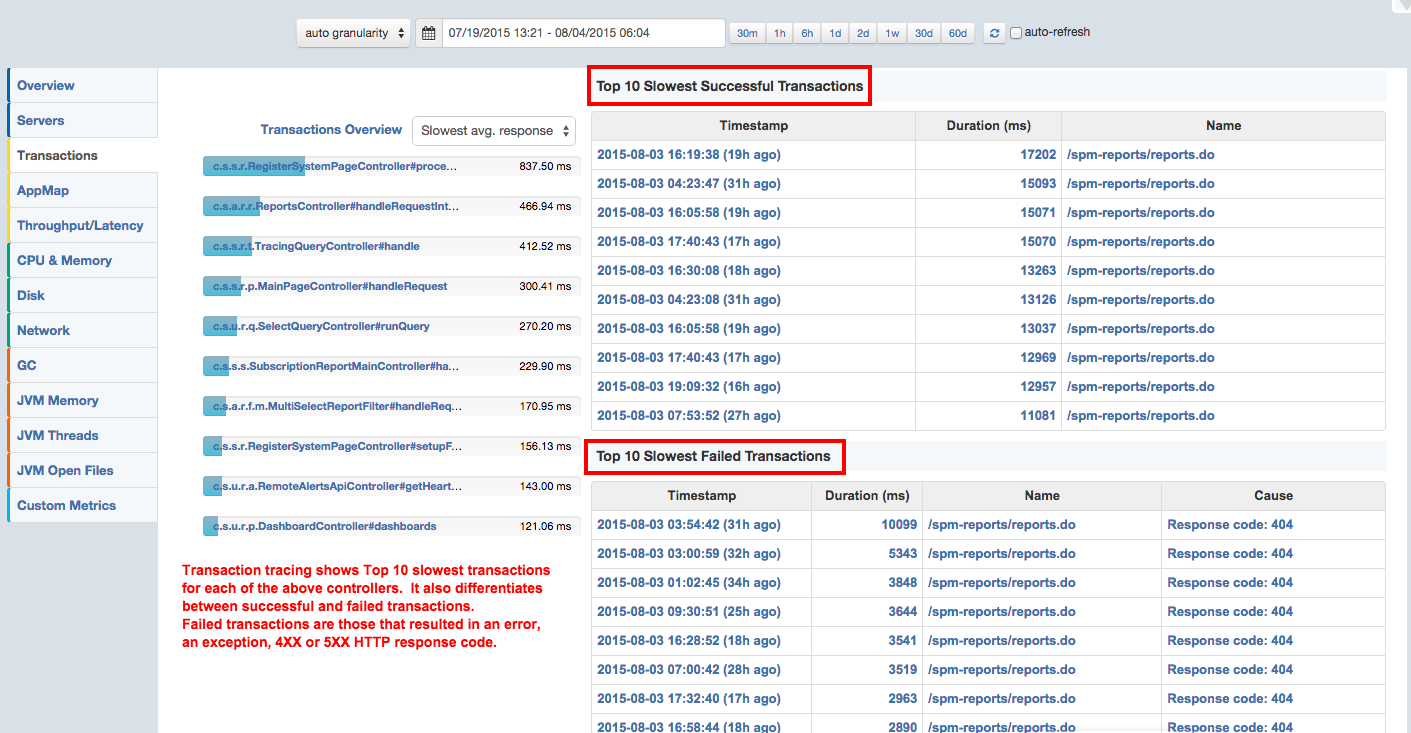
Clicking on one of the controllers shows the slowest transactions for that controller, as seen below:
Failed transactions are those that resulted in an error, exception, 4XX or 5XX error code.
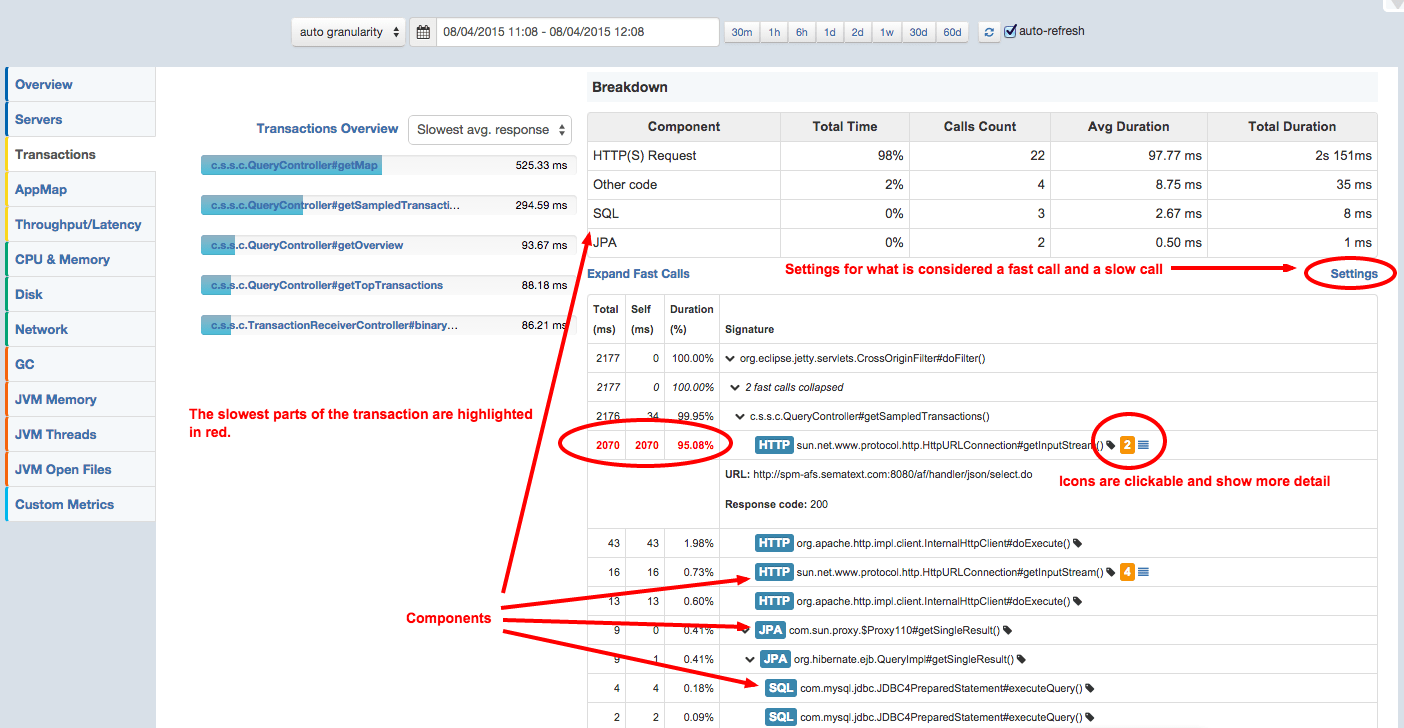
As you can tell from this screenshot, these transactions are clickable. Clicking on them shows details about a transaction, including all request parameters, response code, the exact URL, stop and start time, response code, etc. and, of course, the actual call trace itself, shown below:
Component Counting and Timing
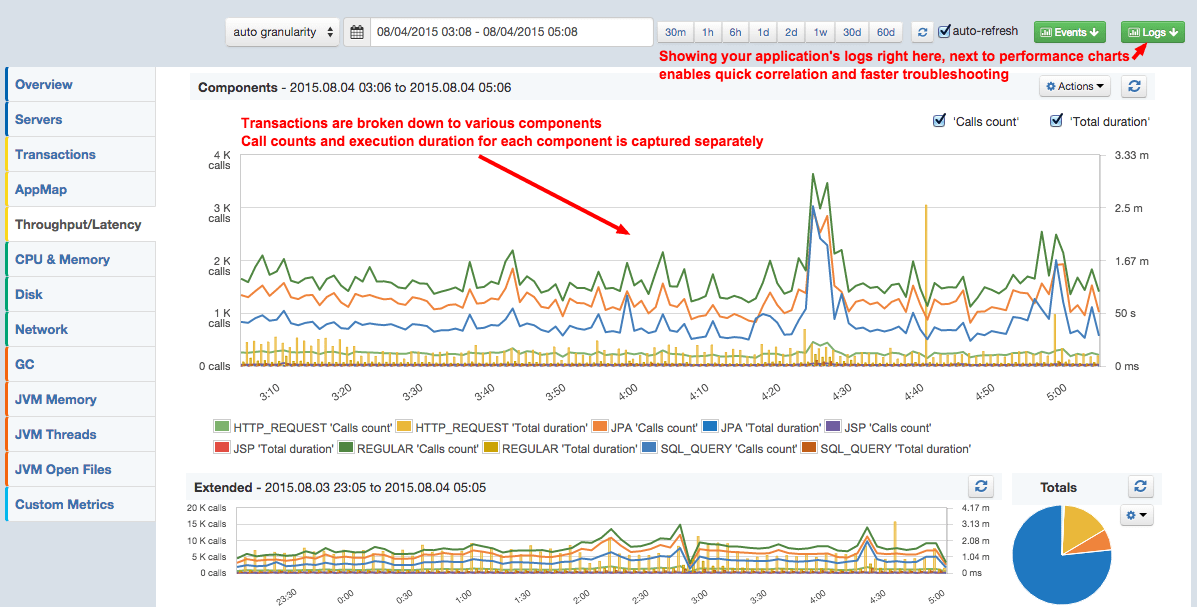
Transaction tracing distinguishes between various components, such as JSPs, SQL, JPA, HTTP, etc. It counts calls in those components and keeps track of how much time was spent in each of them. This means that if your database calls are slow, for example, this report will show that and you’ll know what you need to optimize.
The little green “Logs” button in top-right is not associated with transaction tracing, but it’s worth describing. If you ship your logs to Logsene, this button will pull in your log chart as well as the actual application logs into the SPM UI, thus allowing to troubleshoot performance issues much, much faster!
Transaction Component Breakdown
Similar to the the above Components chart, SPM shows component call count and execution duration breakdown in a tabular view.
Here are the key points about SPM’s transaction tracing:
- Transaction Tracing does not require you to modify any source code – the instrumentation is done automatically, at the JVM bytecode level
- Transaction Tracing is currently available for Java and Scala applications running inside the JVM
- We support deep insight into specific technologies listed in SPM Transaction Tracing documentation
- You’ll want to grab the latest version of the SPM client (it has some optimizations, too!)
- You’ll need to use the SPM monitor in the embedded (aka javaagent) mode, not standalone
- To add Transaction Tracing to your own custom apps you can easily create custom pointcuts
Not using SPM yet, but would like to trace your apps? Easy: register here — there is no commitment and you can leave your credit card in your wallet. You get 14 days Free for new SPM Apps so even if you don’t end up falling in love with SPM for monitoring, alerting and anomaly detection, or Logsene for your logs, you can use the Distributed Transaction Tracing to quickly speed up your apps! Oh, and if you are a young startup, a small or non-profit organization, or an educational institution, ask us for a discount (see special pricing)!
Here are the other posts in our Transaction Tracing series:
- Part 1: Transaction Tracing for Performance Bottleneck Detection
- Part 3: Introducing AppMap
- Part 4: Custom Pointcuts (coming soon!)
