Elasticsearch
Elasticsearch is a distributed, RESTful search and analytics engine designed for scalability and high-performance search functionalities across varied data types and sources. The Sematext Agent collects Elasticsearch metrics and logs, transmits them to Sematext Cloud; installing the agent takes less than 5 minutes.
Install Sematext Agent
- Create an Elasticsearch Logs or Monitoring App. This will let you install the agent and control access to your monitoring and logs data.
- Install the Sematext Agent according to the https://apps.sematext.com/ui/howto/Elasticsearch/overview displayed in the UI.
- After installing the agent, discovered logs or metrics from Elasticsearch services detected on the host will start shipping automatically.
- Make sure that HTTP metrics are enabled by setting
http.enabled: trueinelasticsearch.yaml. Also set thenode.namevalue in the same file. Elasticsearch will otherwise generate a random node name each time an instance starts, making tracking node stats over time impossible. Theelasticsearch.ymlfile can be found in/etc/elasticsearch/elasticsearch.ymlor$ES_HOME/config/elasticsearch.yml. - If you've created an Elasticsearch Monitoring App and want to collect Elasticsearch logs as well, or vice versa, click on the Create Logs App button from the left menu panel. This will take you to the Create Logs App (or Monitoring App) page. When you select Use Existing Agent, all discovered log sources from Elasticsearch services are listed, allowing you to set up log and metric shipping easily without any additional installation.
Having both Elasticsearch Logs and Monitoring Apps lets you correlate performance metrics and logs, and accelerate troubleshooting using Split Screen for faster resolution. For example, correlating metrics (such as CPU, memory usage, disk I/O) with logs (search queries, indexing operations), you can identify if a sudden spike in resource usage aligns with a specific type of query or indexing operation. This correlation helps in optimizing queries, indexing strategies, or scaling resources to maintain optimal performance. Or if you see logs of a node restarting, metrics let you see the impact on the rest of the cluster in terms of CPU, GC, and other metrics. Including query time metrics, even if you don't collect slowlogs from [all] queries.
To explore logs and services across multiple hosts, navigate to Fleet & Discovery > Discovery > Services (or Sematext Cloud Europe). From there, you can create additional Apps or stream data to existing ones without requiring any additional installations.
Important Metrics to Watch and Alert on
System and JVM Metrics
The first place we would recommend looking for in a new system are the OS metrics: CPU, memory, IO and network. A healthy CPU graph looks like this:
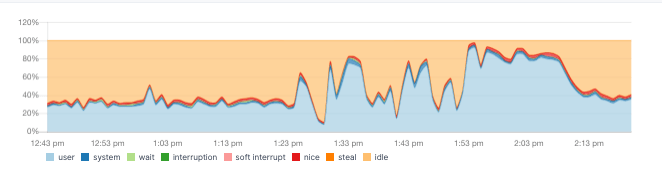
Note how the relative percentage of wait and system is negligible compared to user. Meaning we don't have a bottleneck in IO. And total usage isn't close to 100% all the time, so there's headroom.
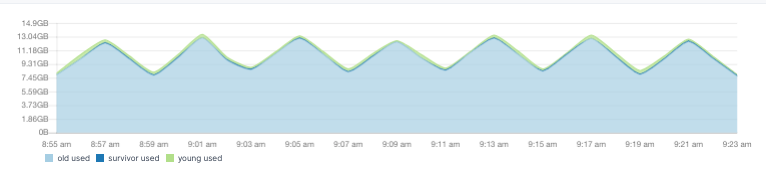
If there's high CPU usage, have a look at JVM garbage collection (GC) times. Which are probably good candidates for alerts. If GC times are high, then Elasticsearch is in trouble with JVM memory, rather than doing useful work with the CPU. You can look deeper into JVM memory usage to check. A healthy pattern looks like a shard tooth:
When it comes to system memory, don't be worried if you see very little free, like here:
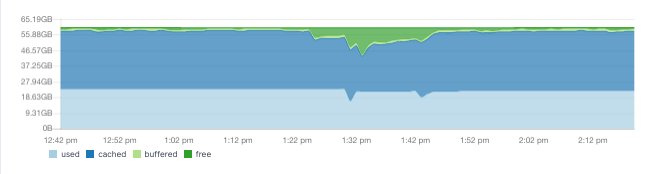
The operating system will try to cache your index files as much as it can. The cached memory can be freed up, if the system needs more memory.
Elasticsearch-specific metrics
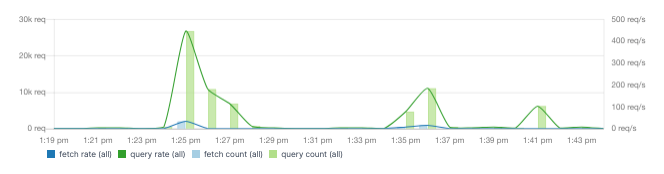
You'll want to monitor query rates and times. In other words, how fast is Elasticsearch responding? Since this will likely impact your users, these are metrics worth alerting on as well.
On the indexing side, check the indexing rate:
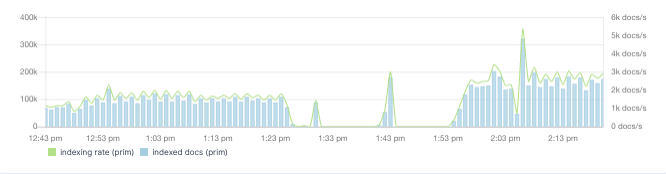
And correlate it with the asynchronous refresh and merge times, as they can correlate with your CPU spikes:
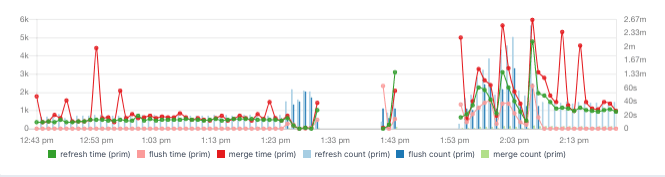
For example, if refresh time is too high, you might want to adjust the refresh interval.
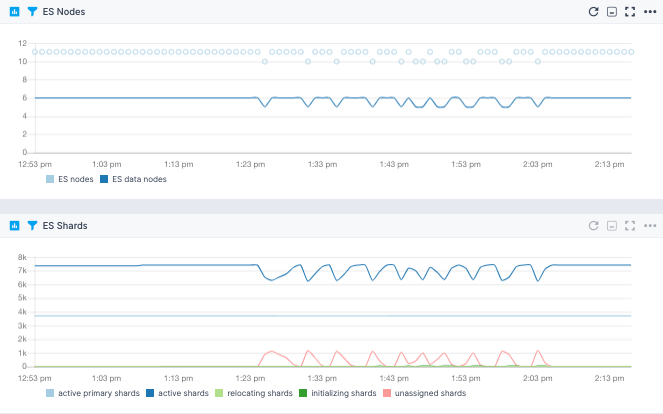
Last, but certainly not least, you may want to get an alert if a node leaves the cluster, so you can replace it. Once you do, you can keep an eye on shard stats, to see how many are initializing or relocating:
Elasticsearch Default Alerts
As soon as you create an Elasticsearch App, you will receive a set of default alert rules. These pre-configured rules will notify you of important events that may require your attention, as shown below.
Node count anomaly
This alert rule continuously monitors the count of nodes in an Elasticsearch cluster, checking for anomalies in the number of nodes present within the cluster. When anomalies are detected, it triggers a warning (WARN priority). The minimum delay between consecutive alerts triggered by this alert rule is set to 10 minutes.
Suppose an Elasticsearch cluster typically maintains a stable number of nodes, but due to various factors such as node failures, scaling activities, or network issues, the node count experiences sudden changes. When this happens, the alert rule checks for anomalies in the count of nodes over the last 90 minutes. Upon detecting the anomaly, the alert rule triggers a warning.
Actions to take
- Check the status of nodes within the Elasticsearch cluster for any nodes that may be offline, unavailable, or experiencing issues
- Check the logs of the node that went down and/or logs of the master node
- If node failures are detected, you may need to restart failed nodes or replace hardware
- If the node count changes due to scaling activities (e.g., adding or removing nodes), review the recent scaling events to confirm that they are intentional and expected
- Monitor network connectivity between nodes within the Elasticsearch cluster for any network issues that may be affecting communication and node discovery
Java old gen usage > 97%
This alert rule continuously monitors the usage of Java's old generation heap memory in an Elasticsearch environment, triggering a warning if the usage exceeds 97%. Note that this shouldn't happen in a healthy environment. It's likely that the node will either face an out of memory exception or run into the Parent Circuit Breaker. Either way, you'd have unexpected failures. The minimum delay between consecutive alerts triggered by this alert rule is set to 10 minutes.
Suppose the Java old generation heap memory usage in the Elasticsearch environment starts increasing and eventually exceeds 97% over a 5-minute period.
Actions to take
- Review and optimize the Java Virtual Machine (JVM) configuration, including heap size settings, garbage collection algorithms, and memory management parameters
- Investigate recent application changes, updates, or deployments that may have contributed to the spike in memory usage
Field data size
This alert rule continuously monitors the field data size in an Elasticsearch cluster and triggers a warning if the field data size exceeds a certain threshold (20 in this case). The minimum delay between consecutive alerts triggered by this alert rule is set to 10 minutes.
Significant field data usage points to a misconfiguration. Normally, you'd only use field data for global ordinals. If you're using >20%, you probably do sorting/aggregations on a text field with field data enabled. Which is dangerous (you may run out of heap on an expensive query). So you'd want to pre-process the data in the pipeline before Elasticsearch and do your sorting/aggregations on doc_values instead.
Actions to take
- Check _cat/fielddata, it will tell you which fields use more field data
- Consider scaling up the resources allocated to the Elasticsearch cluster, such as increasing the JVM heap size, to accommodate the increased field data size
Tripped parent circuit breaker
This alert rule continuously monitors the tripping of the parent circuit breaker in an Elasticsearch cluster, detecting instances where the circuit breaker has been triggered usually due to very high memory usage (for real memory, current default is 95% of JVM heap). When such instances are detected, it triggers a warning (WARN priority). The minimum delay between consecutive alerts triggered by this alert rule is set to 10 minutes.
Suppose an Elasticsearch cluster experiences a sudden increase in query load or indexing throughput, leading to very high memory usage and triggering the parent circuit breaker. When this happens, the alert rule checks for instances of the parent circuit breaker being tripped over the last 5 minutes. The alert is triggered as soon as the circuit breaker is tripped at least once within the specified timeframe.
Actions to take
- Analyze resource usage metrics for the Elasticsearch cluster, including CPU, memory, and disk utilization, to find the source of the increased load
- Review and optimize search queries or indexing operations that may be contributing to the increased load on the cluster. Consider optimizing query performance, reducing indexing throughput
- Consider scaling up the resources allocated to the Elasticsearch cluster, such as increasing the JVM heap size and number of nodes
Unassigned shards anomaly
This alert rule continuously monitors the presence of unassigned shards in an Elasticsearch cluster, detecting anomalies in the number of unassigned shards over time. When anomalies are detected, it triggers a warning (WARN priority). The minimum delay between consecutive alerts triggered by this alert rule is set to 10 minutes.
Suppose an Elasticsearch cluster typically maintains a low number of unassigned shards, but due to issues such as node failures or disk space constraints, the number of unassigned shards suddenly increases. When this happens, the alert rule checks for anomalies in the number of unassigned shards over the last 30 minutes. Upon detecting the anomaly, the alert rule triggers a warning.
Actions to take
- Check the status of Elasticsearch nodes to determine if any nodes are experiencing issues or are offline
- Review disk space on Elasticsearch nodes to see if there is sufficient space available for shard allocation
- Review shard allocation settings in the Elasticsearch cluster configuration to make sure that shards are allocated properly and evenly across nodes
- Recover unassigned shards and allocate them to available nodes in the cluster
Thread pool rejections anomaly
This alert rule continuously monitors thread pool rejections in an Elasticsearch environment, detecting anomalies in the rate at which thread pool requests are rejected. When anomalies are detected, it triggers a warning (WARN priority). The minimum delay between consecutive alerts triggered by this alert rule is set to 10 minutes.
Suppose an Elasticsearch cluster experiences a sudden increase in thread pool rejections, potentially due to resource limitations or high query loads. When this happens, the alert rule checks for anomalies in thread pool rejections over the last 90 minutes. Upon detecting the anomaly, the alert rule triggers a warning.
Actions to take
- Review system metrics for the Elasticsearch cluster, including CPU, memory, and disk usage, for any resource constraints that may be contributing to thread pool rejections
- Analyze query patterns for any inefficient or resource-intensive queries. Optimize queries to reduce the load on the cluster (only applies for the search thread pool)
- Check the calling applications and use fewer threads to talk to Elasticsearch
Used memory > 80%
This alert rule continuously monitors memory usage in an Elasticsearch environment and triggers a warning (WARN priority) when the used memory exceeds 80% of the total available memory. The minimum delay between consecutive alerts triggered by this alert rule is set to 10 minutes.
If the heap size is set too high in the Elasticsearch configuration, it might lead to excessive memory usage. In such cases, when the heap memory usage goes over 80% of the total available memory, the alert rule checks memory usage over the last hour. Upon crossing the threshold, the alert rule triggers a warning.
Actions to take
- Review and optimize the configuration settings of the Elasticsearch cluster, including heap size allocation
Swap usage
This alert rule continuously monitors swap usage in an Elasticsearch environment by tracking the rate of swap input/output operations. When any amount of swap usage is detected, it triggers a warning (WARN priority). This includes even the slightest swap activity, such as reading or writing a single byte to or from swap space.
The minimum delay between consecutive alerts triggered by this alert rule is set to 10 minutes.
Suppose there is some activity detected in the swap usage on a node in the Elasticsearch cluster. Despite the relatively small amount of swap activity, the alert rule triggers a warning to prevent any big (and potentially unacceptable) slowdowns in Elasticsearch caused by accessing swap memory.
Action to take
- Turn off swap usage
Open files > 85%
This alert rule continuously monitors the percentage of open files in an Elasticsearch cluster. When the percentage exceeds 85% within the specified timeframe, it triggers a warning (WARN priority). The minimum delay between consecutive alerts triggered by this alert rule is set to 10 minutes.
Suppose an Elasticsearch cluster typically operates with a healthy percentage of open files, but due to increased usage or resource limitations, the percentage of open files exceeds 85%. When this happens, the alert rule checks for instances where the percentage of open files exceeds 85% within the last 10 minutes and triggers a warning.
Actions to take
- Verify and adjust open file limits for Elasticsearch processes. The default open file limit for most systems is 65,536
- If the open file limit is approaching the recommended threshold, check unusual merge policies or a large number of very small shards
- A high percentage of open files usually signals a misconfiguration. Review Elasticsearch cluster configuration settings and consider optimizing resource allocation and file management settings to better handle file usage and prevent excessive file opening
Load average
This alert rule continuously monitors the load average of an Elasticsearch cluster and triggers a warning when the load average exceeds a specified threshold (currently when load average is more than 2). The minimum delay between consecutive alerts triggered by this alert rule is set to 10 minutes.
Suppose the average load on the Elasticsearch cluster typically remains below 2, but due to increased query loads or resource constraints, the load average spikes above 2. When this happens, the alert rule checks for load average values over the last 30 minutes. Upon detecting the load average anomaly, the alert rule triggers a warning.
Actions to take
- Review thread pools, indexing and search operations, heap usage, etc.
- Review and optimize queries or indexing processes that may be contributing to the increased load on the cluster
- If the increased load is due to resource limitations, consider scaling up resources such as CPU or memory
You can create additional alerts on any metric.
Metrics
| Metric Name Key (Type) (Unit) |
Description |
|---|---|
| parent max size es.circuitBreaker.parent.size.max (long gauge) (bytes) |
max parent circuit breaker size |
| parent estimated size es.circuitBreaker.parent.size.estimate (long gauge) (bytes) |
estimated parent circuit breaker size |
| parent overhead es.circuitBreaker.parent.size.overhead (double gauge) |
parent circuit breaker overhead |
| parent tripped es.circuitBreaker.parent.tripped (counter) |
parent circuit breaker tripped |
| inFlightRequests max size es.circuitBreaker.inFlightRequests.size.max (long gauge) (bytes) |
max in-flight requests size |
| inFlightRequests estimated size es.circuitBreaker.inFlightRequests.size.estimate (long gauge) (bytes) |
estimated in-flight requests size |
| inFlightRequests overhead es.circuitBreaker.inFlightRequests.size.overhead (double gauge) |
in-flight requests overhead |
| inFlightRequests tripped es.circuitBreaker.inFlightRequests.tripped (counter) |
in-flight requests circuit breaker tripped |
| fieldData max size es.circuitBreaker.fieldData.size.max (long gauge) (bytes) |
max fieldData size |
| fieldData estimated size es.circuitBreaker.fieldData.size.estimate (long gauge) (bytes) |
estimated fieldData size |
| fieldData overhead es.circuitBreaker.fieldData.size.overhead (double gauge) |
fieldData overhead |
| request maximum size es.circuitBreaker.request.size.max (long gauge) (bytes) |
max request size |
| fieldData tripped es.circuitBreaker.fieldData.tripped (counter) |
fieldData circuit breaker tripped |
| request estimated size es.circuitBreaker.request.size.estimate (long gauge) (bytes) |
estimated request size |
| request overhead es.circuitBreaker.request.size.overhead (double gauge) |
request overhead |
| request tripped es.circuitBreaker.request.tripped (counter) |
request circuit breaker tripped |
| ES nodes es.cluster.nodes (long gauge) |
Number of nodes in the ES cluster |
| ES data nodes es.cluster.nodes.data (long gauge) |
Number of data nodes in the ES cluster |
| number of processors es.cpu.allocated.count (long gauge) |
number of processors allocated to the Elasticsearch process |
| full cluster state updates es.cluster.state.published.full (long counter) |
full cluster state updates published |
| cluster state incompatible diff updates es.cluster.state.published.diff.incompatible (long counter) |
cluster state incompatible diff updates published |
| cluster state compatible diff updates es.cluster.state.published.diff.compatible (long counter) |
cluster state compatible diff updates published |
| active primary shards es.cluster.health.shards.active.primary (long gauge) |
Number of active primary shards |
| active shards es.cluster.health.shards.active (long gauge) |
Number of active shards |
| relocating shards es.cluster.health.shards.relocating (long gauge) |
Number of currently relocating shards |
| initializing shards es.cluster.health.shards.initializing (long gauge) |
Number of currently initializing shards |
| unassigned shards es.cluster.health.shards.unassigned (long gauge) |
Number of currently unassigned shards |
| outgoing searches es.adaptiveReplicaSelection.searches.outgoing (long gauge) |
searches from the monitored node to the remote node |
| average queue size es.adaptiveReplicaSelection.queue.size.avg (double gauge) |
exponentially weighted moving average queue size for searches on the remote node |
| average service time es.adaptiveReplicaSelection.service.time.avg (long gauge) (ms) |
exponentially weighted moving average task execution time on the remote node |
| average response time es.adaptiveReplicaSelection.response.time.avg (long gauge) (ms) |
exponentially weighted moving average response time on the remote node |
| rank es.adaptiveReplicaSelection.rank (double gauge) |
rank of the remote node used for replica selection |
| open HTTP conns es.connection.http.current.open (long gauge) |
open HTTP conns (current_open) |
| total opened HTTP conns es.connection.http.total.opened (long gauge) |
total opened HTTP conns (total_opened) |
| open TCP conns es.connection.tcp.server.open (long gauge) |
open TCP conns (server_open) |
| network received packets es.transport.rx.packets (long counter) |
network received packets count (rx_count) |
| network received size es.transport.rx.bytes (long counter) (bytes) |
network received size (rx_size) |
| network transmitted packets es.transport.tx.packets (long counter) |
network transmitted packets count (tx_count) |
| network transmitted size es.transport.tx.bytes (long counter) (bytes) |
network transmitted size (tx_size) |
| active conn openings es.connection.tcp.active.opens (long counter) |
active conn openings (active_opens) |
| passive conn openings es.connection.tcp.passive.opens (long counter) |
passive conn openings (passive_opens) |
| open sockets es.connection.tcp.current.estab (long gauge) |
open sockets (current_estab) |
| inbound segments (in_segs) es.connection.in.segs (long counter) |
inbound segments (in_segs) |
| outbound segments (out_segs) es.connection.out.segs (long counter) |
outbound segments (out_segs) |
| retransmitted segments (retrans_segs) es.connection.retrans.segs (long counter) |
retransmitted segments (retrans_segs) |
| socket resets (estab_resets) es.connection.tcp.estab.resets (long counter) |
socket resets (estab_resets) |
| failed socket open (attempt_fails) es.connection.tcp.attempt.fails (long counter) |
failed socket open (attempt_fails) |
| connection errors es.connection.in.errors (long counter) |
connection errors |
| socket resets sent (out_rsts) es.connection.tcp.out.rsts (long counter) |
socket resets sent (out_rsts) |
| docs count (prim) es.index.docs.primaries (long gauge) |
docs count on primary shards |
| docs deleted (prim) es.index.docs.deleted.primaries (long gauge) |
docs deleted on primary shards |
| docs count (all) es.index.docs.totals (long gauge) |
docs count on all (primary and replica) shards |
| docs deleted (all) es.index.docs.deleted.total (long gauge) |
docs deleted on all (primary and replica) shards |
| size on disk (prim) es.index.files.size.primaries (long gauge) (bytes) |
size on the disk of primary shards |
| size on disk (all) es.index.files.size.total (long gauge) (bytes) |
size on the disk of all (primary and replica) shards |
| indexed docs (prim) es.indexing.docs.added.primaries (long counter) |
docs indexed on primary shards |
| deleted docs (prim) es.indexing.docs.deleted.primaries (long counter) |
docs deleted on primary shards |
| indexing time (prim) es.indexing.time.added.primaries (long counter) (ms) |
time spent indexing on primary shards |
| deleting time (prim) es.indexing.time.deleted.primaries (long counter) (ms) |
time spent deleting on primary shards |
| indexed docs (all) es.indexing.docs.added.total (long counter) |
docs indexed on all (primary and replica) shards |
| deleted docs (all) es.indexing.docs.deleted.total (long counter) |
docs deleted on all (primary and replica) shards |
| indexing time (all) es.indexing.time.added.total (long counter) (ms) |
time spent indexing on all (primary and replica) shards |
| deleting time (all) es.indexing.time.deleted.total (long counter) (ms) |
time spent deleting on all (primary and replica) shards |
| recovery throttle time es.index.recovery.time.throttled (long counter) (ms) |
time during which recovery was throttled (due to indices.recovery.max_bytes_per_sec limit) |
| completion memory es.index.completion.size (long gauge) (bytes) |
memory used by the Completion Suggester |
| translog size es.index.translog.size (long gauge) (bytes) |
transaction log size |
| translog operations es.index.translog.operations (long gauge) |
number of operations in the transaction log |
| translog uncommitted size es.index.translog.uncommittedSize (long gauge) (bytes) |
transaction log uncommitted size |
| translog uncommitted operations es.index.translog.uncommittedOperations (long gauge) |
number of uncommitted operations in the transaction log |
| segments count es.segments.count.total (long gauge) |
number of segments |
| segments memory es.segments.memory.total (long gauge) (bytes) |
total memory for segment-related data structures |
| terms memory es.segments.memory.terms (long gauge) (bytes) |
memory used by the terms dictionary |
| stored fields memory es.segments.memory.storedFields (long gauge) (bytes) |
memory used by stored fields |
| term vectors memory es.segments.memory.termVectors (long gauge) (bytes) |
memory used by term vectors |
| norms memory es.segments.memory.norms (long gauge) (bytes) |
memory used by (length) norms |
| points memory es.segments.memory.points (long gauge) (bytes) |
memory used by point fields (includes numeric, date, geo) |
| doc values memory es.segments.memory.docValues (long gauge) (bytes) |
memory used by doc values |
| indexing buffer memory es.segments.memory.indexWriter (long gauge) (bytes) |
memory used by the IndexWriter |
| version map memory es.segments.memory.versionMap (long gauge) (bytes) |
memory used by the version map |
| fixed bitset memory es.segments.memory.fixedBitSet (long gauge) (bytes) |
memory used by the fixed bitset that speeds up nested queries/aggregations |
| read ops es.disk.io.operations.read (long counter) |
disk IO read operations |
| write ops es.disk.io.operations.write (long counter) |
disk IO write operations |
| script compilations es.script.compilations.total (long counter) |
script compilations (use params in scripts to reduce them) |
| script cache evictions es.script.cache.evictions (long counter) |
script cache evictions |
| script compilations limit triggered es.script.compilations.limitTriggered (long counter) |
script compilations circuit breaker triggered (see script.max_compilations_rate setting) |
| ingest calls es.ingest.calls.total (long counter) |
number of calls to this pipeline |
| ingest failures es.ingest.calls.errors (long counter) |
number of failed calls to this pipeline |
| ingest time es.ingest.time (long counter) (ms) |
time spent in this pipeline |
| gc collection count jvm.gc.collection.count (long counter) |
count of GC collections |
| gc collection time jvm.gc.collection.time (long counter) (ms) |
duration of GC collections |
| open files jvm.files.open (long gauge) |
jvm currently open files |
| max open files jvm.files.max (long gauge) |
jvm max open files limit |
| used jvm.pool.used (long gauge) (bytes) |
jvm pool used memory |
| used jvm.pool.max (long gauge) (bytes) |
jvm pool max memory |
| thread count jvm.threads (long gauge) |
current jvm thread count |
| peak thread count jvm.threads.peak (long gauge) |
peak jvm thread count |
| merge count (prim) es.indexing.merges.primaries (long counter) |
merge count on primary shards |
| merge time (prim) es.indexing.merges.time.primaries (long counter) (ms) |
merge time on primary shards |
| merged docs count (prim) es.indexing.merges.docs.primaries (long counter) |
merged docs count on primary shards |
| merged docs size (prim) es.indexing.merges.docs.size.primaries (long counter) (bytes) |
merged docs size on primary shards |
| throttled merge time (prim) es.indexing.merges.throttled.time.primaries (long counter) (ms) |
throttled time for merges (i.e. when merges fall behind) on primary shards |
| merge count (all) es.indexing.merges.total (long counter) |
merge count on all (primary and replica) shards |
| merge time (all) es.indexing.merges.time.total (long counter) (ms) |
merge time on all (primary and replica) shards |
| merged docs count (all) es.indexing.merges.docs.total (long counter) |
merged docs count on all (primary and replica) shards |
| merged docs size (all) es.indexing.merges.docs.size.total (long counter) (bytes) |
merged docs size on all (primary and replica) shards |
| throttled merge time (all) es.indexing.merges.throttled.time.total (long counter) (ms) |
throttled time for merges (i.e. when merges fall behind) on all (primary and replica) shards |
| field cache evictions es.cache.field.evicted (long counter) |
Field cache evictions |
| field cache size es.cache.field.size (long gauge) (bytes) |
Field cache size |
| filter cache evictions es.cache.filter.evicted (long counter) |
Filter cache evictions |
| filter cache size es.cache.filter.size (long gauge) (bytes) |
Filter cache size |
| filter/query cache count cache.filter.size.count (long counter) |
Filter/query cache count of elements |
| filter/query cache hit count es.cache.filter.hits (long counter) |
Number of requests hitting the filter/query cache |
| filter/query cache miss count es.cache.filter.misses (long counter) |
Number of requests missing the filter/query cache |
| request cache evictions es.cache.request.evicted (long counter) |
Request cache evictions |
| request cache size es.cache.request.size (long gauge) (bytes) |
Request cache size |
| request cache hit count es.cache.request.hits (long counter) |
Number of requests hitting the request cache |
| request cache miss count es.cache.request.misses (long counter) |
Number of requests missing the request cache |
| warmer current es.cache.warmer.current (long gauge) |
Warmer current |
| warmer total es.cache.warmer.total (long counter) (bytes) |
Warmer total |
| warmer total time es.cache.warmer.time (long counter) (ms) |
Warmer total time |
| filter/query cache count es.cache.filter.size.count (long counter) |
Filter/query cache count of elements |
| refresh count (prim) es.indexing.refreshes.primaries (long counter) |
refresh count on primary shards |
| refresh time (prim) es.indexing.refreshes.time.primaries (long counter) (ms) |
refresh time on primary shards |
| refresh count (all) es.indexing.refreshes.total (long counter) |
refresh count on all (primary and replica) shards |
| refresh time (all) es.indexing.refreshes.time.total (long counter) (ms) |
refresh time on all (primary and replica) shards |
| flush count (prim) es.indexing.flushes.primaries (long counter) |
flush count on primary shards |
| flush time (prim) es.indexing.flushes.time.primaries (long counter) (ms) |
flush time on primary shards |
| flush count (all) es.indexing.flushes.total (long counter) |
flush count on all (primary and replica) shards |
| flush time (all) es.indexing.flushes.time.total (long counter) (ms) |
flush time on all (primary and replica) shards |
| query count (prim) es.query.count.primaries (long counter) |
query count on primary shards |
| query latency (prim) es.query.latency.time.primaries (long counter) (ms) |
query latency on primary shards |
| fetch count (prim) es.fetch.count.primaries (long counter) |
fetch count on primary shards |
| fetch latency (prim) es.fetch.latency.time.primaries (long counter) (ms) |
fetch latency on primary shards |
| avg. query latency (primaries) es.query.latency.primaries.avg (long gauge) (ms) |
avg. query latency on primary shards |
| suggest count (prim) es.suggest.count.primaries (long counter) |
suggest count on primary shards |
| suggest latency (prim) es.suggest.latency.time.primaries (long counter) (ms) |
suggest latency on primary shards |
| scroll count (prim) es.scroll.count.primaries (long counter) |
scroll count on primary shards |
| scroll latency (prim) es.scroll.latency.time.primaries (long counter) (ms) |
scroll latency on primary shards |
| search open contexts (prim) es.opencontexts.primaries (long gauge) |
open search contexts on primary shards |
| query count (all) es.query.count.total (long counter) |
query count on all (primary and replica) shards |
| query latency (all) es.query.latency.time.total (long counter) (ms) |
query latency on all (primary and replica) shards |
| fetch count (all) es.fetch.count.total (long counter) |
fetch count on all (primary and replica) shards |
| fetch latency (all) es.fetch.latency.time.total (long counter) (ms) |
fetch latency on all (primary and replica) shards |
| avg. query latency (all) es.query.latency.total.avg (long gauge) (ms) |
avg. query latency on all (primary and replica) shards |
| suggest count (all) es.suggest.count.total (long counter) |
suggest count on all (primary and replica) shards |
| suggest latency (all) es.suggest.latency.time.total (long counter) (ms) |
suggest latency on all (primary and replica) shards |
| scroll count (all) es.scroll.count.total (long counter) |
scroll count on all (primary and replica) shards |
| scroll latency (all) es.scroll.latency.time.total (long counter) (ms) |
scroll latency on all (primary and replica) shards |
| search open contexts (all) es.opencontexts.total (long gauge) |
open search contexts on all (primary and replica) shards |
| real-time get count (prim) es.request.rtg.primaries (long counter) |
real-time get count on primary shards |
| real-time get latency (prim) es.request.rtg.time.primaries (long counter) (ms) |
real-time latency on primary shards |
| real-time get exists count (prim) es.request.rtg.exists.primaries (long counter) |
real-time get exists count on primary shards |
| real-time get exists latency (prim) es.request.rtg.exists.time.primaries (long counter) (ms) |
real-time get exists latency on primary shards |
| real-time get missing count (prim) es.request.rtg.missing.primaries (long counter) |
real-time get missing count on primary shards |
| real-time get missing latency (prim) es.request.rtg.missing.time.primaries (long counter) (ms) |
real-time get missing latency on primary shards |
| real-time get count (all) es.request.rtg.total (long counter) |
real-time get count on all (primary and replica) shards |
| real-time get latency (all) es.request.rtg.time.total (long counter) (ms) |
real-time latency on all (primary and replica) shards |
| real-time get exists count (all) es.request.rtg.exists.total (long counter) |
real-time get exists count on all (primary and replica) shards |
| real-time get exists latency (all) es.request.rtg.exists.time.total (long counter) (ms) |
real-time get exists latency on all (primary and replica) shards |
| real-time get missing count (all) es.request.rtg.missing.total (long counter) |
real-time get missing count on all (primary and replica) shards |
| real-time get missing latency (all) es.request.rtg.missing.time.total (long counter) (ms) |
real-time get missing latency on all (primary and replica) shards |
| active shards es.cluster.shards.active (long gauge) |
Number of active shards |
| active primary shards es.cluster.shards.active.primary (long gauge) |
Number of active primary shards |
| initializing shards es.cluster.shards.initializing (long gauge) |
Number of initializing shards |
| relocating shards es.cluster.shards.relocating (long gauge) |
Number of relocating shards |
| unassigned shards es.cluster.shards.unassigned (long gauge) |
Number of unassigned shards |
| active threads es.thread.pool.active (long gauge) |
active threads |
| thread pool size es.thread.pool.size (long gauge) |
thread pool size |
| thread pool queue es.thread.pool.queue (long gauge) |
thread pool queue |
| thread pool queue size es.thread.pool.queue.size (long gauge) |
thread pool queue size |
| rejected threads es.thread.pool.rejected (long counter) |
rejected threads |
| thread pool largest es.thread.pool.largest (long gauge) |
thread pool largest |
| completed threads es.thread.pool.completed (long counter) |
complete threads |
| thread pool min es.thread.pool.min (long gauge) |
thread pool min |
| thread pool max es.thread.pool.max (long gauge) |
thread pool max |
Logs
Once data is in, you can explore it via the built-in reports:
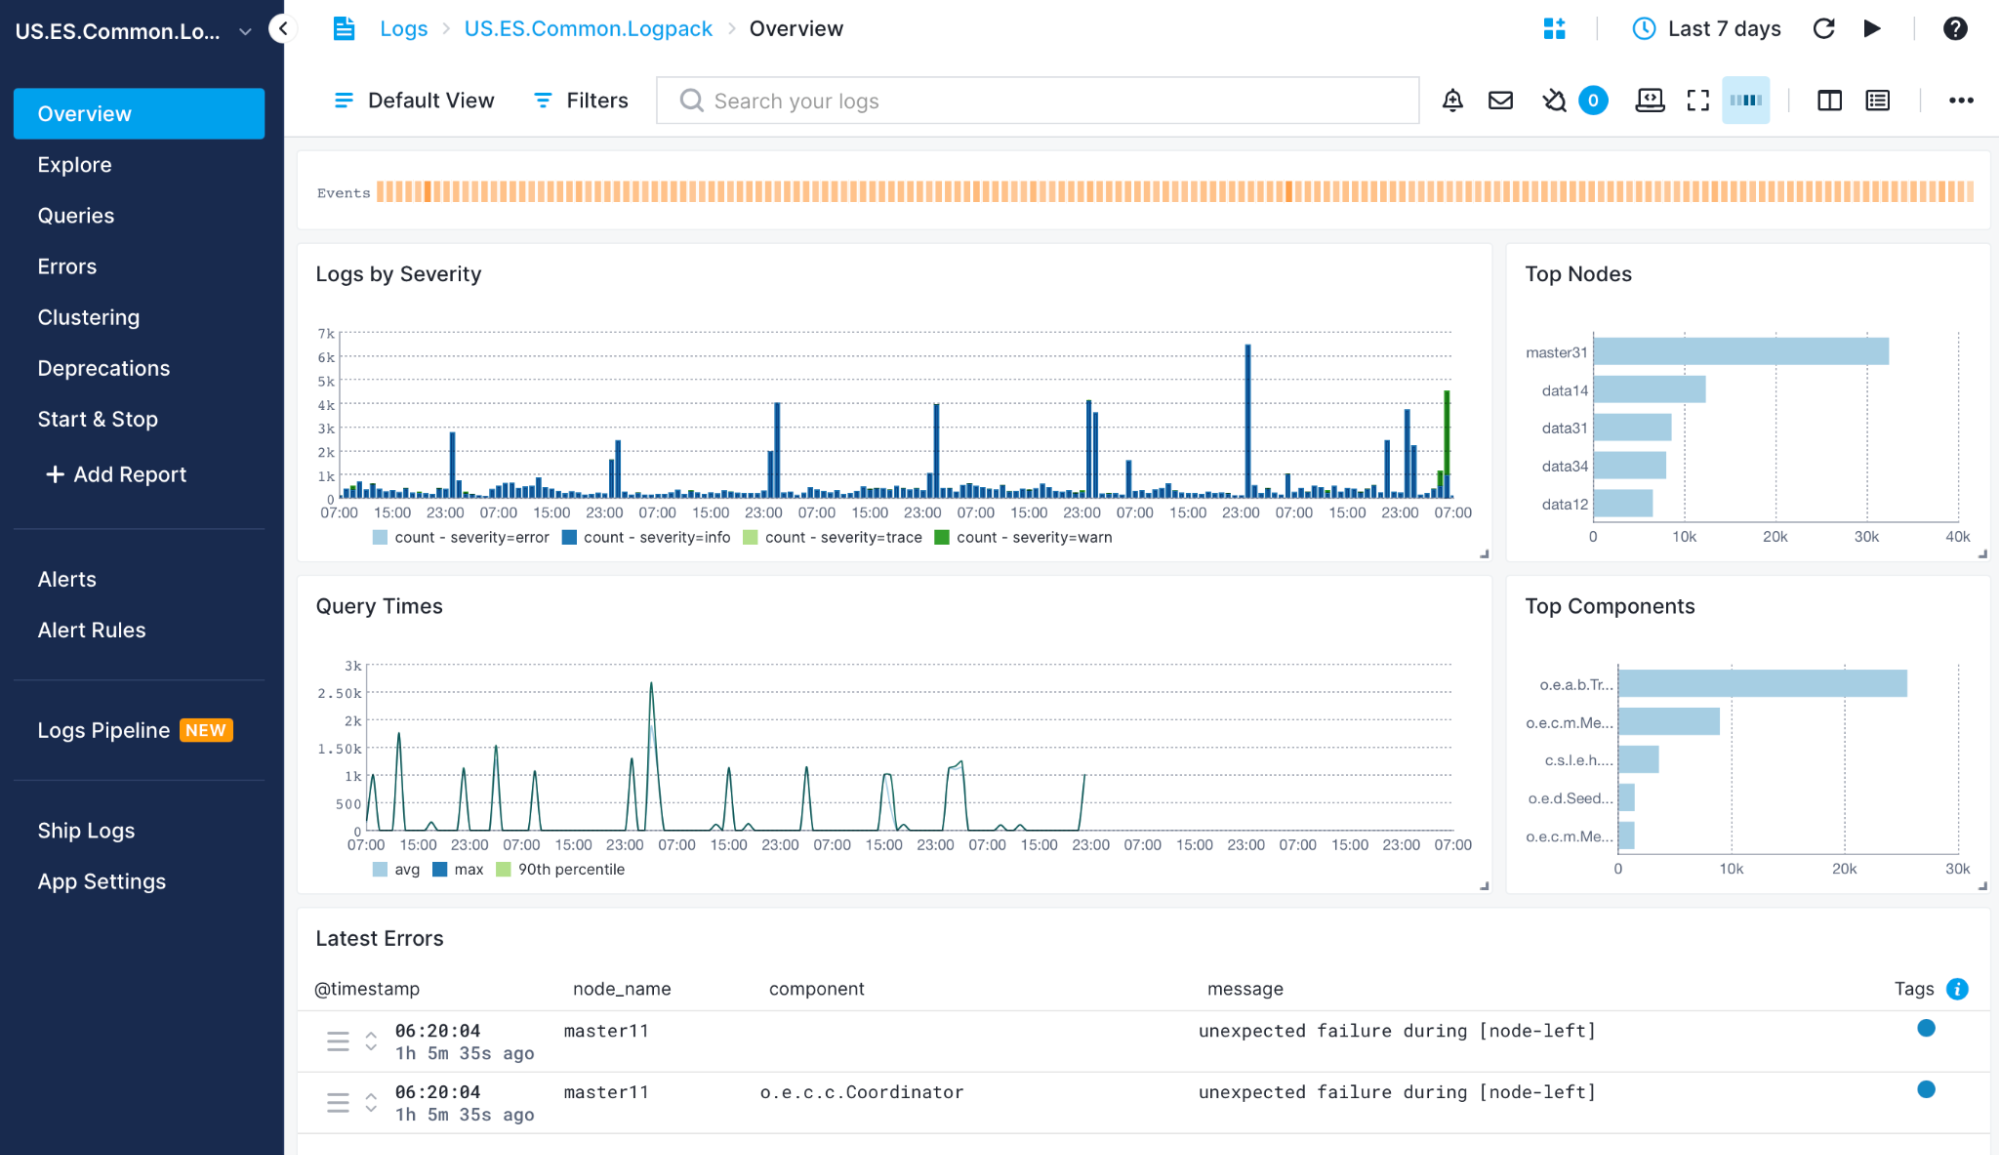
Exploring logs
Once data is in, you can explore it using the built-in reports or create your own. For example, you can use the Queries report to see a breakdown of your queries and "zoom in" to the ones you're interested in:
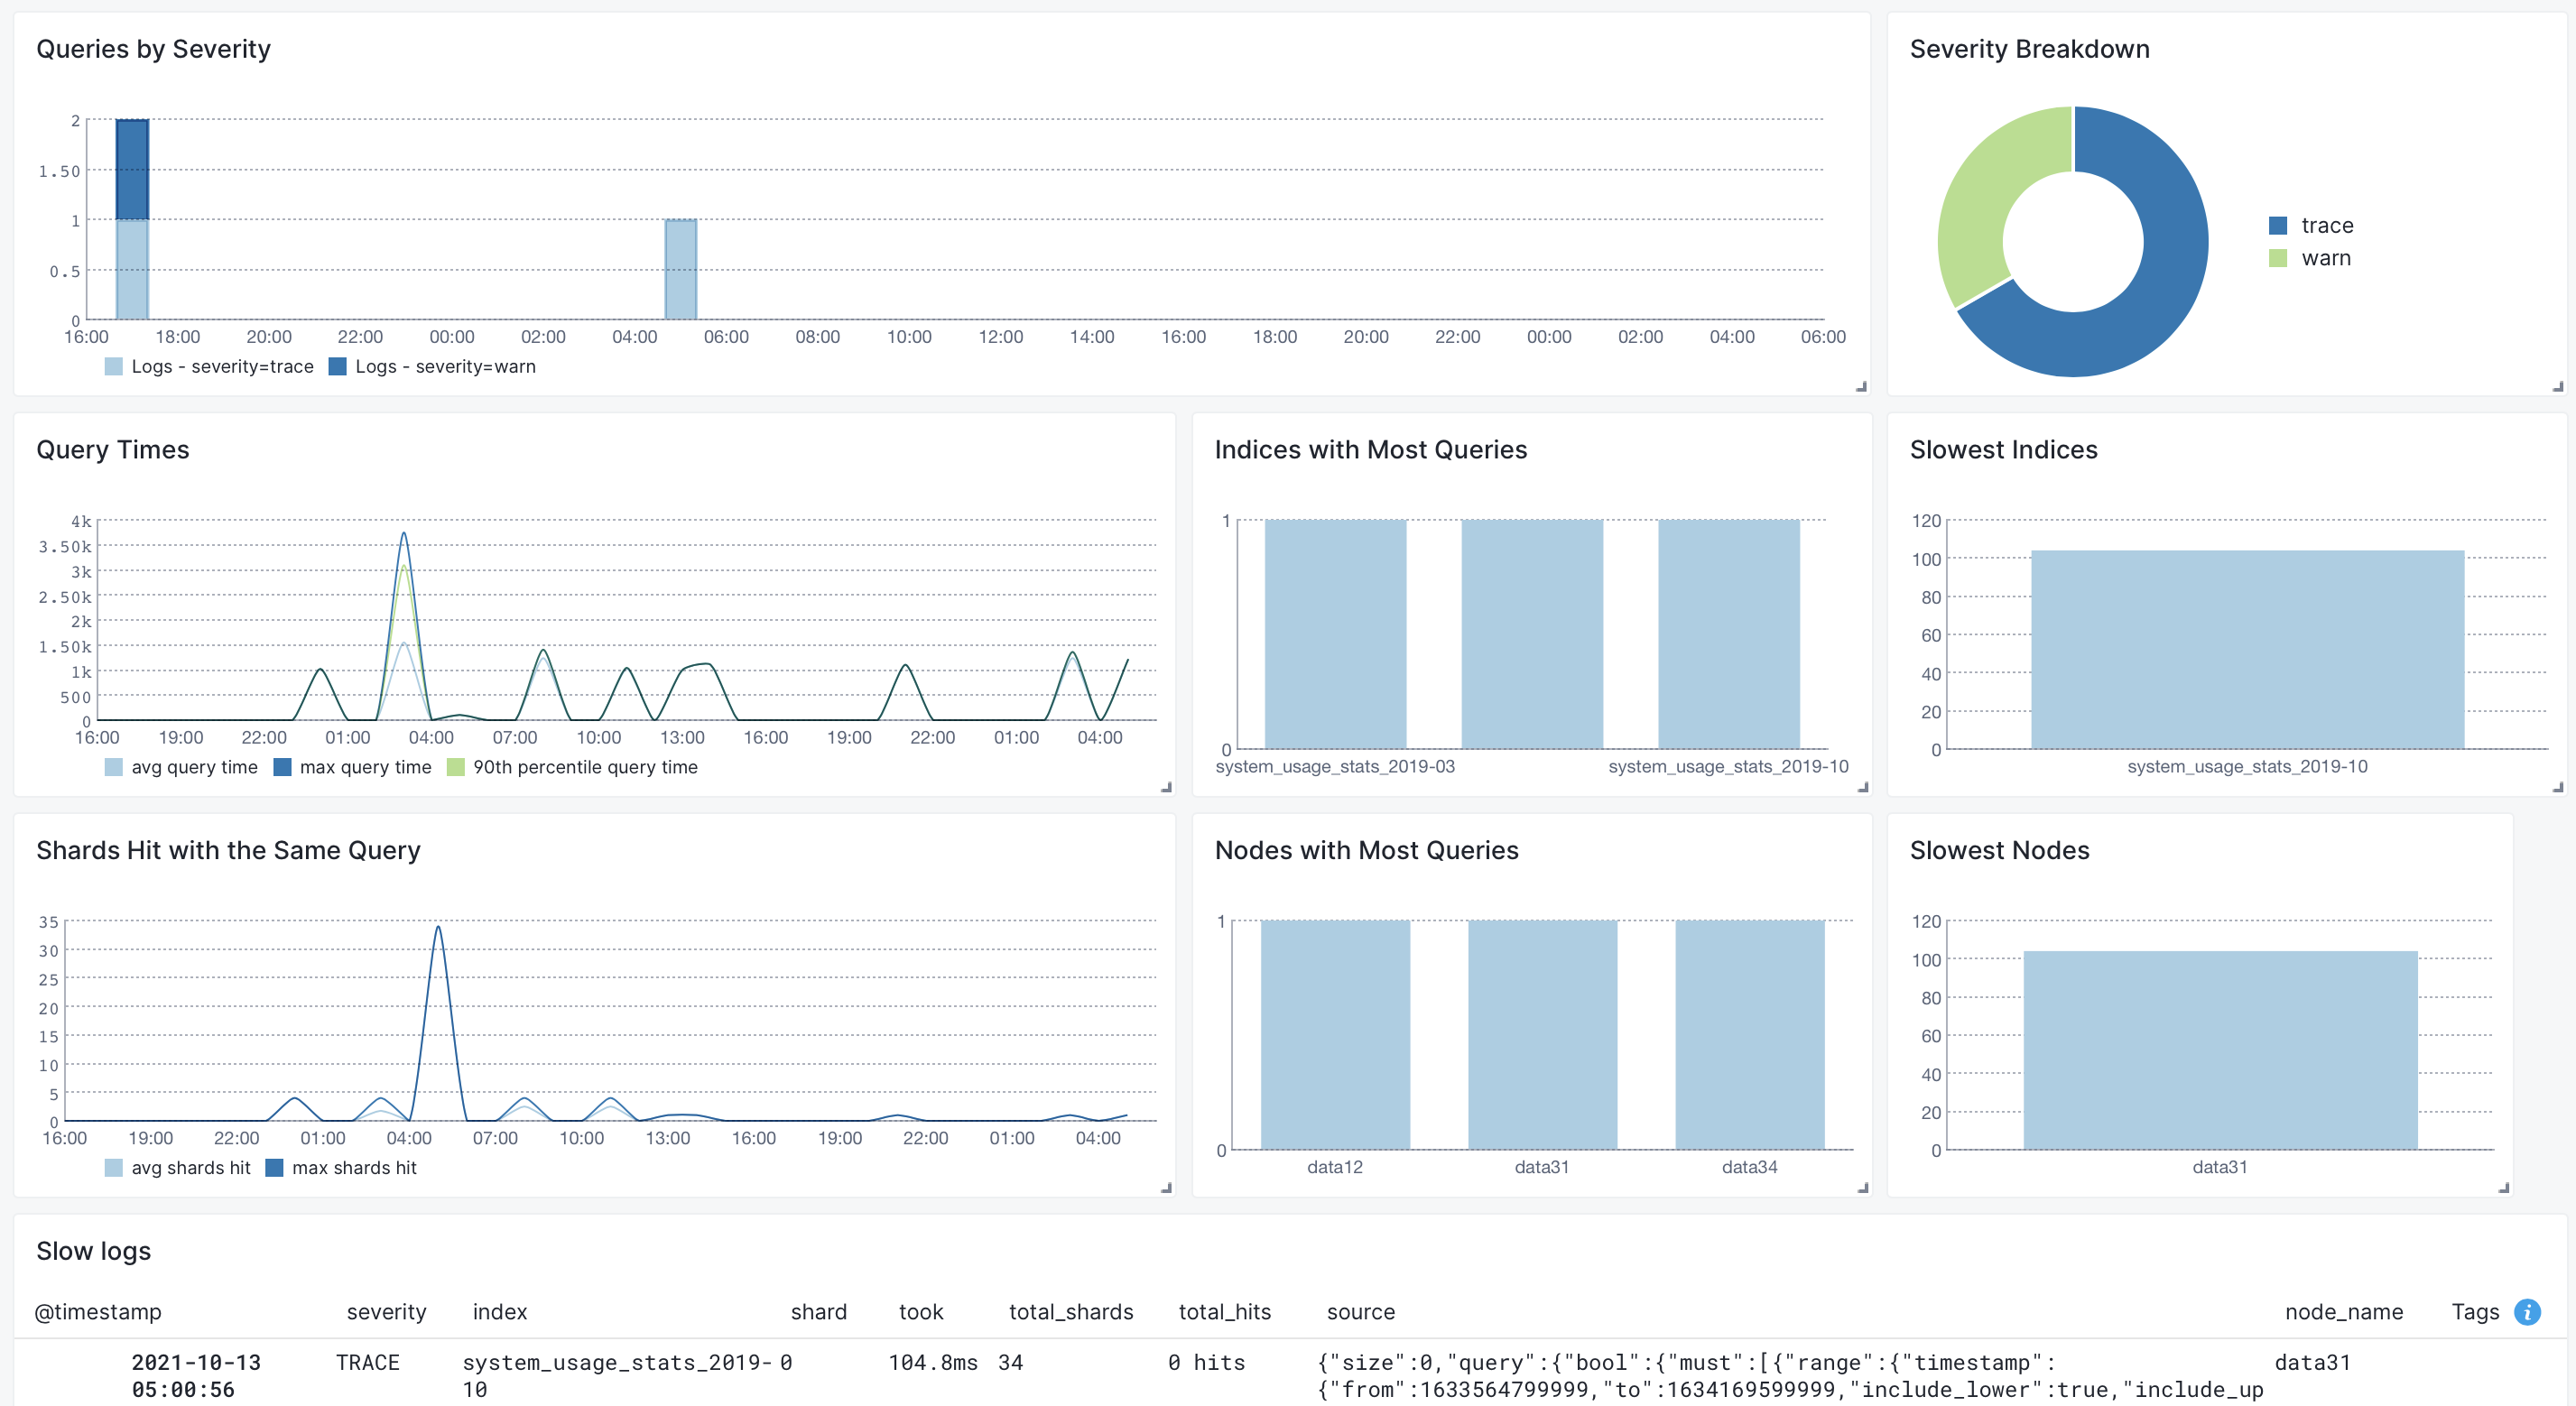
Other built-in reports include:
- Errors: breakdown of what's wrong: which nodes or components generate errors
- Clustering: logs produced by components that have to do with cluster coordination: master logs, logs related to a node joining/leaving a cluster and shard allocation
- Deprecation: breakdown of deprecation logs by node and coomponent
- Start & Stop: startup-related and shutdown-related logs. Look here if a node went down unexpectedly or doesn't show up in the cluster when started
Alert Setup
There are 3 types of alerts in Sematext:
- Heartbeat alerts, which notify you when a Elasticsearch DB server is down
- Classic threshold-based alerts that notify you when a metric value crosses a predefined threshold
- Alerts based on statistical anomaly detection that notify you when metric values suddenly change and deviate from the baseline
Let’s see how to actually create some alert rules for Elasticsearch metrics in the animation below. The request query count chart shows a spike. We normally have up to 100 requests, but we see it can jump to over 600 requests. To create an alert rule on a metric we’d go to the pulldown in the top right corner of a chart and choose “Create alert”. The alert rule applies the filters from the current view and you can choose various notification options such as email or configured notification hooks (PagerDuty, Slack, VictorOps, BigPanda, OpsGenie, Pusher, generic webhooks etc.)
More about Elasticsearch Monitoring
- Elasticsearch Monitoring Guide
- Top 10 Elasticsearch Metrics To Monitor
- Elasticsearch Open Source Monitoring Tools
- Monitoring Elasticsearch With Sematext
Troubleshooting
If you have trouble sending logs, try out the latest version of Sematext Agent. Also, make sure Sematext Agent is configured to send logs to your Elasticsearch Logs App. Last, check the Log Agents panel for any errors, and refer to our Sematext Logs FAQ for useful tips.
FAQ
Why doesn't the number of documents I see in Sematext match the number of documents in my Elasticsearch index
Sematext collects index stats from primary shards only. To see the total number of documents in an index, select all shards in that index and choose "sum". The list of shards and the "sum" function can be found in the "Shard filter" in the Index Stats report.
Can Sematext Agent collect metrics even when Elasticsearch HTTP API is disabled
Each Sematext Agent collects Elasticsearch metrics only from the local node by accessing the Stats API via HTTP. To allow only local access add the following to elasticsearch.yml. Don't forget to restart each ES node to whose elasticsearch.yml you add this.
Can I point Sematext Agent to a non-localhost Elasticsearch node
Yes. Adjust /opt/spm/spm-monitor/conf/spm-monitor-config-TOKEN_HERE-default.properties and change the SPM_MONITOR_ES_NODE_HOSTPORT property from the default localhost:9200 value to use an alternative hostname:port. After that restart Sematext Agent (if you are running a standalone App Agent version) or Elasticsearch process(es) with embedded App Agent.
My Elasticsearch is protected by basic HTTP authentication, can I use Sematext Agent
Yes. You just need to adjust /opt/spm/spm-monitor/conf/spm-monitor-config-TOKEN_HERE-default.properties file by adding the following two properties (replace values with your real username and password):
ST_MONITOR_ES_NODE_BASICAUTH_USERNAME=yourUsername
ST_MONITOR_ES_NODE_BASICAUTH_PASSWORD=yourPassword
Restart your Sematext Agent after this change (either with sudo service spm-monitor restart in case of standalone App Agent or by restarting Elasticsearch node if you are using in-process App Agent).
I am using Sematext Agent and I don't see Index (and/or Refresh/Flush/Merge) stats, why is that
Sematext Agent collects Index stats only from primary shards, so it is possible that you installed Sematext Agent on some Elasticsearch node which hosts only replicas. The same is also true for Refresh/Flush and Merge stats. Also note that Sematext Agent should be installed on all your Elasticsearch nodes to get the complete picture of your cluster in Sematext Reports UI.