Processes
Process Monitoring gives you visibility into processes that use the most CPU or memory, regardless of whether they are running inside containers, in the cloud, your own VMs or bare-metal servers.
Process Monitoring is available in the Infrastructure Monitoring section of your Sematext Cloud account - your central place for hosts, virtual machines, containers, and process information.
Enabling Process Monitoring
Process Monitoring is enabled by default in Sematext Agent. Check out enabling and disabling Process Monitoring here.
Make sure to select the appropriate plan to access the Processes Reports.
Processes View
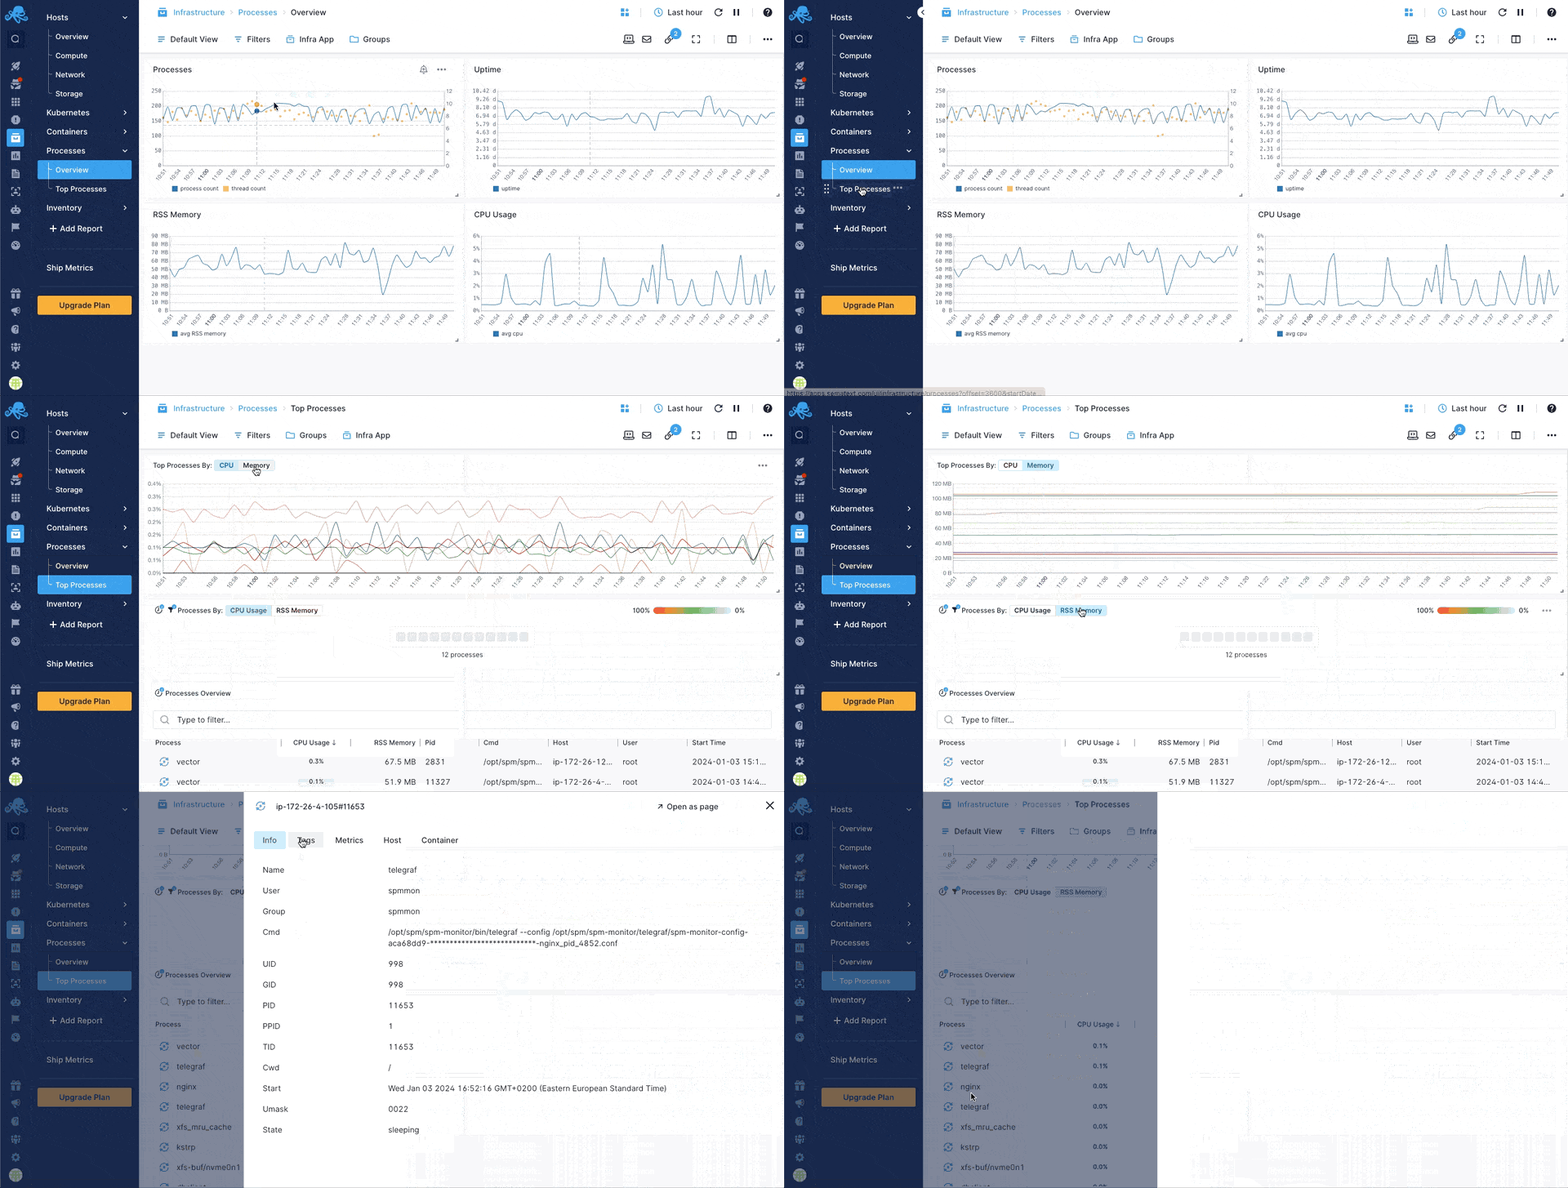
The processes view provides similar information as the Linux top command. It shows:
- Top N processes in your entire infrastructure
- Grouping metrics by hosts, process names, containers, etc.
- Filtering by tags

The real-time view of the top N processes contains a time-series chart, a tile map, and a list with the process details that help you identify processes with the highest resource usage.
Clicking on each row in the process list shows detailed information about the process:
- PID
- User
- Group
- Process name
- Command
- Start time
- Umask
- Gid
- Tid
- Tags like container id, container name etc.
Also, a real-time view of all process metrics is available in the metrics tab. This includes:
- CPU usage
- RSS memory
- IO read/write bytes
- IO read/write operations
How Does It Work?
The Sematext Agent tracks all processes and ships the metrics of the top N processes. The agent tags all metrics with process and container metadata and ships the metrics to your Infra App.
Sematext Cloud provides visualizations, grouping and filter functionality.
Gathered Data
The Sematext Agent gathers the following data about the process:
- CPU usage
- RSS memory
- IO read/write bytes
- IO read/write operations
- Process metadata
- Container metadata
Solving Problems With Process Monitoring
Here are some of the common use cases and issues that Process Monitoring helps to solve:
- Real-time process monitoring
- Extended visibility for at least 30 minutes
- Save time to identify processes with the highest resource in your entire infrastructure
- Replace time-consuming operations to check system resources with
sshandtopLinux commands - Identify processes, containers or service with high resource usage
More Details
To read about the inner workings of Process Monitoring check out the Processes section in the Sematext Agent docs!