The key to gaining serverless observability is sending all AWS Lambda Logs to a central location where you can later group, filter and make sense of them. Sematext is a full-stack observability solution for your entire software stack. Meaning you can implement centralized logging for AWS Lambda Logs alongside any existing infrastructure, like Kubernetes clusters and containers.
Here’s a scenario. Your APIs are failing and you have absolutely no clue why. Don’t you just hate that!? Now imagine you don’t have access to the VM, cluster or container where your software is running. Want me to continue with this nightmare?
Yes, that’s what debugging AWS Lambda functions tends to seem like. A horrid nightmare of not knowing what is happening nor why things are failing. This article will show you a way of logging function invocations, and storing your AWS Lambda Logs in a central location. Letting you track and monitor failures and errors, while also giving you a nice structure for logging info and debug logs for when you need to troubleshoot behavior.
Ready? Let’s get started!
Using CloudWatch for AWS Lambda Logs
CloudWatch is the default solution for showing AWS Lambda Logs.
CloudWatch collects monitoring and operational data in the form of logs, metrics, and events, providing you with a unified view of AWS resources, applications and services that run on AWS, and on-premises servers.
— AWS Documentation
In layman’s terms, it’s an AWS service for showing your logs across all AWS services. We’re interested in knowing how it handles AWS Lambda Logs. When an AWS Lambda function executes, whatever you write out to the console, a fmt.printf() in Go or console.log() in Node.js, will be sent to CloudWatch asynchronously in the background. You can find these AWS Lambda Logs in the AWS CloudWatch console. Lucky for us, it won’t add any overhead to the AWS Lambda function execution time.
Using logging agents in the AWS Lambda function runtime will add overhead to the execution and add unnecessary latency. We want to avoid that, and process the logs after they get added to CloudWatch. Below you can see sample log events that get generated from a generic Hello World function. Accessing AWS CloudWatch logs is as easy as scrolling through the AWS Console.
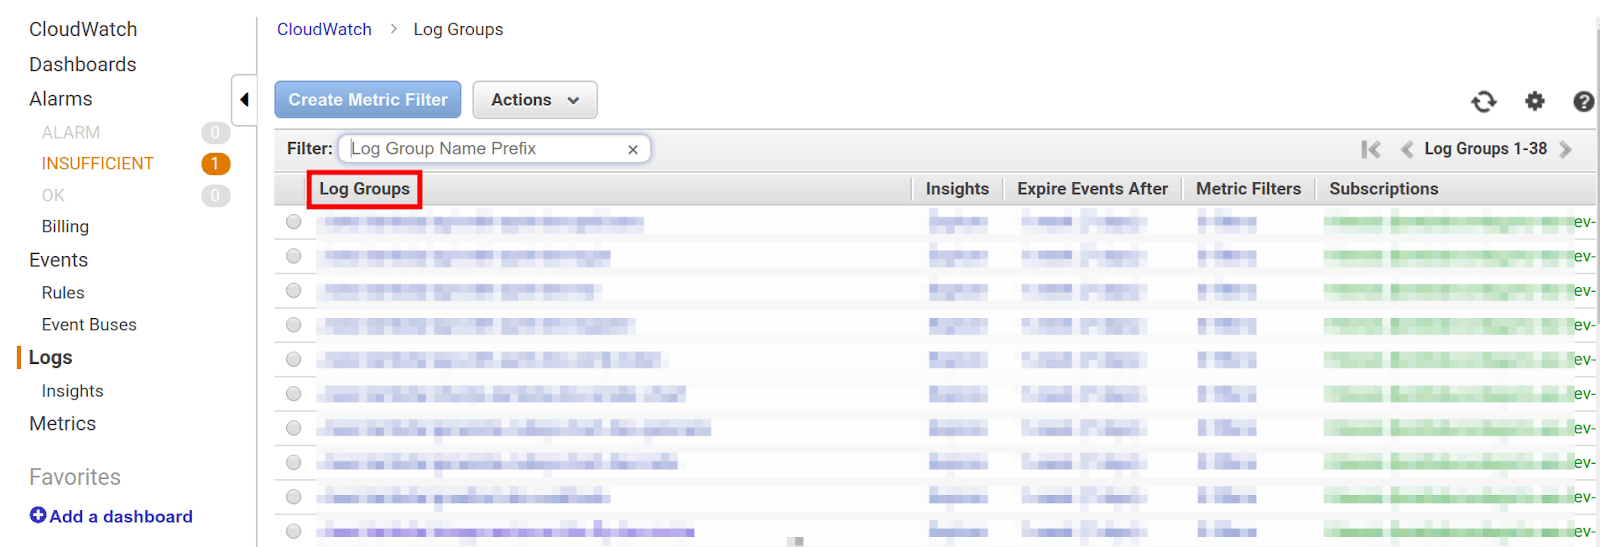
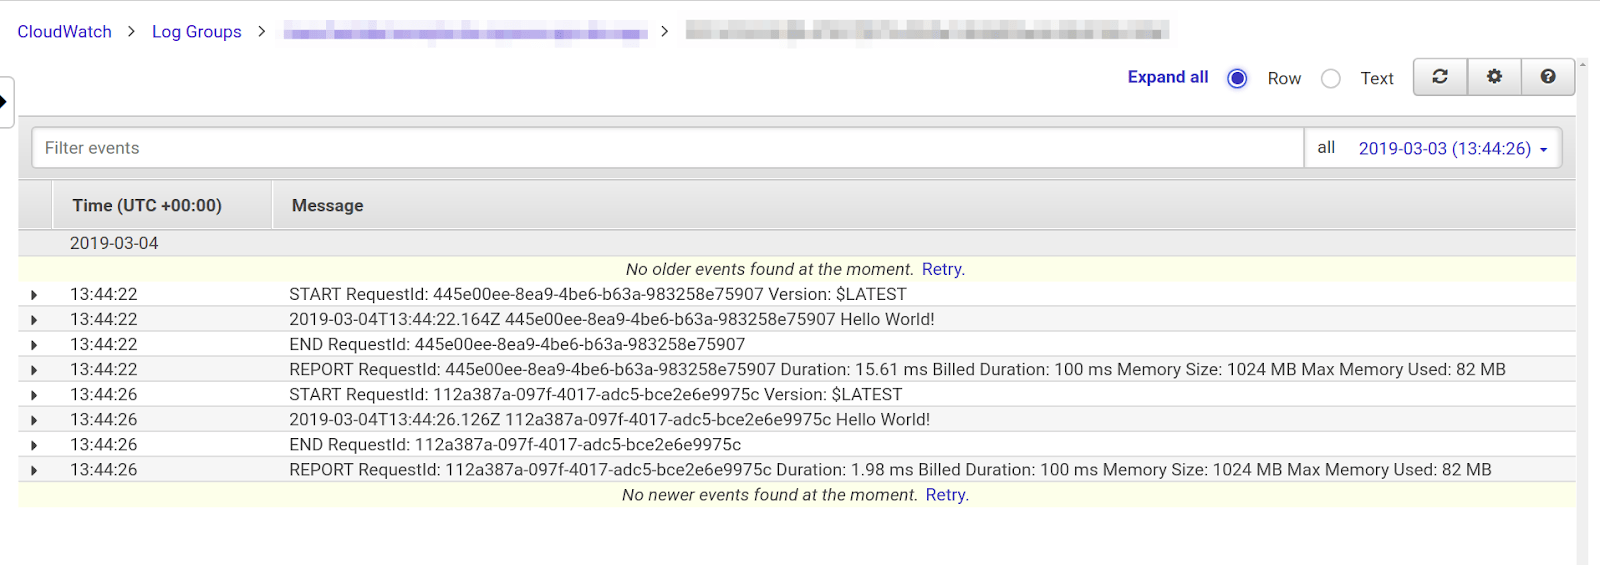 Let’s take a step back and look at the bigger picture. Every AWS Lambda function will create something called a Log Group in CloudWatch. Click on a particular Log Group.
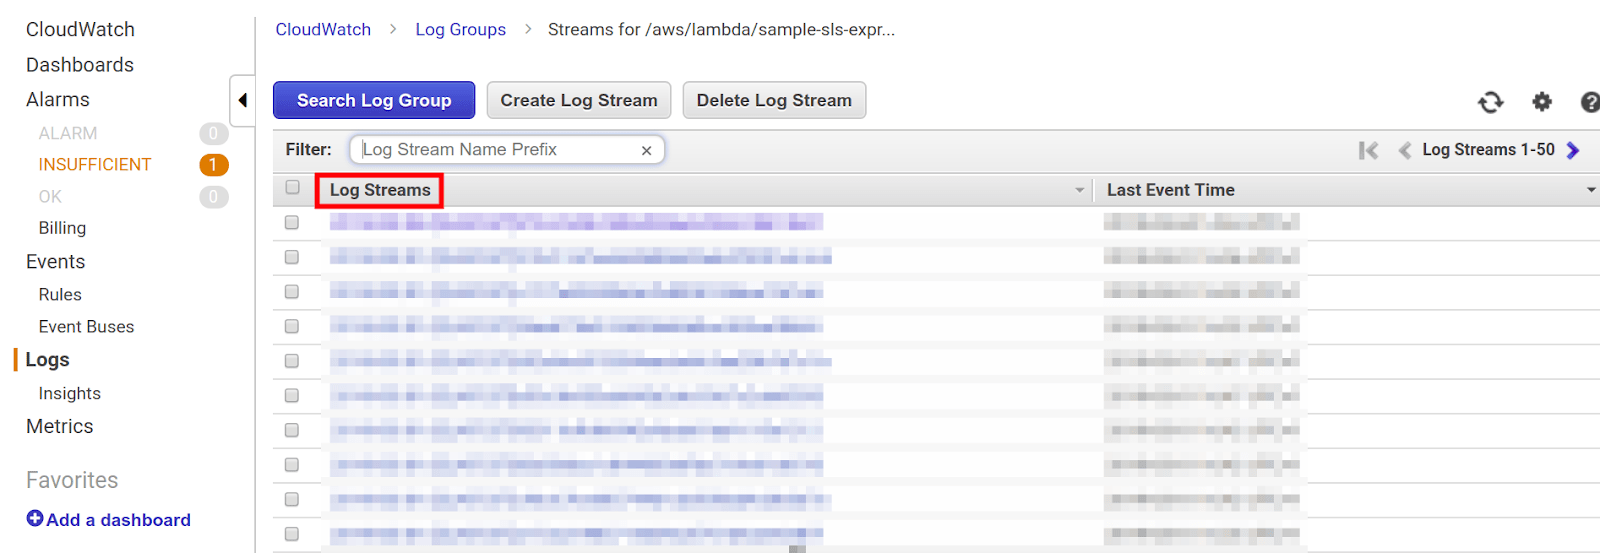
These log groups will contain Log Streams that are literally equivalent of log events coming from particular function instances.
This is hardly a good enough solution for system insight and having a proper overview of what your software is doing. Because of its structure, it’s incredibly hard to see and distinguish AWS Lambda Logs. Using centralized logging makes more sense. You can use your own Elasticsearch or a hosted setup. Sematext gives you full-stack observability for every part of your infrastructure and exposes an Elasticsearch API. Let me show you how easy it is to create CloudWatch log processing of your AWS Lambda Logs and pipe them to a Sematext Logs App.
Creating Centralized Logging with AWS Lambda and Kinesis
By using CloudWatch log group subscriptions and Kinesis you can funnel all of your AWS Lambda Logs to a dedicated AWS Lambda function that will ship them to Sematext’s Elasticsearch API. There you have a central location for all your AWS Lambda Logs. You can search and filter logs for all functions and with little effort have insight into the behavior and health of your AWS Lambda functions.
I’ll demo how to build a one-command-deploy solution you can use for yourself. It’s built with the Serverless Framework and Node.js. But, you can feel free to use AWS SAM or Terraform, and any programming language you want. The concept will stay the same.
Here’s what it will look like in the end.
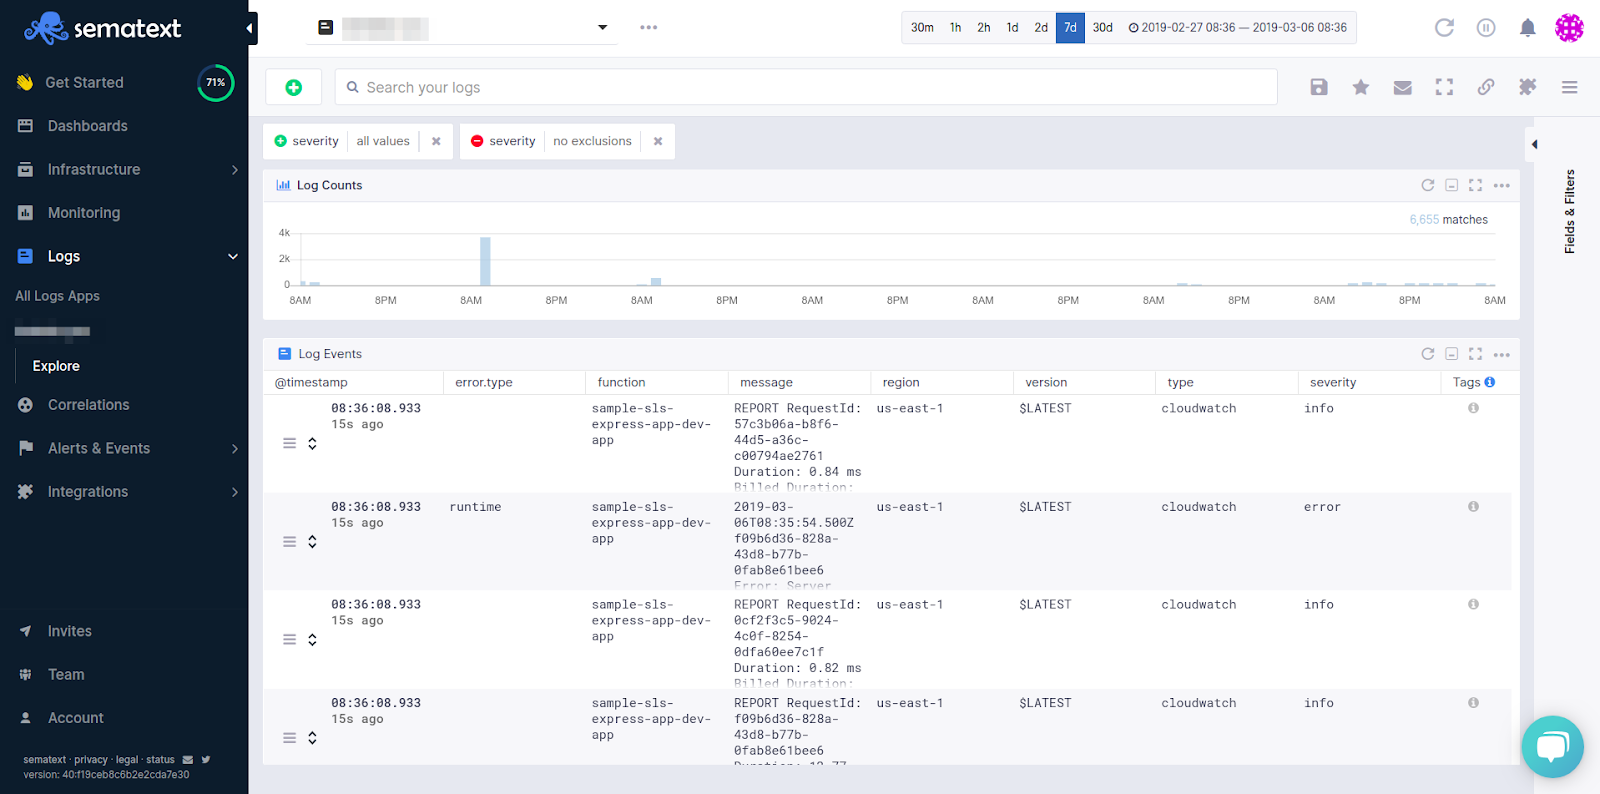
Much prettier than CloudWatch, and you can actually find what you’re looking for!
Setting Up The Serverless Project
First of all install the Serverless Framework, configure your IAM user, and create a new project. Full guide can be found here.
$ npm install -g serverless
$ sls config credentials --provider aws --key xxxxxxxxxxxxxx --secret xxxxxxxxxxxxxx
$ sls create --template aws-nodejs --path lambda-cwlogs-to-logsene
$ cd lambda-cwlogs-to-logsene
$ npm init -y
$ npm i logsene-js zlib serverless-iam-roles-per-function
Sweet! now move on to the serverless.yml.
Configuring AWS Lambda and Kinesis Resources
Open up the lambda-cwlogs-to-logsene directory in a code editor and check out the serverless.yml. Feel free to delete everything and paste this in.
# serverless.yml
service: lambda-cwlogs-to-logsene

plugins:
  - serverless-iam-roles-per-function

custom:
  stage: ${opt:stage, self:provider.stage}
  secrets: ${file(secrets.json)}

provider:
  name: aws
  runtime: nodejs8.10
  stage: dev
  region: ${self:custom.secrets.REGION, 'us-east-1'}
  versionFunctions: false

functions:
  shipper:
    handler: shipper.handler
    description: Sends CloudWatch logs from Kinesis to Sematext Elastic Search API
    memorySize: 128
    timeout: 3
    events:
      - stream:
          type: kinesis
          arn:
            Fn::GetAtt:
              - LogsKinesisStream
              - Arn
          batchSize: ${self:custom.secrets.BATCH_SIZE}
          startingPosition: LATEST
          enabled: true
    environment:
      LOGS_TOKEN: ${self:custom.secrets.LOGS_TOKEN}
      LOGS_BULK_SIZE: 100
      LOG_INTERVAL: 2000

  subscriber:
    handler: subscriber.handler
    description: Subscribe all CloudWatch log groups to Kinesis
    memorySize: 128
    timeout: 30
    events:
      - http:
          path: subscribe
          method: get
      - cloudwatchEvent:
          event:
            source:
              - aws.logs
            detail-type:
              - AWS API Call via CloudTrail
            detail:
              eventSource:
                - logs.amazonaws.com
              eventName:
                - CreateLogGroup
      - schedule:
          rate: rate(60 minutes)
    iamRoleStatements:
      - Effect: "Allow"
        Action:
          - "iam:PassRole"
          - "sts:AssumeRole"
          - "logs:PutSubscriptionFilter"
          - "logs:DeleteSubscriptionFilter"
          - "logs:DescribeSubscriptionFilters"
          - "logs:DescribeLogGroups"
          - "logs:PutRetentionPolicy"
        Resource: "*"
    environment:
      filterName: ${self:custom.stage}-${self:provider.region}
      region: ${self:provider.region}
      shipperFunctionName: "shipper"
      subscriberFunctionName: "subscriber"
      prefix: "/aws/lambda"
      retentionDays: ${self:custom.secrets.LOG_GROUP_RETENTION_IN_DAYS}
      kinesisArn:
        Fn::GetAtt:
          - LogsKinesisStream
          - Arn
      roleArn:
        Fn::GetAtt:
          - CloudWatchLogsRole
          - Arn

resources:
  Resources:
    LogsKinesisStream:
      Type: AWS::Kinesis::Stream
      Properties:
        Name: ${self:service}-${self:custom.stage}-logs
        ShardCount: ${self:custom.secrets.KINESIS_SHARD_COUNT}
        RetentionPeriodHours: ${self:custom.secrets.KINESIS_RETENTION_IN_HOURS}

    CloudWatchLogsRole:
      Type: AWS::IAM::Role
      Properties:
        AssumeRolePolicyDocument:
          Version: "2012-10-17"
          Statement:
            - Effect: Allow
              Principal:
                Service:
                  - logs.amazonaws.com
              Action:
                - sts:AssumeRole
        Policies:
          - PolicyName: root
            PolicyDocument:
              Version: "2012-10-17"
              Statement:
                - Effect: Allow
                  Action:
                    - kinesis:PutRecords
                    - kinesis:PutRecord
                  Resource:
                    Fn::GetAtt:
                      - LogsKinesisStream
                      - Arn
        RoleName: ${self:service}-${self:custom.stage}-cloudwatchrole
Let’s break it down piece by piece. The shipper AWS Lambda function will be triggered by a Kinesis stream, and it has some environment variables for configuring Sematext Logs. The Kinesis stream itself is defined at the bottom, in the resources section, and referenced in the AWS Lambda function events by using its ARN.
Moving on to the subscriber function. It can be triggered in three ways. It’s up to you to choose. If you have a lot of existing Log Groups, you may want to hit the HTTP endpoint to initially subscribe them all. Otherwise, having it trigger every once in a while, or only when a new Log Group is created, would be fine.
The LogsKinesisStream is the Kinesis stream to where we’re subscribing Log Groups, and CloudWatchLogsRole is the IAM Role which will allow CloudWatch to put records into Kinesis.
Configuring Sematext Logs
With that out of the way, you can now see we’re missing a secrets.json file. But, before we continue, jump over to Sematext, log in and create a Logs App. Press the tiny green button to add a Logs App.

After adding the name of the App and some basic info, you’ll see a waiting for data screen pop up. Press the integrations guide and copy your token.
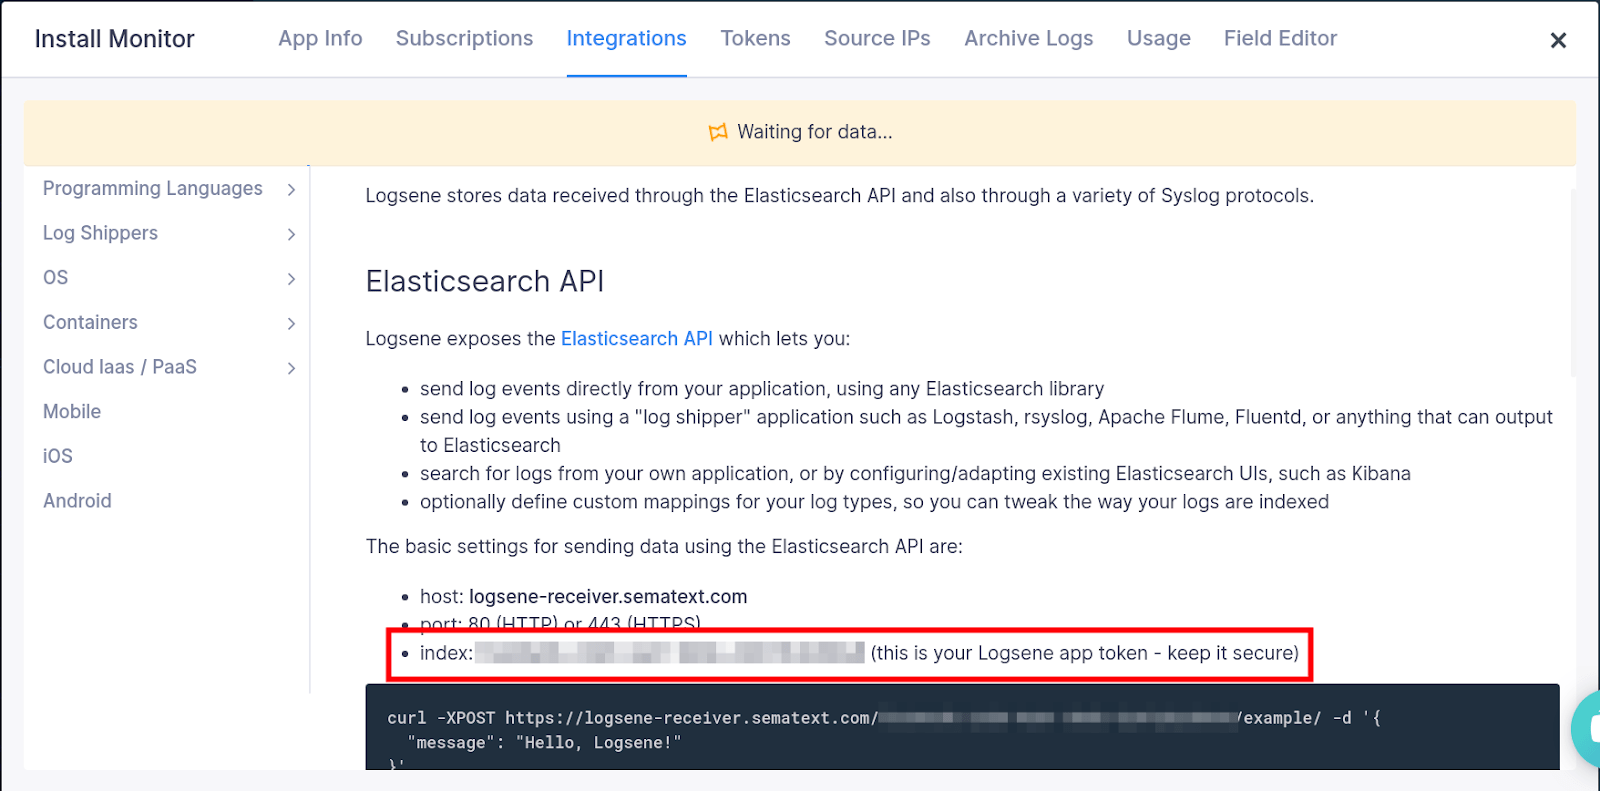
Now you can paste the token in the secrets.json file.
{
  "LOGS_TOKEN": "your-token",
  "REGION": "us-east-1",
  "BATCH_SIZE": 1000,
  "LOG_GROUP_RETENTION_IN_DAYS": 1,
  "KINESIS_RETENTION_IN_HOURS": 24,
  "KINESIS_SHARD_COUNT": 1
}
Adding the Subscriber AWS Lambda Function
I like saying Kinesis is a simpler version of Kafka. It’s basically a pipe. You subscribe data to be sent into it and tell it to trigger an AWS Lambda function as an event, once it satisfies a certain batch size.
The purpose of having a subscriber function is to subscribe all the AWS Lambda Log Groups to a Kinesis stream. Ideally they should be subscribed upon creation, and of course, initially when you want to subscribe all existing Log Groups to a new Kinesis stream. As a fallback, I also like to have an HTTP endpoint for when I want to manually trigger the subscriber.
In your code editor, create a new file and name it subscriber.js. Paste this snippet in.
// subscriber.js

const AWS = require('aws-sdk')
AWS.config.region = process.env.region
const cloudWatchLogs = new AWS.CloudWatchLogs()
const prefix = process.env.prefix
const kinesisArn = process.env.kinesisArn
const roleArn = process.env.roleArn
const filterName = process.env.filterName
const retentionDays = process.env.retentionDays
const shipperFunctionName = process.env.shipperFunctionName
const filterPattern = ''

const setRetentionPolicy = async (logGroupName) => {
  const params = {
    logGroupName: logGroupName,
    retentionInDays: retentionDays
  }
  await cloudWatchLogs.putRetentionPolicy(params).promise()
}

const listLogGroups = async (acc, nextToken) => {
  const req = {
    limit: 50,
    logGroupNamePrefix: prefix,
    nextToken: nextToken
  }
  const res = await cloudWatchLogs.describeLogGroups(req).promise()

  const newAcc = acc.concat(res.logGroups.map(logGroup => logGroup.logGroupName))
  if (res.nextToken) {
    return listLogGroups(newAcc, res.nextToken)
  } else {
    return newAcc
  }
}

const upsertSubscriptionFilter = async (options) => {
  console.log('UPSERTING...')
  const { subscriptionFilters } = await cloudWatchLogs.describeSubscriptionFilters({ logGroupName: options.logGroupName }).promise()
  const { filterName, filterPattern } = subscriptionFilters[0]

  if (filterName !== options.filterName || filterPattern !== options.filterPattern) {
    await cloudWatchLogs.deleteSubscriptionFilter({
      filterName: filterName,
      logGroupName: options.logGroupName
    }).promise()
    await cloudWatchLogs.putSubscriptionFilter(options).promise()
  }
}

const subscribe = async (logGroupName) => {
  const options = {
    destinationArn: kinesisArn,
    logGroupName: logGroupName,
    filterName: filterName,
    filterPattern: filterPattern,
    roleArn: roleArn,
    distribution: 'ByLogStream'
  }

  try {
    await cloudWatchLogs.putSubscriptionFilter(options).promise()
  } catch (err) {
    console.log(`FAILED TO SUBSCRIBE [${logGroupName}]`)
    console.error(JSON.stringify(err))
    await upsertSubscriptionFilter(options)
  }
}

const subscribeAll = async (logGroups) => {
  await Promise.all(
    logGroups.map(async logGroupName => {
      if (logGroupName.endsWith(shipperFunctionName)) {
        console.log(`SKIPPING [${logGroupName}] BECAUSE IT WILL CREATE CYCLIC EVENTS FROM IT'S OWN LOGS`)
        return
      }

      console.log(`SUBSCRIBING [${logGroupName}]`)
      await subscribe(logGroupName)

      console.log(`UPDATING RETENTION POLICY TO [${retentionDays} DAYS] FOR [${logGroupName}]`)
      await setRetentionPolicy(logGroupName)
    })
  )
}

const processAll = async () => {
  const logGroups = await listLogGroups([])
  await subscribeAll(logGroups)
}

exports.handler = async () => {
  console.log('subscriber start')
  await processAll()
  console.log('subscriber done')
  return {
    statusCode: 200,
    body: JSON.stringify({ message: `Subscription successful!` })
  }
}
Check out the processAll() function. It’ll grab all Log Groups from CloudWatch which match the prefix, and put them in an easily accessible array. You’ll then pass them to a subscribeAll() function, which will map through them while subscribing them to the Kinesis stream you defined in the serverless.yml.
Another cool thing is setting the retention policy to 7 days. You’ll rarely need more than that and it’ll cut the cost of keeping your Lambda logs in your AWS account.
Keep in mind you can also edit the filterPattern by which AWS Lambda Logs will get ingested. For now, I’ve chosen to keep it blank and not filter out anything. But, based on your needs you can match it with what kind of pattern your logger of choice creates.
Sweet, with that done, let’s move on to shipping some logs!
Adding the Shipper AWS Lambda Function
After the Kinesis stream receives Lambda logs from CloudWatch, it’ll trigger an AWS Lambda function dedicated to sending the logs to an Elasticsearch endpoint. For this example, we’ll use LogseneJS as the log shipper. It’s rather simple if you break it down. A batch of records will be sent in the event parameter to the shipper function. You parse the AWS Lambda Logs, giving them your desired structure, and ship them to Sematext. Here’s what it looks like. Create a new file, name it shipper.js and paste this code in.
// shipper.js
const Zlib = require('zlib')
const Logsene = require('logsene-js')
const logger = new Logsene(process.env.LOGS_TOKEN)
const errorPatterns = [
  'error'
]
const configurationErrorPatterns = [
  'module initialization error',
  'unable to import module'
]
const timeoutErrorPatterns = [
  'task timed out',
  'process exited before completing'
]
/**
 * Sample of a structured log
 * ***************************************************************************
 * Timestamp                RequestId                            Message
 * 2019-03-08T15:58:45.736Z 53499d7f-60f1-476a-adc8-1e6c6125a67c Hello World!
 * ***************************************************************************
 */
const structuredLogPattern = '[0-9]{4}-(0[1-9]|1[0-2])-(0[1-9]|[1-2][0-9]|3[0-1])T(2[0-3]|[01][0-9]):[0-5][0-9]:[0-5][0-9].[0-9][0-9][0-9]Z([ \t])[a-zA-Z0-9]{8}-[a-zA-Z0-9]{4}-[a-zA-Z0-9]{4}-[a-zA-Z0-9]{4}-[a-zA-Z0-9]{12}([ \t])(.*)'
const regexError = new RegExp(errorPatterns.join('|'), 'gi')
const regexConfigurationError = new RegExp(configurationErrorPatterns.join('|'), 'gi')
const regexTimeoutError = new RegExp(timeoutErrorPatterns.join('|'), 'gi')
const regexStructuredLog = new RegExp(structuredLogPattern)
const lambdaVersion = (logStream) => logStream.substring(logStream.indexOf('[') + 1, logStream.indexOf(']'))
const lambdaName = (logGroup) => logGroup.split('/').reverse()[0]
const checkLogError = (log) => {
  if (log.message.match(regexError)) {
    log.severity = 'error'
    log.error = {
      type: 'runtime'
    }
  } else if (log.message.match(regexConfigurationError)) {
    log.severity = 'error'
    log.error = {
      type: 'configuration'
    }
  } else if (log.message.match(regexTimeoutError)) {
    log.severity = 'error'
    log.error = {
      type: 'timeout'
    }
  }
  return log
}
const splitStructuredLog = (message) => {
  const parts = message.split('\t', 3)
  return {
    timestamp: parts[0],
    requestId: parts[1],
    msg: parts[2]
  }
}

/**
 * Create payload for Logsene API
 */
const parseLog = (functionName, functionVersion, message, awsRegion) => {
  if (
    message.startsWith('START RequestId') ||
    message.startsWith('END RequestId') ||
    message.startsWith('REPORT RequestId')
  ) {
    return
  }

  // if log is structured
  if (message.match(regexStructuredLog)) {
    const { timestamp, requestId, msg } = splitStructuredLog(message)
    return checkLogError({
      message: msg,
      function: functionName,
      version: functionVersion,
      region: awsRegion,
      type: 'lambda',
      severity: 'debug',
      timestamp: timestamp,
      requestId: requestId
    })
  } else { // when log is NOT structured
    return checkLogError({
      message: message,
      function: functionName,
      version: functionVersion,
      region: awsRegion,
      type: 'lambda',
      severity: 'debug'
    })
  }
}

const parseLogs = (event) => {
  const logs = []

  event.Records.forEach(record => {
    const payload = Buffer.from(record.kinesis.data, 'base64')
    const json = (Zlib.gunzipSync(payload)).toString('utf8')
    const data = JSON.parse(json)
    if (data.messageType === 'CONTROL_MESSAGE') { return }

    const functionName = lambdaName(data.logGroup)
    const functionVersion = lambdaVersion(data.logStream)
    const awsRegion = record.awsRegion

    data.logEvents.forEach(logEvent => {
      const log = parseLog(functionName, functionVersion, logEvent.message, awsRegion)
      if (!log) { return }
      logs.push(log)
    })
  })

  return logs
}

const shipLogs = async (logs) => {
  return new Promise((resolve) => {
    if (!logs.length) { return resolve('No logs to ship.') }
    logs.forEach(log => logger.log(log.severity, 'LogseneJS', log))
    logger.send(() => resolve('Logs shipped successfully!'))
  })
}

exports.handler = async (event) => {
  try {
    const res = await shipLogs(parseLogs(event))
    console.log(res)
  } catch (err) {
    console.log(err)
    return err
  }
  return 'shipper done'
}
The heart of the shipper Lambda lies in the parseLogs() and shipLogs() functions. The former will take the event parameter, extract all log events, parse them, add them to an array, and return that array. While the latter will take that same logs array, add every single log event to the LogseneJS buffer, and send them all in one go. The location is the Logs App you created above.
Do you remember the image from the beginning of the article where you saw log events of a typical function invocation? There you can see it generates 4 different types of log events.
START RequestId
...
END RequestId
REPORT RequestId
They can start with any of these three patterns, where the ellipsis represents any type of string that is printed to stdout in the function runtime (console.log() in Node.js).
The parseLog() function will skip the START, END, and REPORT log events entirely, and only return user-defined log events as either debug or error based on if they’re user-defined stdout or any type of error in the function runtime, configuration or duration.
The log message itself can be structured by default, but not always. By default in the Node.js runtime it has a structure that looks like this.
Timestamp                     RequestId                                            Message
2019-03-08T15:58:45.736Z      53499d7f-60f1-476a-adc8-1e6c6125a67c                 Hello World!
The code in the shipper Lambda is configured to work with the structure above or with a structure that only has the message part. If you’re using another runtime, I’d advise you to use structured logging to have a common structure for your AWS Lambda Logs.
With the coding part done, you’re ready to deploy and test your custom log shipper.
Deploy and Test Your Centralized AWS Lambda Logs
The beauty of using infrastructure as code tools like the Serverless Framework is how simple deployments are. You can push everything to the cloud with one command. Jump back to your terminal and in the directory of your project run:
$ sls deploy
You’ll see output get printed to the console.
[output]
Serverless: Packaging service...
Serverless: Excluding development dependencies...
Serverless: Uploading CloudFormation file to S3...
Serverless: Uploading artifacts...
Serverless: Uploading service .zip file to S3 (2.15 MB)...
Serverless: Validating template...
Serverless: Updating Stack...
Serverless: Checking Stack update progress...
............
Serverless: Stack update finished...
Service Information
service: lambda-cwlogs-to-logsene
stage: dev
region: us-east-1
stack: lambda-cwlogs-to-logsene-dev
api keys:
None
endpoints:
GET - https://.execute-api.us-east-1.amazonaws.com/dev/subscribe
functions:
shipper: lambda-cwlogs-to-logsene-dev-shipper
subscriber: lambda-cwlogs-to-logsene-dev-subscriber
layers:
None
Serverless: Removing old service artifacts from S3…
That’s it. You now have a setup for shipping all logs from your Lambda functions into Sematext Cloud. Make sure to trigger the subscriber Lambda function to subscribe the Log Groups to the Kinesis stream. After triggering the subscriber you’ll see the generated AWS Lambda Logs in Sematext, and you can rest assured it works.

Above you can see how I added severity filtering. You can easily choose which value to filter by, giving you an easy way to track errors, timeouts and debug AWS Lambda Logs.
What about AWS Kinesis costs?
The cost of having a setup like this in your AWS account is rather cheap. The flat cost of a single shard Kinesis stream is roughly $14/month with additional costs for the amount of data streamed. The single shard has an ingest capacity of 1MB/sec or 1000 records/sec, which is fine for most users.
The Kinesis cost is split into shard hours and PUT payload units the size of 25KB. One shard costs $0.36 per day, while one million PUT Payload Units cost $0.014. Hypothetically, if you have one shard and 100 PUT payload units per second that’ll end up costing you $10.8 for the shard and $3.6288 for the payload units during a 30 day period.
What about AWS Lambda costs?
The AWS Lambda functions are configured to use the minimum amount of memory possible, 128MB, meaning the costs will often stay in the free tier during moderate use. That’s the least of your worries.
Concluding Centralized AWS Lambda Logs with Sematext
Having a central location for your AWS Lambda Logs is crucial. Even though CloudWatch is useful in its own way, it lacks a sense of overview. By using centralized logging you don’t need to switch contexts for debugging different types of applications. Sematext can monitor your whole software stack. Having your Kubernetes logs, container logs and AWS Lambda logs in Sematext Logs where you can easily keep track of everything is a major benefit.
If you need to check out the code once again, here’s the repo, give it a star if you want more people to see it on GitHub. You can also clone the repo and deploy it right away. Don’t forget to add you Logs App token first.
If you need an observability solution for your software stack, check out Sematext. We’re pushing to open source our products and make an impact.
Hope you guys and girls enjoyed reading this as much as I enjoyed writing it. If you liked it, slap that tiny share button so more people will see this tutorial. Until next time, be curious and have fun.