When dealing with log centralization in your organization you have to start with something. Often times people start by collecting logs for the most crucial pieces of software, and frequently one chooses to ship them to their own in-house Elasticsearch-based solution (aka ELK stack) or one of the SaaS solutions available on the market, like our Logsene. What we regularly see in our logging consulting practice and with our Logsene users, is that it’s just a matter of time when everyone in the organization realizes how useful it is to have centralized logs and starts sending logs from every crucial software/IT — and business — component in the organization to the log centralization system.
Despite Kibana being frequently used for log analysis and reporting, Kibana is one of those pieces whose own logs are often left behind. Kibana is no longer a simple set of static Javascript files, not since version 4. It is a Node.js application and as such it produces its own logs, too. They can provide insight when something is not right with Kibana, so why put them in the same place as all the other logs? Let’s see how to do that.
For the rest of the post I’ll be using Kibana 5.1.1 along with Elasticsearch 5.1.1 and Filebeat 5.1.1.
Default Kibana Log Structure
So what do Kibana logs look like? With the default setup the logs look as follows:
  log   [20:53:02.732] [info][status][plugin:kibana@5.1.1] Status changed from uninitialized to green - Ready

  log   [20:53:02.782] [info][status][plugin:elasticsearch@5.1.1] Status changed from uninitialized to yellow - Waiting for Elasticsearch

  log   [20:53:02.801] [info][status][plugin:console@5.1.1] Status changed from uninitialized to green - Ready

  log   [20:53:03.006] [info][status][plugin:timelion@5.1.1] Status changed from uninitialized to green - Ready

  log   [20:53:03.010] [info][listening] Server running at http://localhost:5601

  log   [20:53:03.011] [info][status][ui settings] Status changed from uninitialized to yellow - Elasticsearch plugin is yellow

  log   [20:53:08.028] [info][status][plugin:elasticsearch@5.1.1] Status changed from yellow to yellow - No existing Kibana index found

  log   [20:53:08.089] [info][status][plugin:elasticsearch@5.1.1] Status changed from yellow to green - Kibana index ready

  log   [20:53:08.090] [info][status][ui settings] Status changed from yellow to green - Ready
They are in plain text format, so to send them to Elasticsearch we could use a pipeline similar to the following one:
With that approach, we need Logstash in the middle to parse the data the plain text logs and give them structure. Keep in mind that Logstash has a heavy memory footprint and isn’t the fastest log shipper around. There are several lighter and faster Logstash alternatives to consider, depending on where you want your data to be parsed. For example, you could use a log shipper that is itself able to parse data, like Logagent or rsyslog. If we stick with Filebeat and change the Kibana logging format to JSON, we can throw away Logstash and simplify our pipeline:
Luckily, we can do a slight change in the Kibana configuration and not worry about non-JSON log files anymore.
Writing Kibana Logs as JSON to a File
You may have noticed that by default, the logs that are displayed at the standard output are in plain text format. What’s more, they are not saved to a file. This is not something that we like – we would like to have the logs saved into a file, so we can either parse it or send it directly to a destination of our choice.
To do that we need to uncomment the logging.dest property in config/kibana.yml configuration file and set the destination file for our logs. Let’s assume that we will put the logs in /var/log/kibana/kibana.log file, so our configuration for that should look as follows:
logging.dest: /var/log/kibana/kibana.log
Once the change is done and we start Kibana we will see that instead of writing to the console, we have the logs in the specified file. What’s more, the data that is in the log file is no longer in plain text format, but in JSON:
{"type":"log","@timestamp":"2017-01-13T21:46:07Z","tags":["status","plugin:kibana@5.1.1","info"],"pid":83295,"state":"green","message":"Status changed from uninitialized to green - Ready","prevState":"uninitialized","prevMsg":"uninitialized"}

{"type":"log","@timestamp":"2017-01-13T21:46:07Z","tags":["status","plugin:elasticsearch@5.1.1","info"],"pid":83295,"state":"yellow","message":"Status changed from uninitialized to yellow - Waiting for Elasticsearch","prevState":"uninitialized","prevMsg":"uninitialized"}

{"type":"log","@timestamp":"2017-01-13T21:46:08Z","tags":["status","plugin:console@5.1.1","info"],"pid":83295,"state":"green","message":"Status changed from uninitialized to green - Ready","prevState":"uninitialized","prevMsg":"uninitialized"}

{"type":"log","@timestamp":"2017-01-13T21:46:08Z","tags":["status","plugin:elasticsearch@5.1.1","info"],"pid":83295,"state":"green","message":"Status changed from yellow to green - Kibana index ready","prevState":"yellow","prevMsg":"Waiting for Elasticsearch"}

{"type":"log","@timestamp":"2017-01-13T21:46:08Z","tags":["status","plugin:timelion@5.1.1","info"],"pid":83295,"state":"green","message":"Status changed from uninitialized to green - Ready","prevState":"uninitialized","prevMsg":"uninitialized"}

{"type":"log","@timestamp":"2017-01-13T21:46:08Z","tags":["listening","info"],"pid":83295,"message":"Server running at http://localhost:5601"}

{"type":"log","@timestamp":"2017-01-13T21:46:08Z","tags":["status","ui settings","info"],"pid":83295,"state":"green","message":"Status changed from uninitialized to green - Ready","prevState":"uninitialized","prevMsg":"uninitialized"}
Way better for log shipping, compared to the console and plain text output, right? Well, not really, if you want to keep eyeballing these logs via a terminal, but if you have Kibana the chances are you want to inspect logs via Kibana. So now we have logs going to a file and in JSON format. There is nothing else left to do but send the logs to Elasticsearch.
Sending JSON Formatted Kibana Logs to Elasticsearch
To send the logs that are already JSON structured and are in a file we just need Filebeat with appropriate configuration. We need to specify the input file and Elasticsearch output. For example, I’m using the following configuration that I stored in filebeat-json.yml file:
filebeat.prospectors:

  - input_type: log

  paths:

    - /var/log/*.log

output.elasticsearch:

  hosts: ["localhost:9200"]
We just take any file that ends with log extension in the /var/log/kibana/ directory (our directory for Kibana logs) and send them to Elasticsearch working locally. Once we run Filebeat using the following command we should see the data in Kibana:
./filebeat -c kibana-json.yml
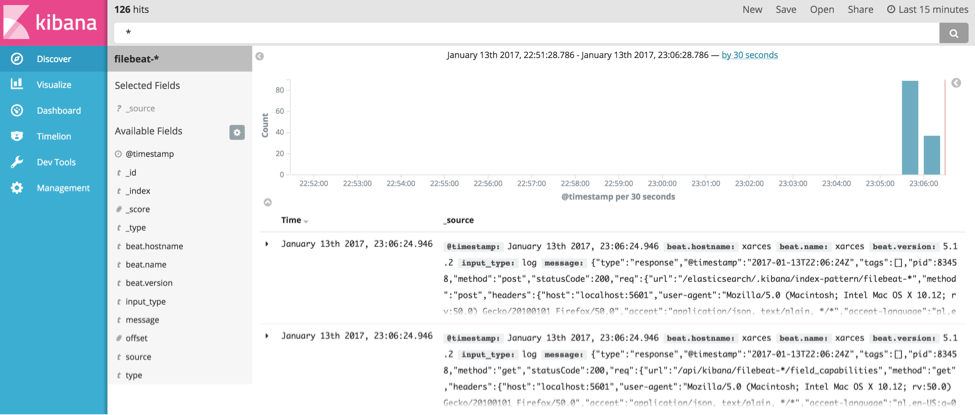
If we now go to Kibana and use the filebeat-* index pattern we’ll see some data in the Discover tab of Kibana:
Sending Kibana Logs to Logsene
If you don’t want to host your own Elasticsearch instance you can send your Kibana logs to one of the SaaS services that understand Elasticsearch API, for example our Logsene. This is super simple. Just go create a free account if you don’t have it already and note your Logsene app token (you can find it here). We will also modify our Filebeat configuration slightly and use the following configuration:
filebeat.prospectors:

  - input_type: log

  paths:

    - /Users/gro/kibana/5.1.1/logs/*.log

output.elasticsearch:

  hosts: ["https://logsene-receiver.sematext.com:443"]

  protocol: https

  index: "aaaaaaaa-bbbb-cccc-dddd-eeeeeeeeeeee"

  template.enabled: false
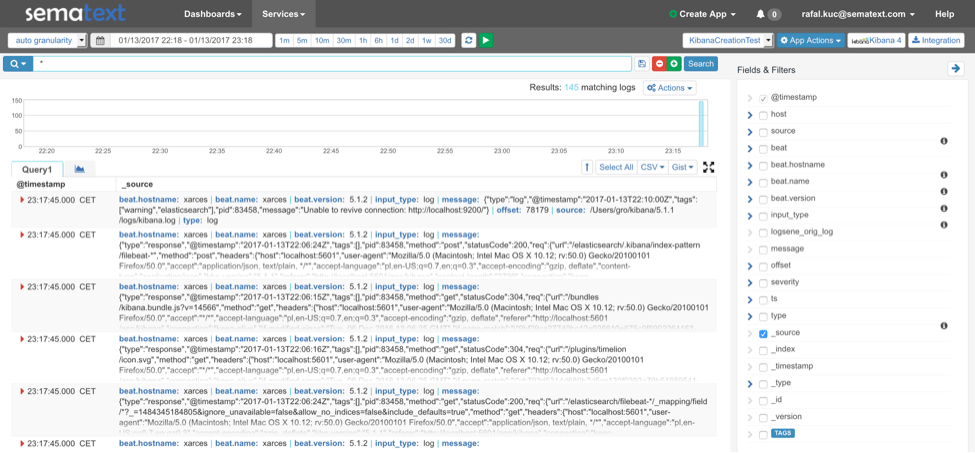
The key point in the above configuration is the output configuration. We point Filebeat to https://logsene-receiver.sematext.com:443 and use protocol property set to httpse because we want to use HTTPS so that no one can sniff our traffic and see our logs. We also specify the index property, which should be set to the token of your Logsene app. Finally, we disable template sending by setting the template.enabled property to false. After starting Filebeat you will see the data in Logsene:
Filebeat Alternative
Of course, Filebeat is not the only option for sending Kibana logs to Logsene or your own Elasticsearch. For example, you could also use Logagent, an open source, lightweight log shipper. Doing that is very, very simple, even simpler than with Filebeat. We can just run the following command and our logs will be delivered to the Logsene system identified by the token that we provide:
cat kibana.log | logagent -i aaaaaaaa-bbbb-cccc-dddd-eeeeeeeeeeee
You can also configure Logagent to work as a service.
As you can see, shipping Kibana logs whether they are structured or unstructured is fairly simple. However, the process could be even simpler! Typically, the most complex part of an ELK stack is the “E” — Elasticsearch. Thus, if you don’t feel like dealing with securing Elasticsearch, Elasticsearch tuning, scaling, and other forms of maintenance you may want to consider ELK as a service, such as our Logsene. Why? By using Logsene you’ll get a secure, fully managed log management infrastructure with Elasticsearch API and built-in Kibana — without having to investing in and dealing with the infrastructure or becoming an Elasticsearch expert.
Moreover, with Sematext Cloud you can correlate your logs and metrics with a single tool enabling you to identify, diagnose, and fix issues in your environment without context-switching between multiple tools.


