Pick the plan with the features you like and customize it to meet the needs of your business. It’s as simple as that.
Stellar support
In any circumstance, whether it's through email, live chat, or phone calls, you will have a premium experience.
Plan Recommendations.
We will take this data and calculate the optimal plan based on your specific needs. Nothing more and nothing less. You pay for only what you use.
Relational database monitoring
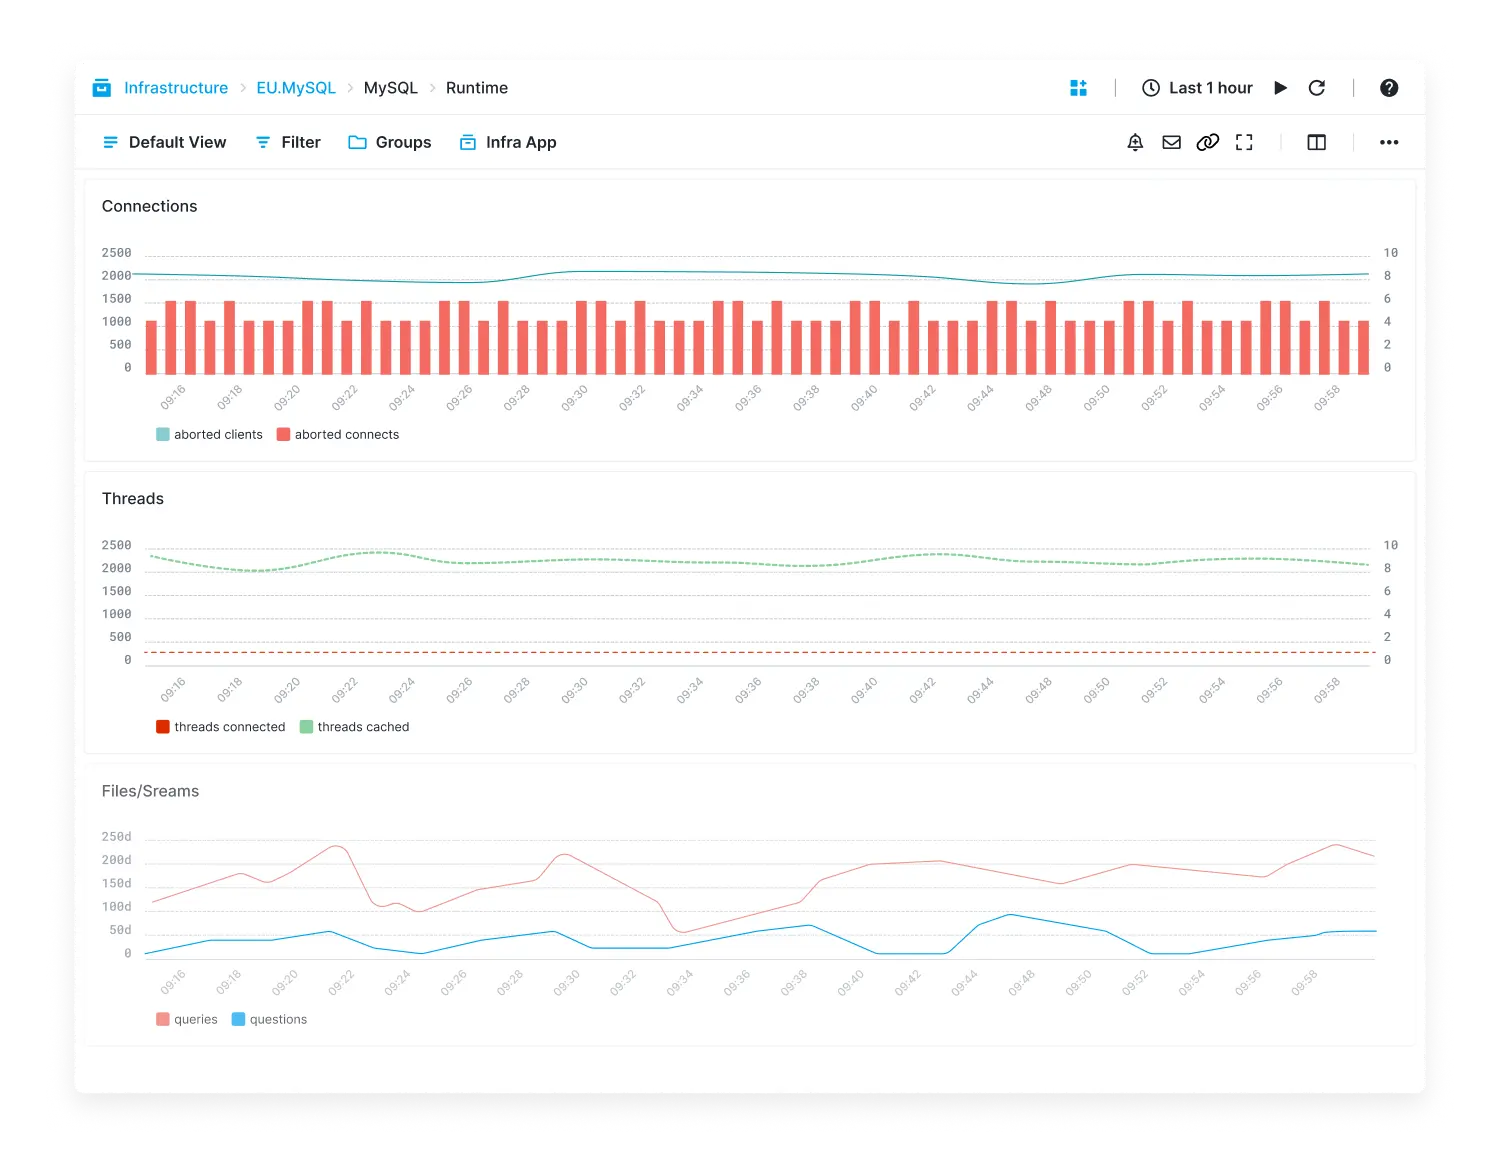
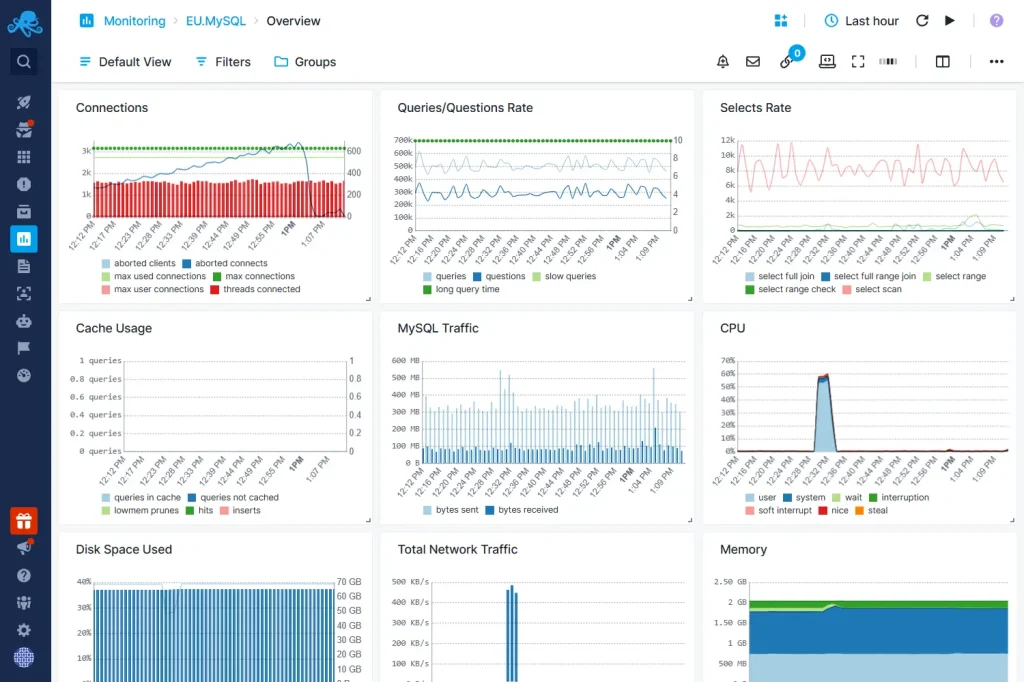
Detailed AWS RDS, AWS Aurora, PostgreSQL, MySQL and MariaDB performance statistics, including MyISAM and InnoDB engine metrics.
Get SQL select or sort usage stats
View access and connection performance details (used connections, aborted clients…)
Get alerted on database metrics for tables, handles, threads, open files, cache usage, etc.
Monitor database performance in real-time
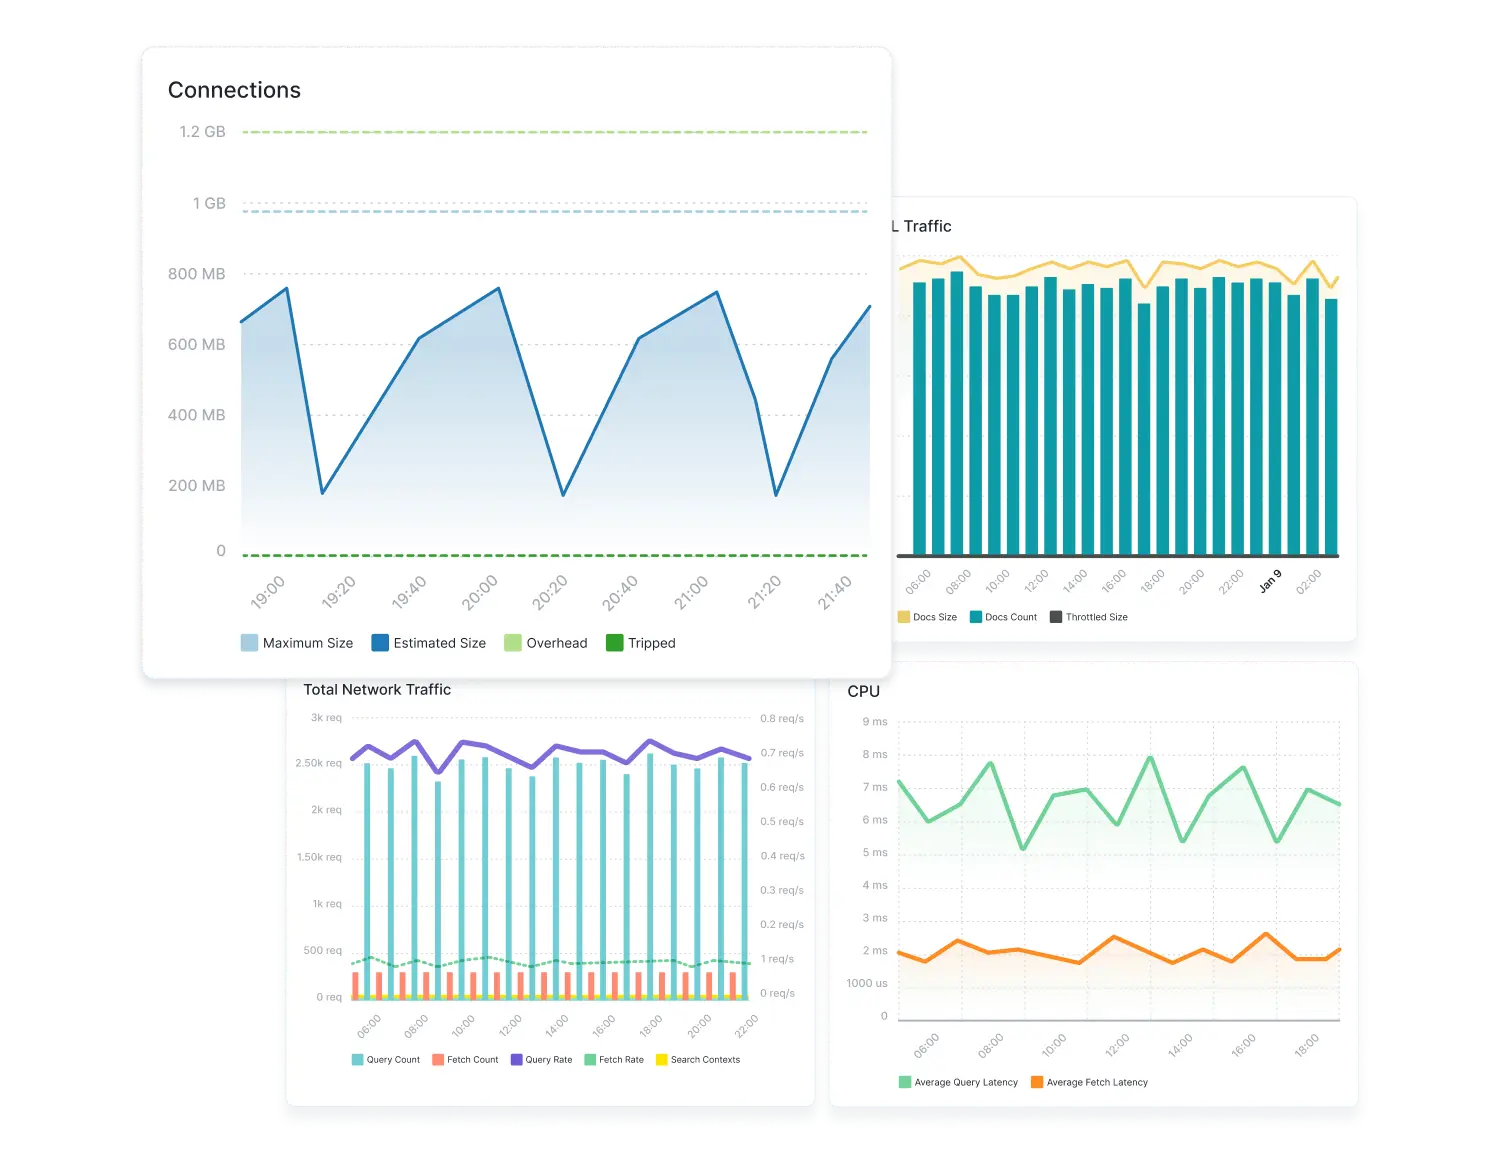
Get insights into performance issues in real time and stay in control with our database monitoring software.
Understand traffic in and out of database
See performance and specific database statements being executed database queries/questions details
Monitor database slow queries count and wait events
Open-source database monitoring agent
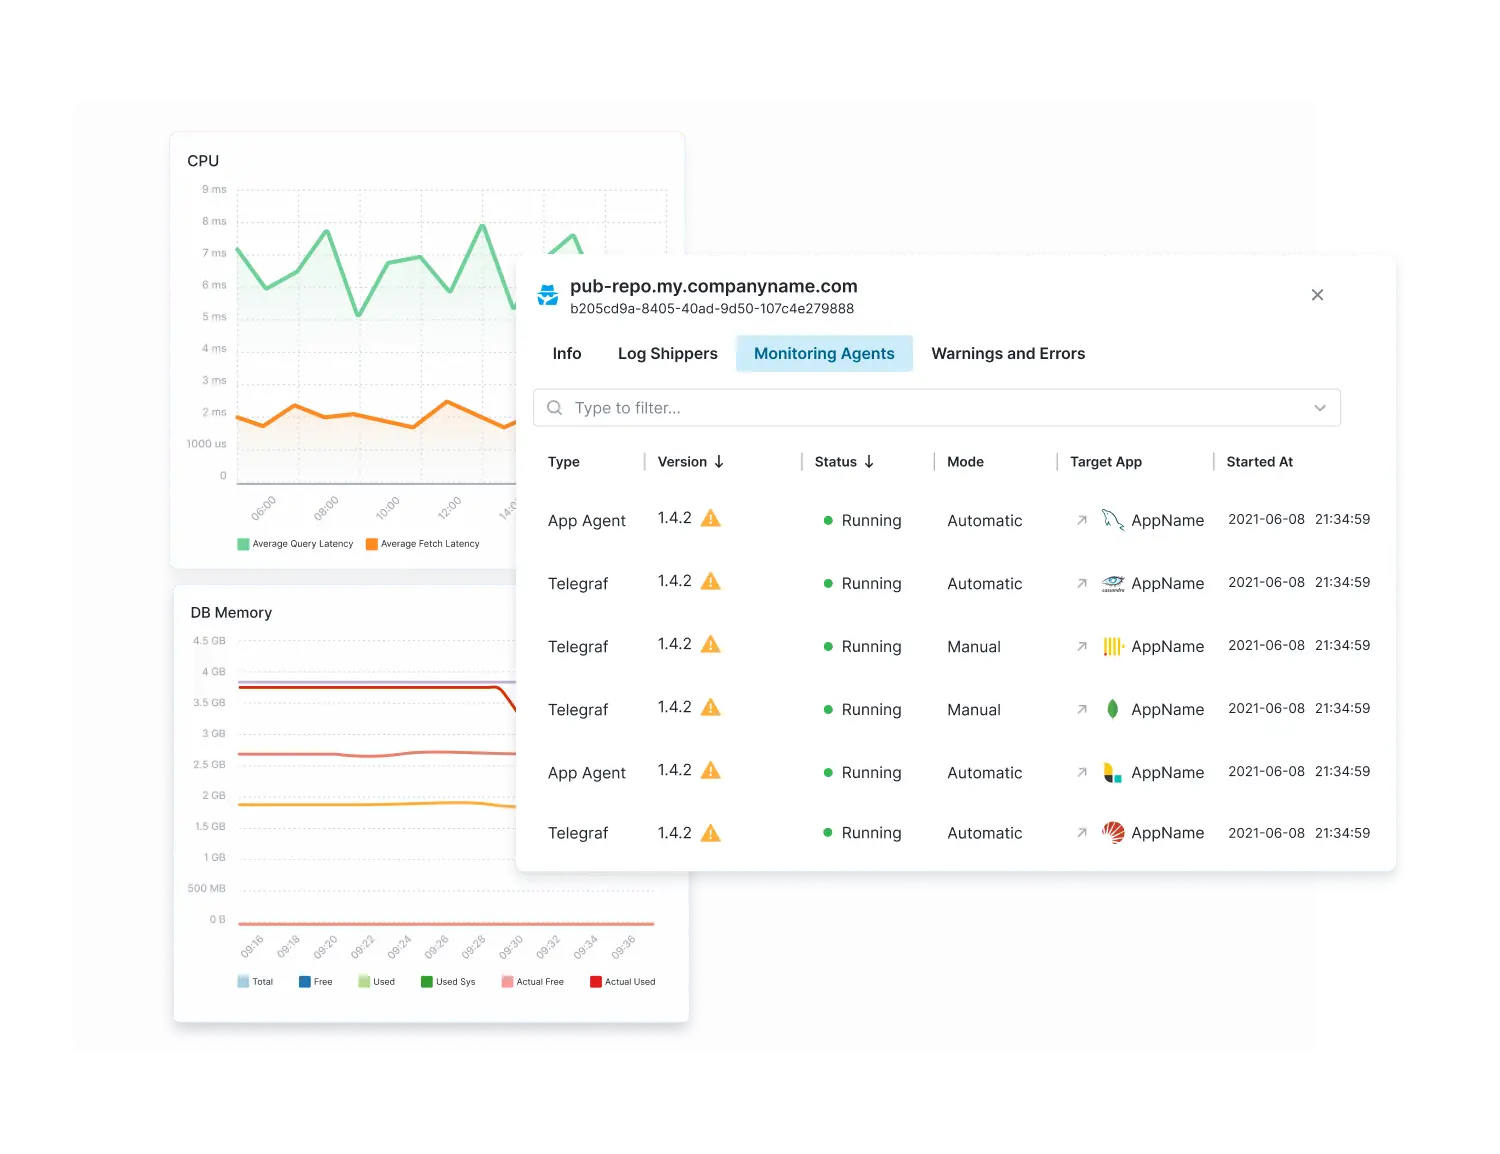
Sematext collects health metrics from a variety of databases and other sources in an easy, fully pluggable way.
Out of the box integrations for monitoring MySQL, PostgreSQL, Cassandra, Elasticsearch, Solr, ClickHouse, MongoDB, and others
Extensible agent integrations let you create new monitoring integrations without any coding
Supported technologies
Relational/SQL Databases
NoSQL Databases
Search engines
Database performance monitoring in a single dashboard
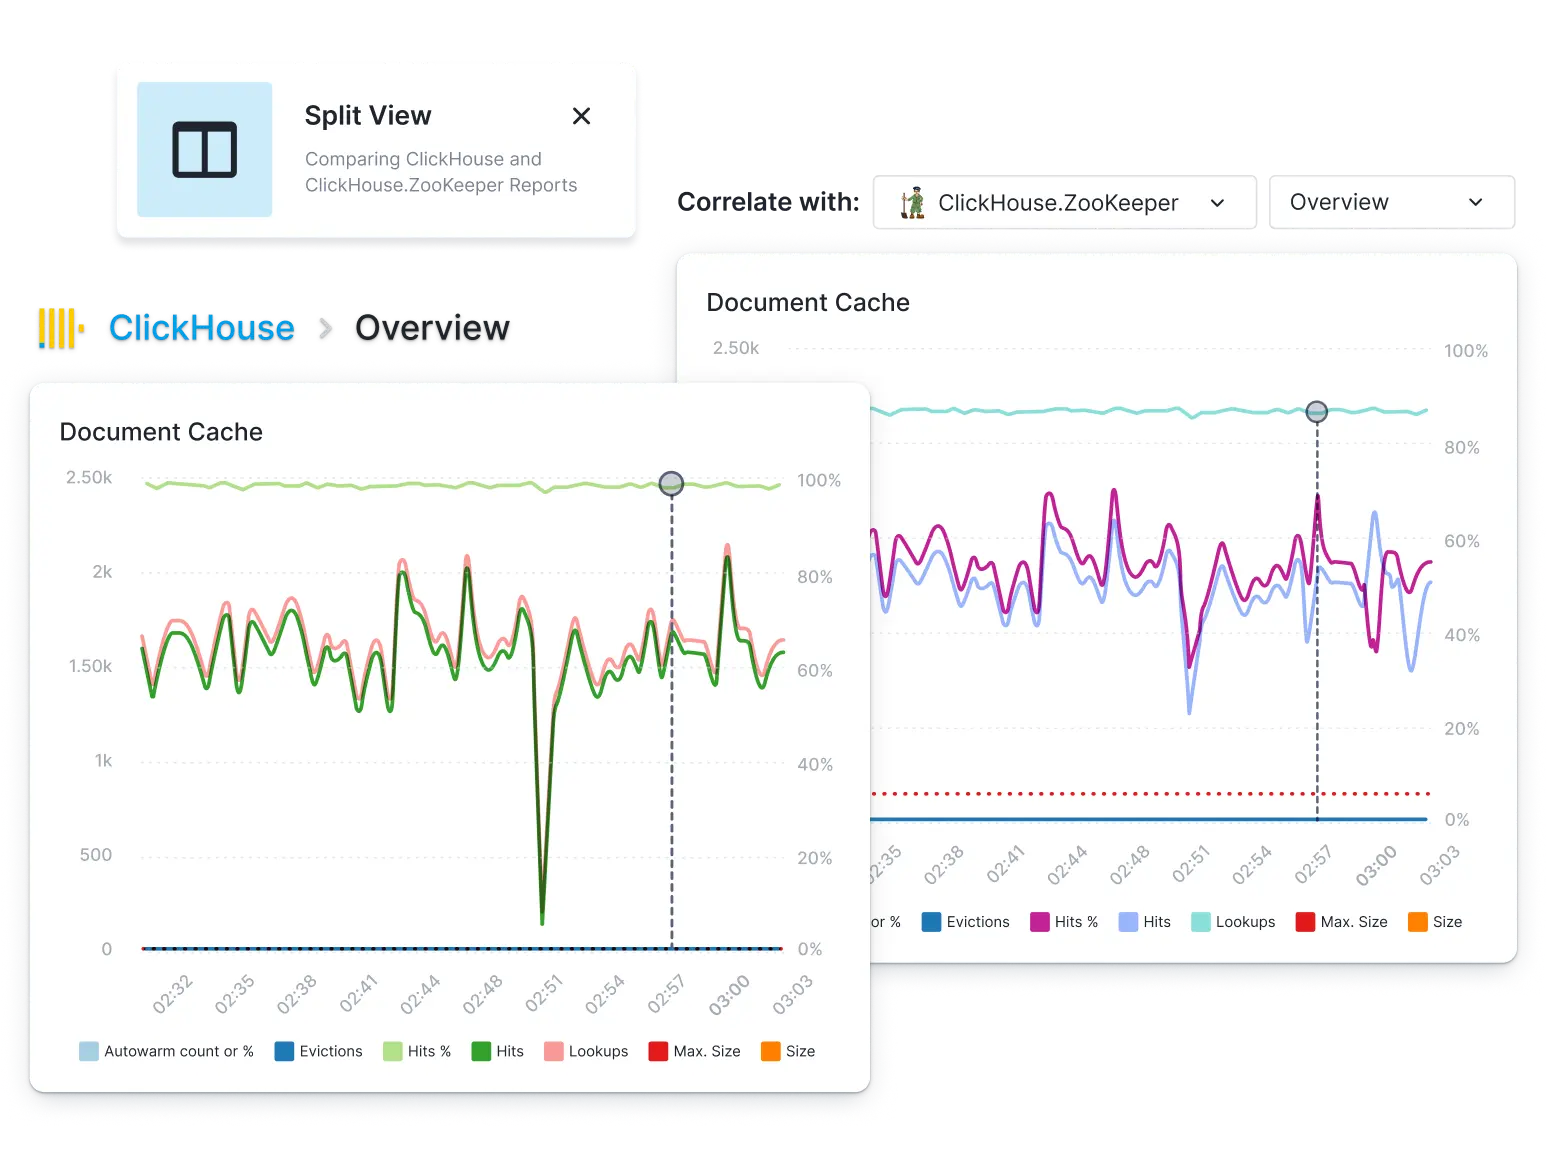
Monitor all your databases in a unified view. Correlate database performance data with application metrics, logs, and events for faster troubleshooting.
Sematext Agent automatically discovers your databases and their logs
Use out-of-the-box dashboards and alert rules and create your own
Easily pivot from viewing performance metrics to troubleshooting logs
View application and database performance metrics in a split view for each correlation
customers love us
You're in a good company.
Working with your team at Sematext has been amazing. From Seán on the customer success front to the entire support team, each interaction highlights their deep commitment to our joint success.
Kevin Dailey
Director, Managed Services Delivery, Fenom Digital
Sematext brings years of logging and monitoring expertise to the Docker community. They’ve been an active participant via their Docker performance and log monitoring solutions, their Docker logging and monitoring webinars, and numerous blog posts. Overall, collaborating with Sematext has delivered valuable logging and monitoring tools and resources to our community.
Nick Stinemates
Head of Business Development, Docker
Just looking at the default graphs it was clear I can reduce my serverless resource usage on Vercel by 90%, by reducing the allocated memory. Sematext simply turns your logs into actionable data, out of the box. Costs, performance, it’s all there.
Andrei Vreja
Maker, iForge
Sematext Cloud has been a game-changer for us, with its transparent pricing, powerful log analysis features, and expert support, making it an invaluable tool that has exceeded our expectations.
Sematext shows one unified view for all our Docker logs, events, and metrics!
Ben Reichter
DevOps Engineer, Tozny
I must say very personal service and a great product! I like the simplicity of the setup and how quick and responsive is the UI. It is like it was created from sys admins for sys admins.
Chris George
Manager, VIPConsult
Sematext Logs provides us with a flexible, extensible, and reliable means of monitoring all of our environments in real-time.
Zach David
Test Automation Lead, Healthgrades
We looked into running our own Elastic Stack, and quickly realized that was a job and specialty within itself. We are a small startup and every dollar counts. Wasting precious and expensive sysadmin time on managing things far out of our project scope really isn’t an option