There are 1.3 billion websites out there in the great unknown and it’s hard not to think about what makes them different from one another. Why do users flock to one website and ignore the other completely? One major differentiator is, of course, content. I’m not going to dwell on what type of content is better. Another reason why users stick to one website over another is the user experience.
Today we’ll be looking at a third major differentiator: Website Performance.
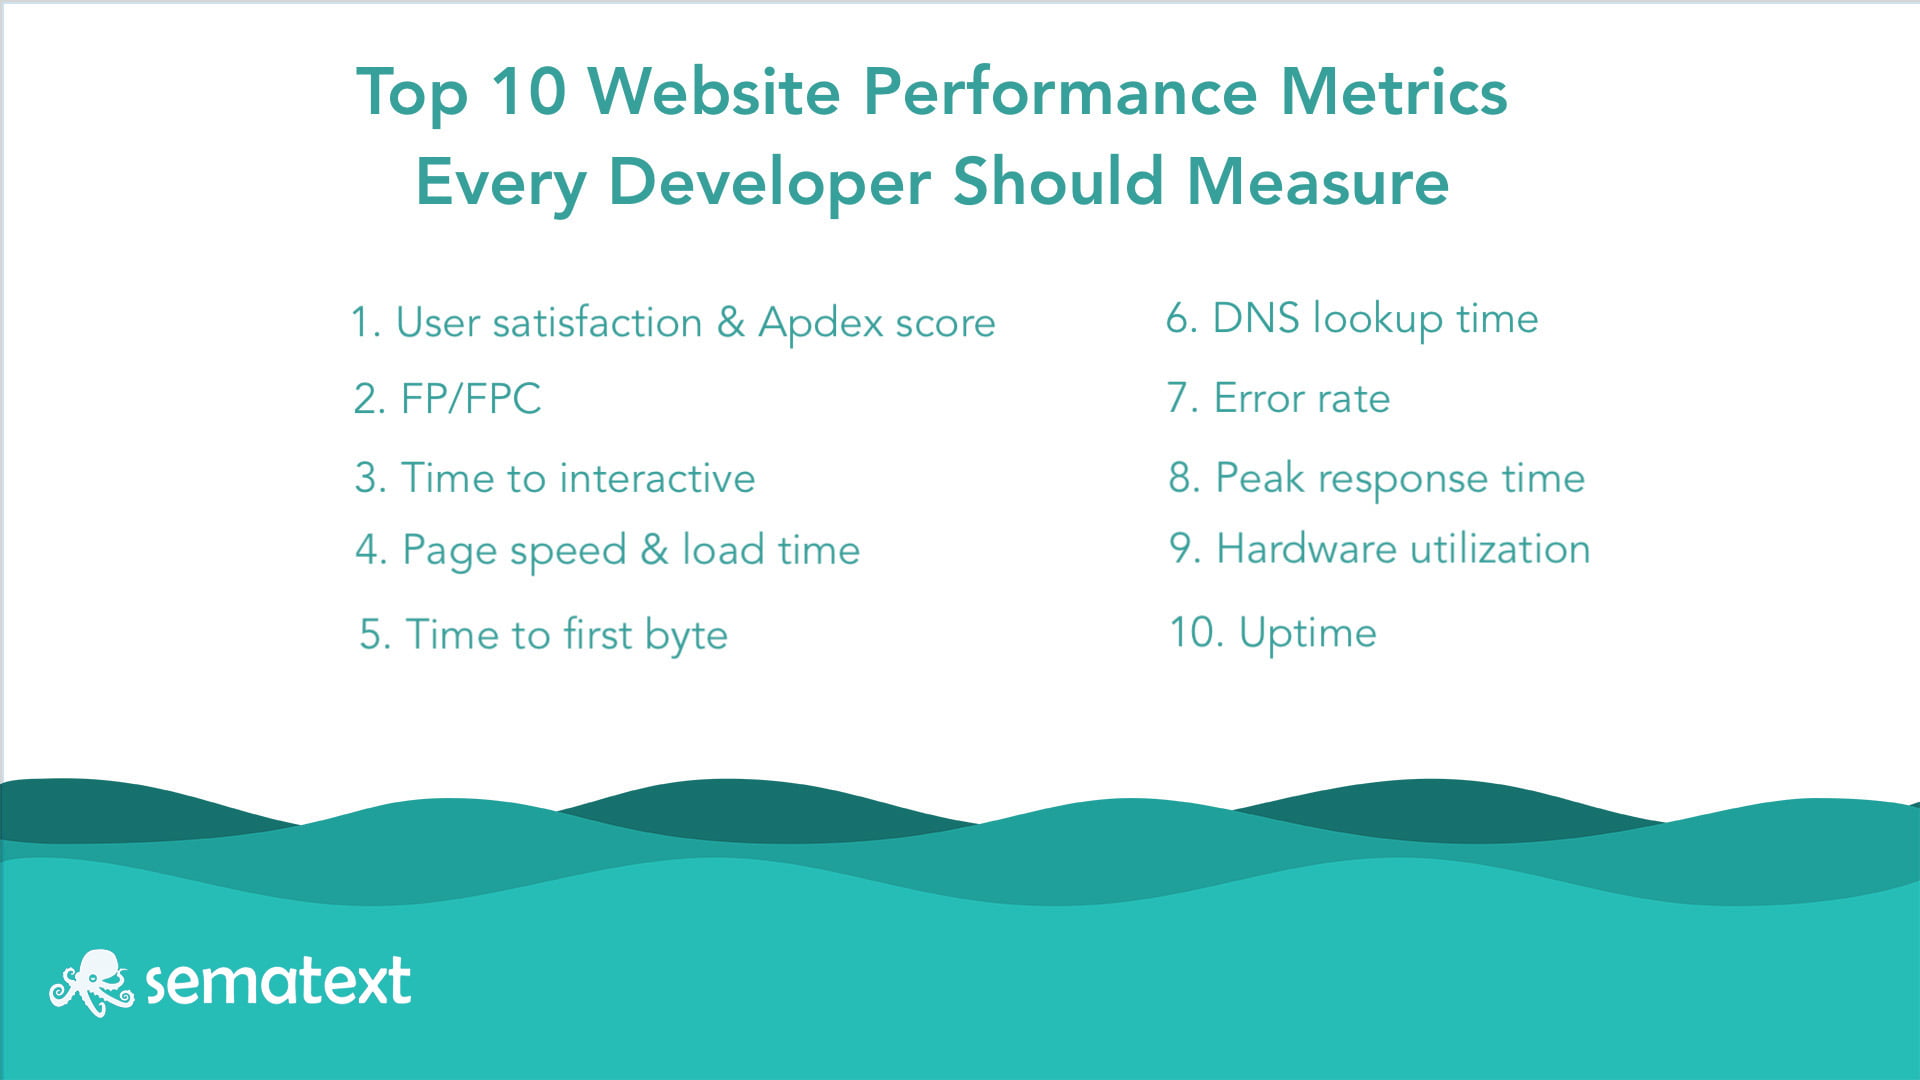
While simple websites are much easier to maintain and ensure peak performance, more complex web applications present a more difficult challenge when it comes to ensuring a smooth user experience on every level. To that end, I’ve compiled a list of some of the most important metrics that help measure website performance.
1. User satisfaction and Apdex
Let’s start with something easy. And while it does sound like such a simple thing, there are complex concepts that can elude even the most advanced developers.
User satisfaction, or Apdex, is a measurement of your users’ level of satisfaction based on the response time of request(s) when interacting with your website or application.
There’s a simple mathematical formula that will help you calculate the satisfaction index for your web app and it looks like this:

Where T is desired or defined latency of request (as defined by you)
Satisfied count is number of samples (or requests) that received a response in T or less
Tolerating count = number of samples (or requests) that are 4 times T or less
Total samples = Total number of requests used to calculate your Apdex score
You’ve undoubtedly had a conversation with a developer who told you that based on their tests “the app loads in 2.5 seconds”. This is neither here nor there since tests performed under controlled environments aren’t going to show you real world data. People around the world will have different load times and they’re going to experience the app in a very different way.
This is why the user satisfaction index is one of the most important metrics for website performance – it’s based on the feedback received from your users and it will provide insight into how they are using the application.
2. FP/ FCP
First Paint (FP) and First Contentful Paint (FCP) is a performance metric that refers to the first pixels that are getting rendered after the users access your website and how long it takes for the user to see them. The difference between the two is that FP is the point when the browsers draw anything on the page, while FCP is the point where browsers start displaying pieces of content like text or images.
The most important parts of the website need to load first and fast. Google describes these parts as First meaningful paint (FMP) or hero elements and they need to be the priority. Here are a few examples:
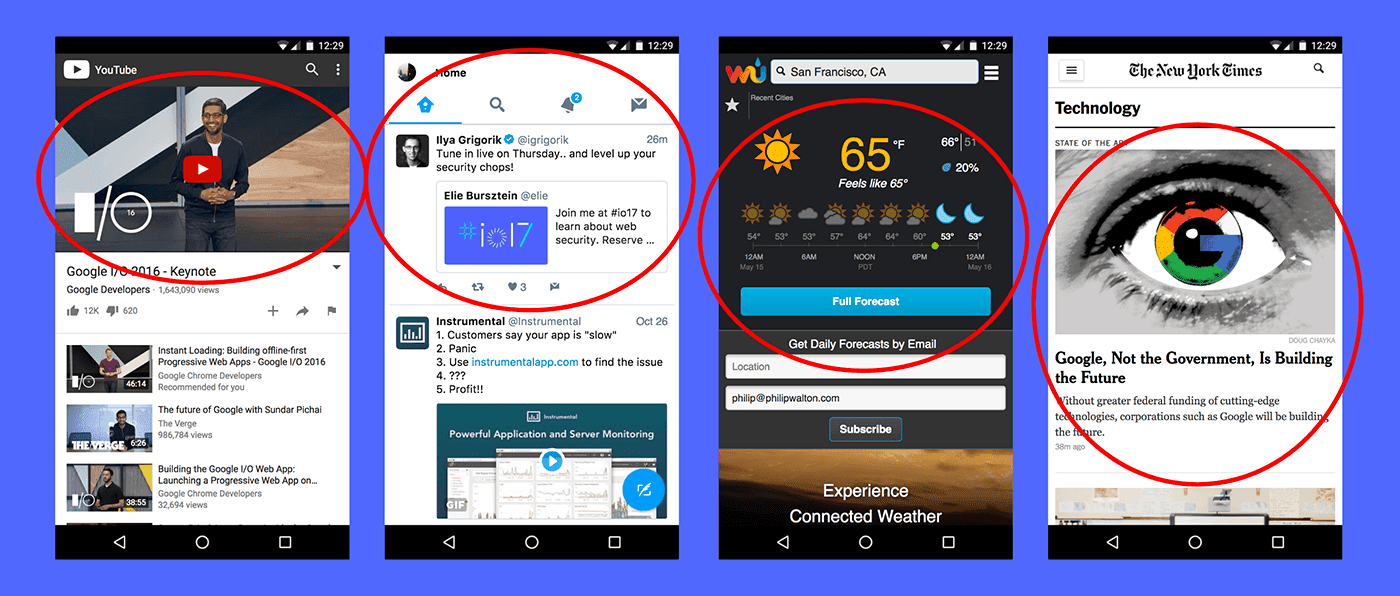
Source: www.web.dev
How to Improve FP and FCP
Optimizing the FP/FCP is done by removing any render-blocking scripts and CSS from the Head of your document. You then identify the minimal set of styles you need to display the first important bits of your site. Using HTTP/2 server push on your app can result in incredible first paint times and it’s definitely worth a shot.
Server push is basically the ability of the server to send you multiple files to a single client request. Think of it like this, when you load your index.html you will probably need more files to render that page, like stylesheets or javascript file. What Server push does is that it packages those necessary files into one response so by the time the DOM is parsed your stylesheets and javascript will have already been loaded.
Here’s an example for Go version 1.8 and above where the server knows that app.js is needed for the page to be rendered. Therefore,it’s configured to load it before a traditional request for the file has been made on the client side.
   http.HandleFunc("/", func(w http.ResponseWriter, r *http.Request) {
        if pusher, ok := w.(http.Pusher); ok {
            // Push is supported.
            if err := pusher.Push("/app.js", nil); err != nil {
                log.Printf("Failed to push: %v", err)
            }
        }
        // ...
    })
3. Time to interactive
The next thing you need to look for is the Time to Interactive (TTI) which measures the time until the application is rendered and can respond to user input.
Here’s a quick method to calculate your TTI:
- Start at First Contentful Paint (FCP).
- Search forward in time for a quiet window of at least five seconds, where quiet window is defined as: no long tasks and no more than two in-flight network GET requests.
- Search backwards for the last long task before the quiet window, stopping at FCP if no long tasks are found.
- TTI is the end time of the last long task before the quiet window (or the same value as FCP if no long tasks are found).
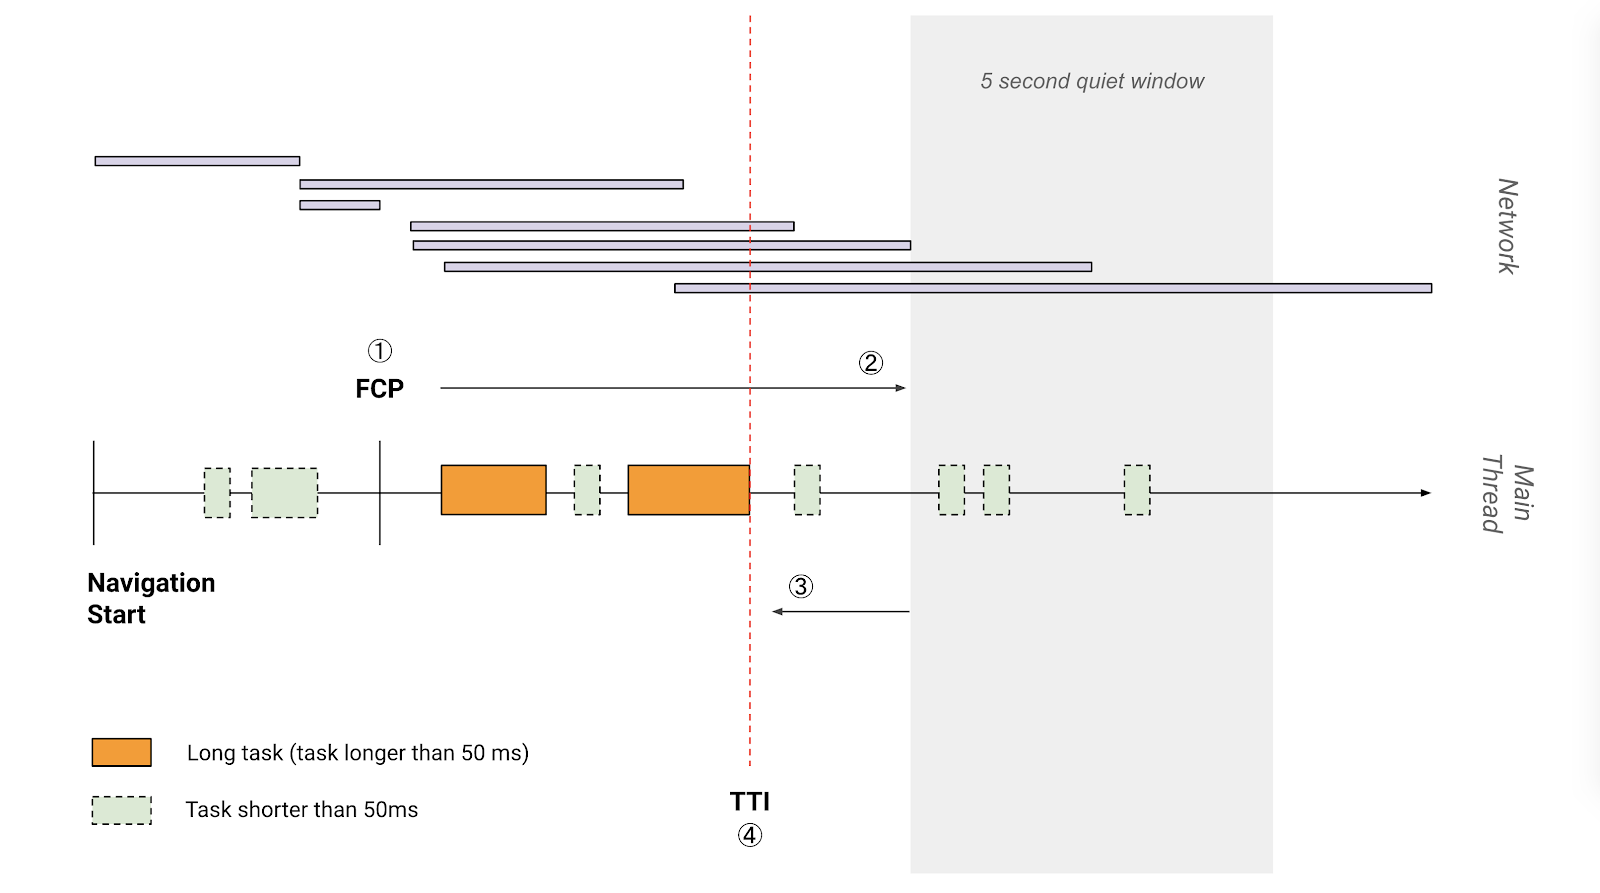
Source web.dev
How to Improve Your TTI score
TTI optimization can be as simple as only loading scripts that provide interactivity only to the elements that have been loaded already. While this sounds simple in theory having apps that have content loaded but not interactive is quite common.
Nevertheless, there are certain things you can do to lower your TTI.
- Minifying and compressing your code. It’s easy enough to do there’s really no cost involved.
- Using Preload. When we use preload in the link tag it makes an early fetch request to get the resource. Mostly used to fetch high-priority resources that are used in the current route.
- Minimize the main thread work. The main thread is what turns code into a visual, interactive web page. It creates the DOM, parses the CSS and HTML, and executes javascript. To reduce the load on the main thread you can remove unused code, minimize your code and use Code spliting to make sure you are only running the code you are actually needing.
4. Page speed and load time
I’m talking about the moment the document.readyState has a status of “complete”. Page speed measures the time it takes to download and display the entire content of a web page. Over time, the page speed threshold has changed and it differs based on what type of site or webapp we’re looking at. For an eCommerce website, the accepted load time is between 2 and 3 seconds.
With the modern internet speeds and powerful machines, 2 seconds load time is pretty easy to attain. The challenge is in doing it over mobile networks, especially 3G. This is where the actual webapp performance comes into play the most. You can’t use the same resources across all devices and expect the same result. The same website that loads in 2 seconds on your desktop is going to take up to 6 times longer on mobiles over 3G.
With proper tooling, you can check page load speed at any time on desktop as well as on mobile. If you’re looking for one, check out our review of the best website performance and speed testing tools.
5. Time to first byte
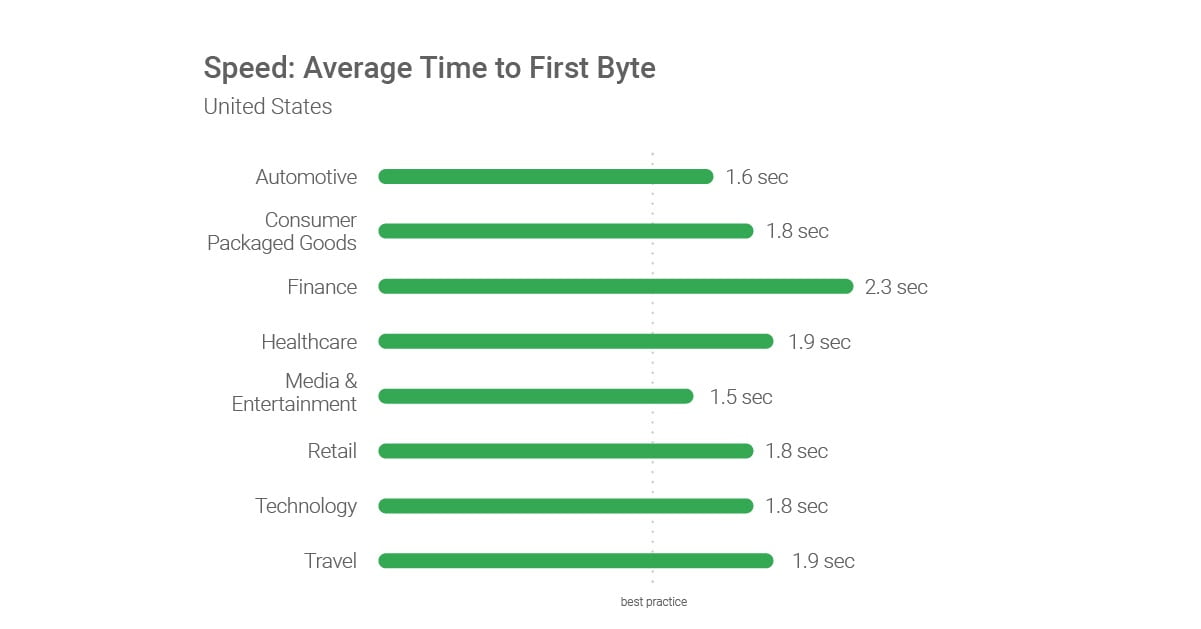
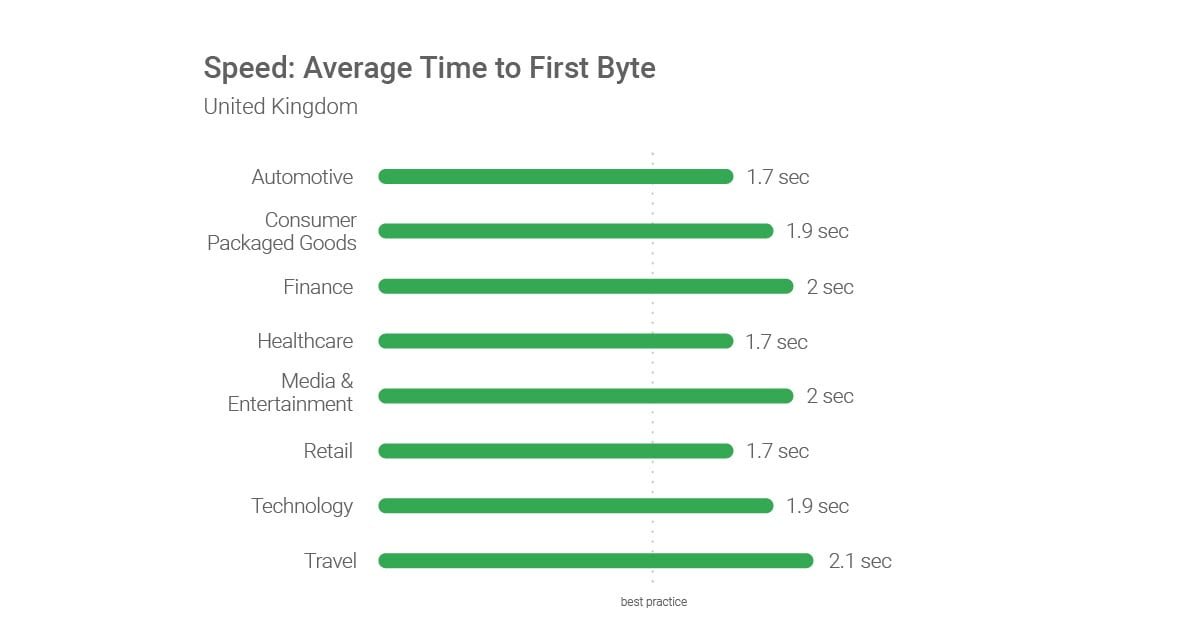
Furthermore, the speed at which the first bits of information reach your users is not consistent in all locations across the world. Your users from the United Kingdom will have a different experience than people in the United States.
To measure this we use a metric called Time to First Byte (TTFB) which is the time the first byte of each file reaches the user’s browser after a server connection has been established.
How to Improve TTFB
Not having a good TTFB is going to affect both your user experience as well as your SEO efforts, so the first thing that will come to mind is, ok, how do I improve these numbers and the answer is that you can improve your time to first byte but it’s not going to be an easy task. Nevertheless, here are a few things you can do in order to get that first byte loaded faster.
- Optimize your code. It seems like an obvious thing to say but one that gets looked over often. Things like load balancers, static caches, and dynamic content are a few of the best ways to go about getting a better-performing application but without having a proper monitoring solution, none of these will be of use since you won’t be able to see any bottlenecks in your system.
- Use a server that is suited for your needs. Having a high CPU and RAM usage all the time will inevitably degrade your TTFB. Sematext can provide real-time CPU and RAM usage and will help you optimize your resources.
- Use a content delivery network. A good CDN will help you deliver static content like images and scripts faster to the users via a network of servers all around the world. This will reduce the stability of the speed difference between users living in different parts of the world.
- Reduce queries. You’ll have to first check to see how many HTTP requests your website makes and remove the ones that aren’t critical. Reducing the number of images you load and combining your CSS files as well as making your asynchronous JS calls will speed get you a better TTFB all around.
6. DNS Lookup time
DNS Lookup time is the time it takes for a domain lookup to happen while the browser loads the resource. DNS lookups can add a significant amount of load time to your browsers especially if your app loads a large number of third-party scripts.
There are a large number of different DNS providers and it’s basically a matter of finding the right one for your needs. To help paint a clearer picture of the different DNS providers you can use this tool to check the top-performing ones.
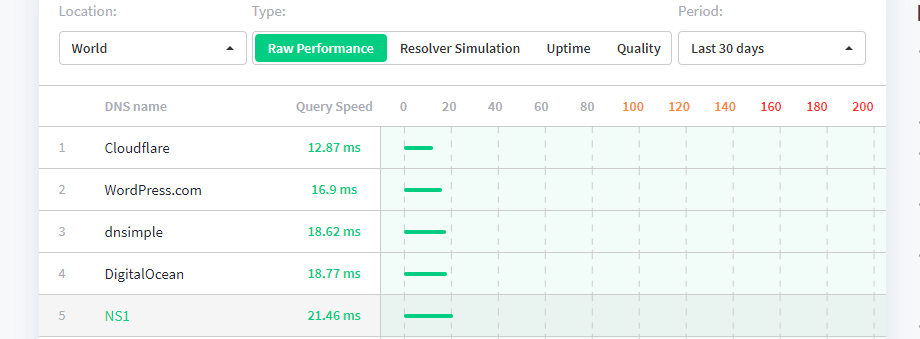
Here you can actually check the DNS speed of a specific site in real-time from 200+ locations all over the world.
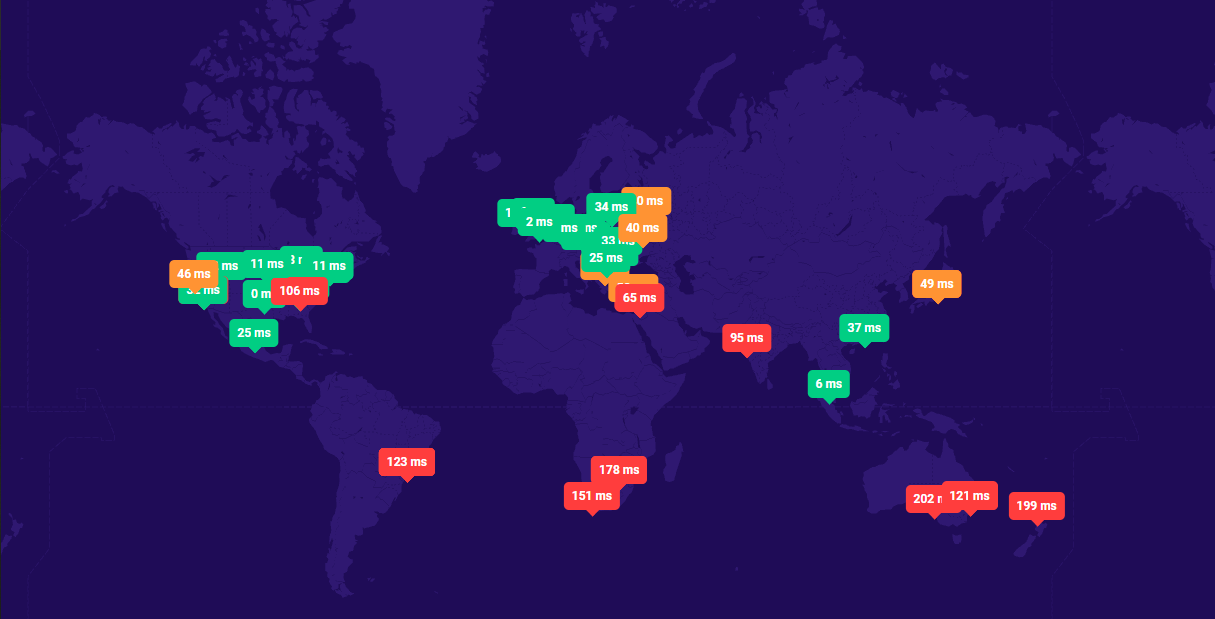
To optimize your DNS Lookup speed all you need to do is figure out which service will provide the biggest bang for your buck. If you are looking for a high-volume, programmable, authoritative name server using Google’s infrastructure, try Google’s Cloud DNS. Of course, Google is just one option among other services.
7. Error Rate
Error Rate is a performance metric that tracks the percentage of request issues you have in relation to the total number of requests. It’s important to keep an eye on this number as any spike will mean that you are looking at a major failure at some point soon in the future.
Errors can be the result of countless different things and there’s no good way to prevent them. The best thing to do is to make sure you get in front of them by closely monitoring your website or application using a real user monitoring tool.
8. Peak Response Time
Peak response time (PRT) measures the longest response time for all the requests coming through the server. It will give you an idea of where your web application is underperforming or having difficulties fulfilling requests and also help you pinpoint the culprit easier.
When working with third-party APIs it is important to monitor how APIs perform under load and what their response time is for users that are further away from you. You could be using the fastest CDN and have an app that scales gracefully, but if you are using an API to parse loaded profile pictures for users logging in that’s created only to serve people in the US, in an efficient way, all your users from Europe or Asia will have a pretty bad experience. If
9. Hardware utilization
You may be under the impression that hardware utilization does not fall under your responsibility and the hosting company or the service provider has to keep tabs on their machines themselves, but in reality, this is going to directly affect your website performance so keeping tabs on hardware is going to be a priority.
You have three main components to focus on:
- The CPU
- RAM Utilization
- Disk space
Any one of these components can create performance bottlenecks that can lead to catastrophic failures like shutting your entire server down.
10. Uptime
This is not a performance metric per se, but nonetheless, it’s a crucial aspect of your website or application. Remember that little number that you saw on your hosting company pricing page and it was around 99%? That decimal is extremely important and you really need to pay attention to it. Let me put things in perspective:
- 99%: means around 7 hours of downtime
- 99.9%: means around 45 minutes of downtime
- 99.999%: means around 30 seconds of downtime
If you’re on the market for a solution to keep downtime at a minimum, check out our article on website uptime monitoring software.
How to Measure Website Performance Metrics with RUM Tools
Webapp or website performance is not something you do once and then you forget about, but rather a continuous task that without the proper tooling will be close to impossible to accomplish. One way to analyze website performance metrics is by using real user monitoring tools, such as our Sematext Experience.
With Sematext Experience, you can monitor your Apdex score, optimize Single Page Applications (SPA), see underperforming resources, and dig deeper into individual user interactions with the website to get a more granular idea of how your app is performing and how visitors use your service. You’ll also be able to set alerts, creating a simple early warning system that will trigger whenever certain parameters are met. This way you’ll be able to take the necessary precautions to ensure peak performance and optimal user experience throughout the application.
If you’re new to real user monitoring, take a look at our real user monitoring guide where we cover everything from what is and how it works to benefits and use cases. Then you should move on to our other blog posts about RUM best practices, APM vs RUM, and synthetic monitoring vs real user monitoring. These resources should give you a better understanding of how real user monitoring can help improve website performance.
Final Word
At the end of the day, regardless of what type of industry you are in, you’ll be dealing with users that expect to interact with websites and applications quickly and easily. If you don’t prioritize measuring performance you’ll be risking your bottom line. So once you’ve decided on the right website monitoring tool for you, make sure you track these performance metrics, as well as other key UX metrics when setting up your monitoring strategy. It’s as simple as that.