If you’re a RabbitMQ user, chances are that you’ve seen queues growing beyond their normal size. This causes messages to get consumed long after they have been published. If you’re familiar with Kafka monitoring, you’ll call it consumer lag, but in RabbitMQ-land it’s often called queue length or queue depth.
In this post, we’ll look at a spike in queue size and go through the steps of troubleshooting it:
- Detecting the queue size spike in the first place
- Correlating queue length with other RabbitMQ metrics
- Correlating RabbitMQ logs with metrics to narrow down the root cause
- Fixing the problem 🙂
We’ll use Sematext Cloud‘s RabbitMQ monitoring integration for looking at RabbitMQ metrics and RabbitMQ logs, since we can get both in the same UI.
Gathering RabbitMQ metrics
RabbitMQ has a nice management plugin that can expose cluster-level, node-level and queue-level metrics. Sematext Cloud takes these metrics, along with host and container metrics such as CPU and network traffic, and allows you to see them over time on RabbitMQ performance dashboards and set up alerts. You’d install the agent in a few easy steps.
Once metrics start flowing, we have some predefined dashboards, all of which you can customize to your liking. Here’s a snippet of the default Overview dashboard during the queue length spike:

Correlating queue length with other RabbitMQ metrics
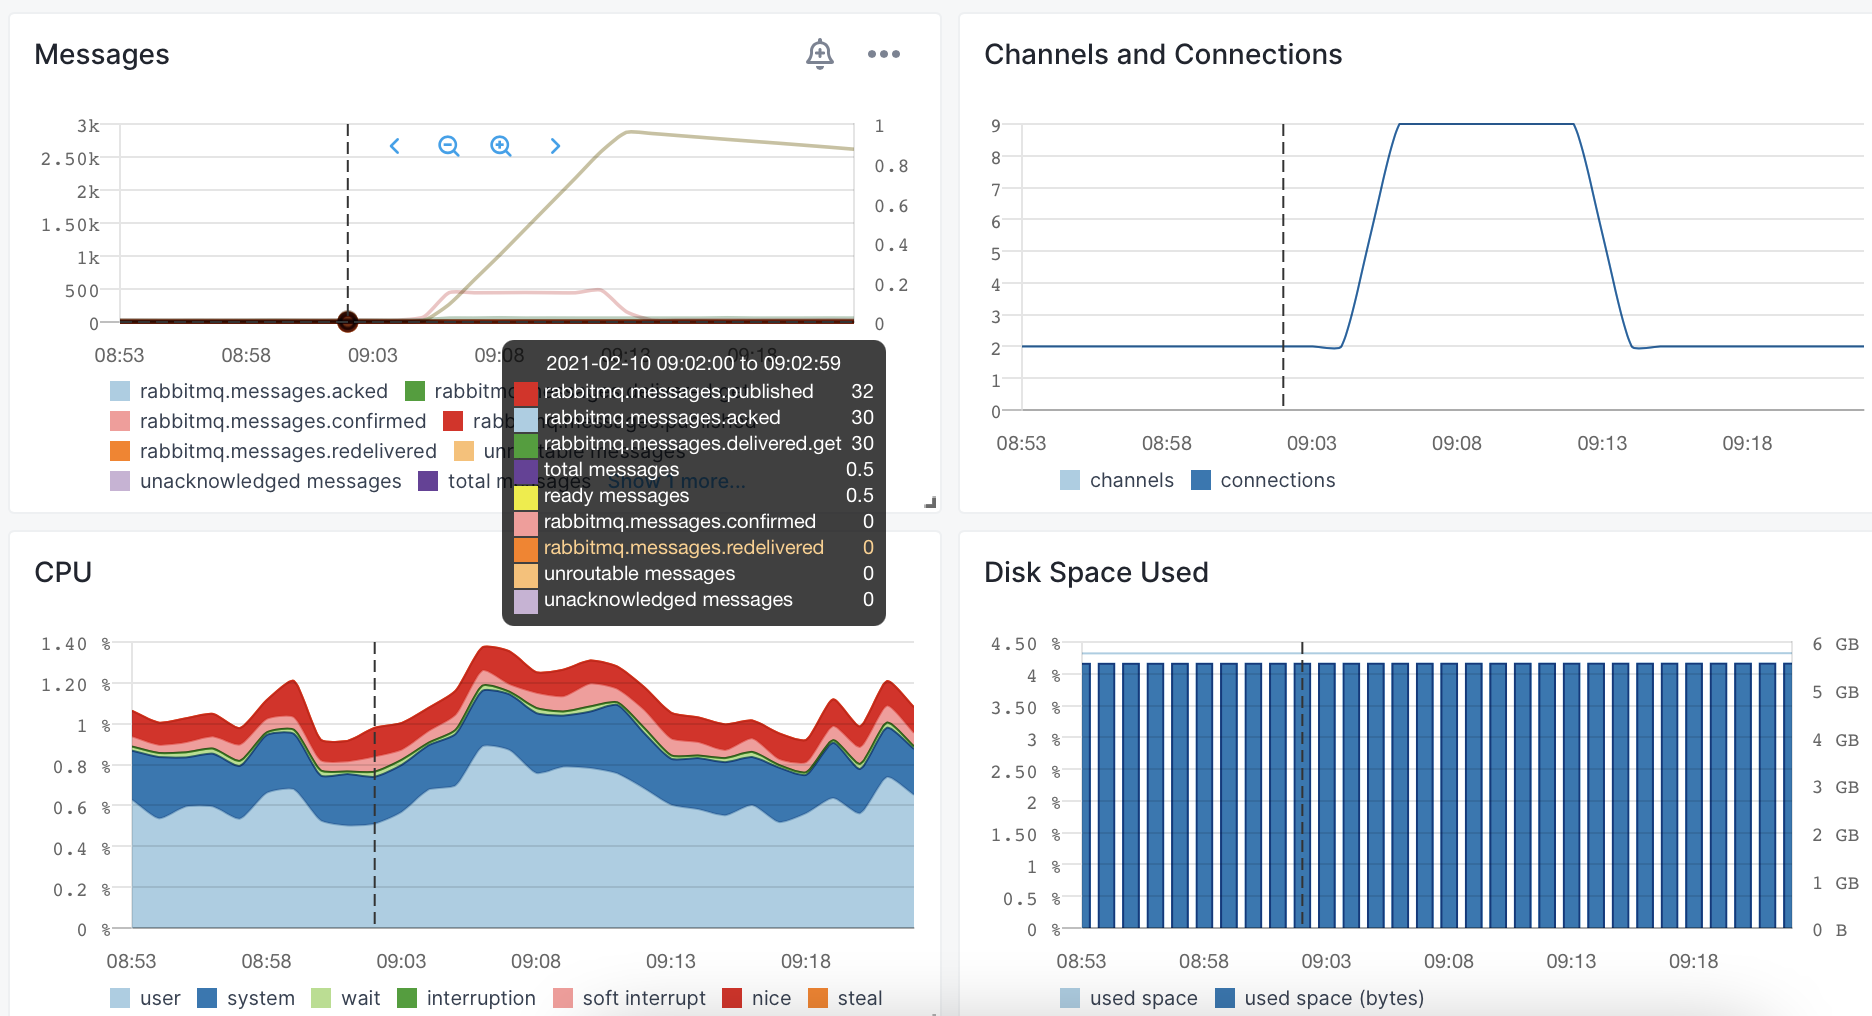
From the Overview dashboard, we already get a rough idea of what happened during the incident. There’s no queue to speak of before about 9:05 AM, when the spike begins. (clubdeportestolima) The number of ready messages (i.e. waiting to be consumed) is almost 0. That’s because there are roughly 30 messages published per minute, and all of them are usually delivered and acknowledged by the consumers.
We can also see that, during the whole time, CPU is very low: it’s unlikely that we’re limited by hardware on the RabbitMQ server. So let’s look closer at what happened during the spike:

Now the number of ready messages is growing, because we publish about 443 messages per minute, but we only consume 59. We also see an increase in the number of connections, so maybe more producers are publishing messages.
Finally, let’s check the message stats after the spike. This time I’ve only selected the metrics we’re interested in: messages published, delivered, acknowledged and ready.

We’re back to publishing about 30 messages per minute, as we did before the spike. We still consume 59 messages per minute, which is likely our consumer capacity. That’s why the queue is draining, but slowly. The number of connections dropped to the initial level.
To troubleshoot further, let’s see where these extra connections come from.
Note: you may ask yourself “What if the number of connections didn’t increase? Can I still detect the source of extra traffic?”. You can, if you route different kinds of traffic to different queues. Then you can break down message stats per queue in Sematext Cloud (or per broker, or per vhost), to narrow down the suspects.
Correlating RabbitMQ logs with metrics
Sematext Cloud’s RabbitMQ monitoring integration has a sister logs integration. The concept is the same: you follow a few instructions to install the agent, then logs are centralized so you can explore them with predefined or custom dashboards. You can also set up alerts and anomaly detection on logs, as you do with metrics.
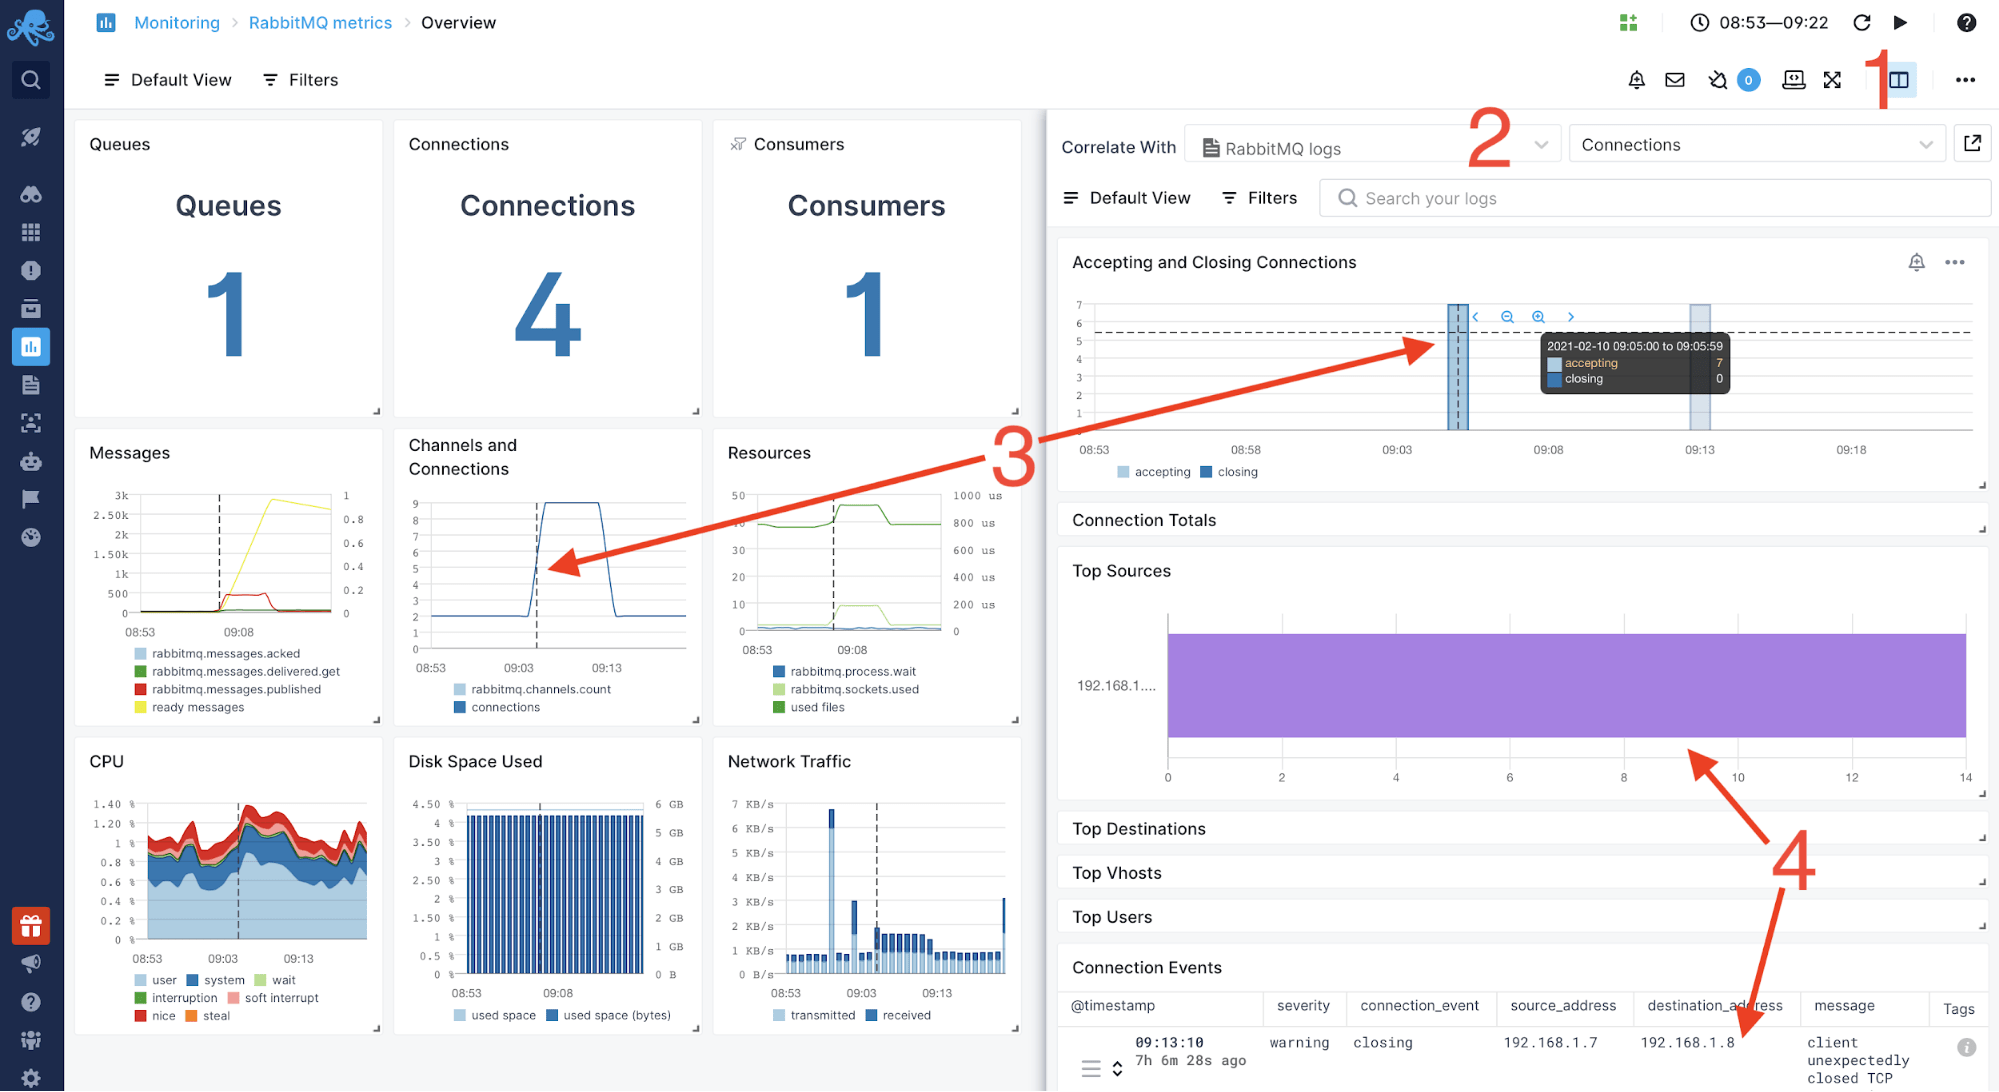
For troubleshooting this issue, we can bring logs in the same timeframe with metrics with Split Screen. Here’s how it may look like:

The following steps are annotated on the screenshot:
- Click on the Split Screen button. This allows you to bring another dashboard in this context.
- Select the App (in this case, a RabbitMQ logs App) and the dashboard. There’s a predefined Connections dashboard, which is precisely what we need here but there are others for e.g. authentication or startup & shutdown.
- If we correlate using the crosshair, we can see that we have new connections accepted when the issue starts, which are closed when the issue ends.
- Looking at the Top Sources widget, we can see that all new connections come from the same IP. We can see the IP by hovering the mouse over the widget or in the logs below: 192.178.1.7
Fixing the issue
If these extra producers are unwanted (e.g. test environment producers connecting to production RabbitMQ), we can shut them down and/or make sure they can’t authenticate. Setting up alerts on authentication logs in Sematext Cloud is also a good idea.
In most cases, such spikes are natural, coming from outside spikes like Black Friday. You should make sure consumer throughput can cope with all reasonable spikes. This can be done in a few ways:
- Optimize consumers for performance, if possible. For example, by sending acknowledgements asynchronously (basic.consume does that by default).
- Add more consumers. In the process, make sure you keep an eye on RabbitMQ metrics to make sure that brokers don’t become a bottleneck
- Parallelize work within the same consumer, if the task per message can be parallelized. You may not want to parallelize by fetching multiple messages from the same queue: each message requires its own acknowledgement, so you might just want to use multiple consumers.
Conclusion
There are three possible causes for large queues:
- Too many messages produced, usually by accident or because of a bug.
- Consumers don’t have enough capacity.
- Brokers can’t handle the throughput.
In all cases, monitoring RabbitMQ metrics and RabbitMQ logs will help you identify the root cause. With Sematext’s RabbitMQ integration, you can easily sift through node, queue, host, and container metrics as well as RabbitMQ logs. Start your Sematext Cloud trial now and let us know what you think!
If you’re interested to see how Sematext compares to similar monitoring solutions, check out our article on the best RabbitMQ monitoring tools.