While Kubernetes revolutionized distributed orchestration, it also added complexity to logging and monitoring. You need to adapt your monitoring strategy to keep up with the challenges of working with Kubernetes clusters.
This includes changing the tools you use.
To help keep your Kubernetes environment healthy, we made a list of the best Kubernetes monitoring tools. This list includes both open-source and commercial.
Due to the complex nature of Kubernetes, we included solutions with various functionalities – some tackle Kubernetes metrics, others just logs; some are Kubernetes-native, others general-purpose; and some act as data collectors, while others as the interface.
1. Sematext
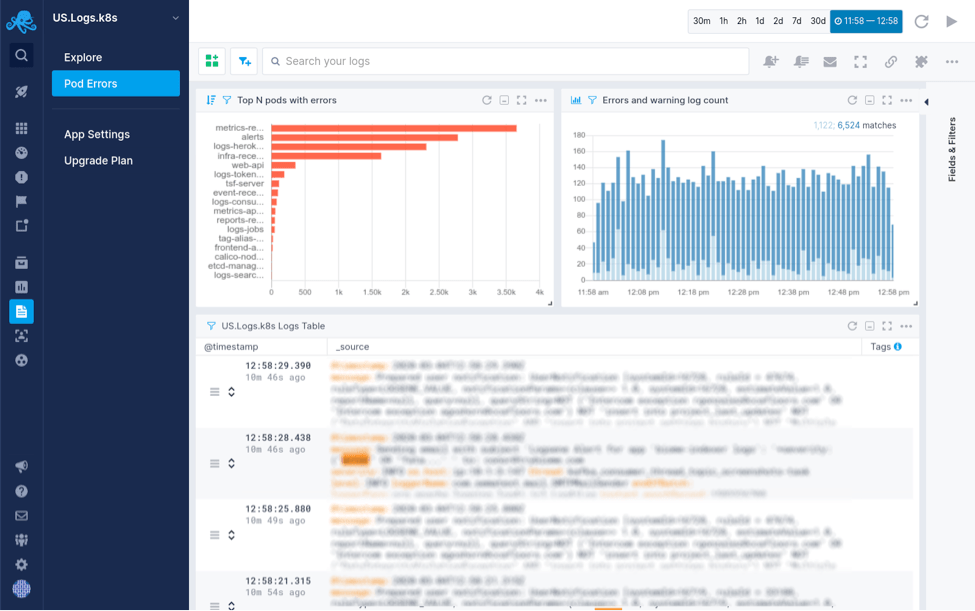
Sematext Monitoring is a monitoring solution for both traditional and microservice-based applications deployed on Kubernetes. It captures metrics and events in real time. From here, you can structure, visualize, and analyze this data. Set up alerts and notifications on the metrics that matter most to you.
Sematext Monitoring is part of Sematext Cloud, a cloud monitoring solution that takes care of both Kubernetes monitoring and logging without running any storage or monitoring infrastructure yourself.
Sematext is fully customizable. You can set your own alert rules on both logs and metrics, build log analytics reports, and customize your own monitoring dashboards. When an alert gets triggered, you can send notifications through email, Slack, or any other notification hook of your choosing.
This flexibility and visibility make pointing out problematic Kubernetes pods much faster and easier than using traditional monitoring or command-line tools.
To get started, you need to install the Sematext Agent. It’s available as a Helm chart, DaemonSet, or Kubernetes Operator. Setup commands for each are literally copy-paste, and really easy to get running.
With Sematext Discovery:
- Continuously discover and monitor your containerized applications
- Set up their performance monitoring and log monitoring directly from the UI.
- No need to install anything else.
As your services scale up and down, or shift across containers and hosts, Discovery looks for services you are monitoring to ensure that containerized applications are automatically monitored as they come online.
There is also a Kubernetes Audit integration with a number of out-of-the-box reports, charts, and alerts to save you time.
Pros:
- Easy to install
- Auto-discovery finds services and logs and monitors them without installing anything
- Built-in alerting and anomaly detection
- Default monitoring dashboards and alert rules to save time
- Offered as SaaS, no infrastructure to manage
- Great Price
Check out how comprehensive Sematext’s Kubernetes monitoring is in the short video below:
[youtube_video]https://www.youtube.com/watch?v=5bJF5HX6u40[/youtube_video]
[product_banner type=”kubernetes”]Effortlessly monitor your entire Kubernetes infrastructure in minutes.[/product_banner]
2. Kubernetes Dashboard
Kubernetes Dashboard is a web-based UI add-on for Kubernetes clusters. It provides a simple way to manage, troubleshoot and monitor your environment. You can use the Kubernetes Dashboard to see basic metrics related to memory and CPU usage statistics across all of your nodes and to monitor the health of workloads (pods, deployments, replica sets, cron jobs, etc.)
You can easily install the Kubernetes Dashboard with ready-to-use YAML files.
Pros:
- Easy to install
- Part of the Kubernetes ecosystem
Cons:
- Limited features
3. Prometheus
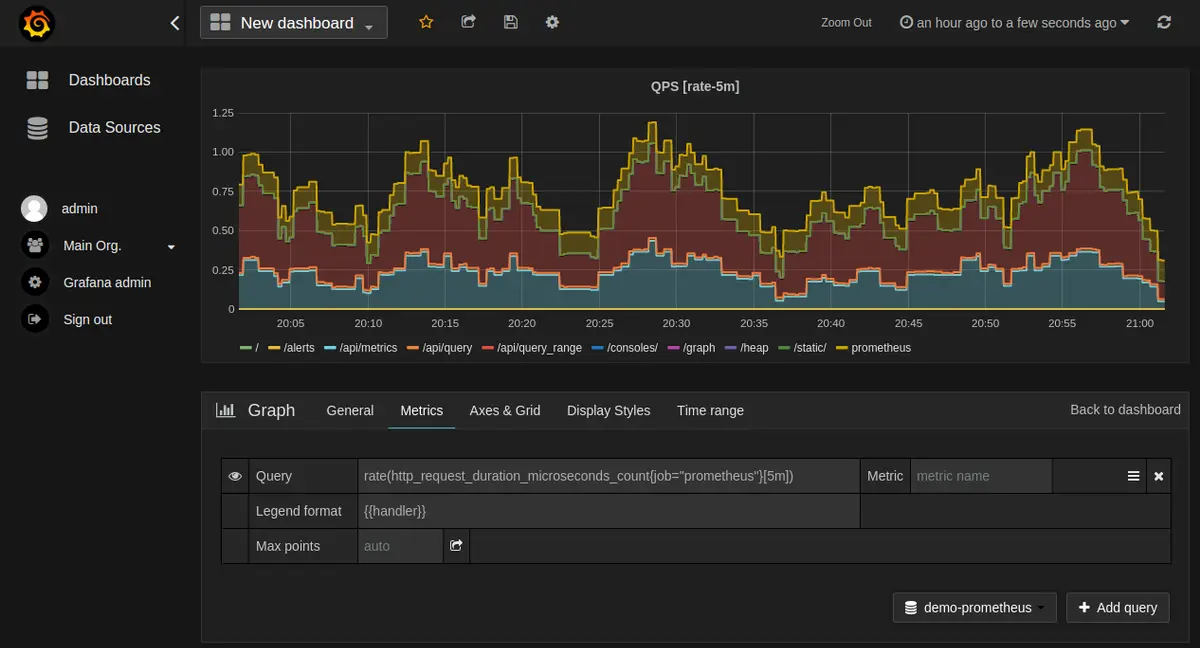
Prometheus is one of the most popular open-source tools used to monitor Kubernetes. It was developed by SoundCloud and donated to the CNCF (Cloud Native Computing Foundation).
What’s different about Prometheus compared to other time-series databases – such as Cassandra, Graphite, and InfluxDB – is that it has a simple yet powerful multidimensional data model and its flexible query language (PromQL). Furthermore, it follows a pull model rather than a push and has built-in real-time alerting mechanisms. Finally, being open-source, it gathered a large community interested in helping and bringing innovation.
Prometheus has no built-in dashboard, so you’ll need to use a separate visualization tool. Users opt for Grafana.
You can easily run Prometheus on top of Kubernetes by using the Prometheus Operator.
Pros:
- Built-in monitoring and alerting
- Functional and reliable during outages
- Kubernetes-native, easy to use
- Integrates well with Grafana
- Large community
Cons:
- No built-in long-term storage
- No dashboards
- No authentication/authorization
- No anomaly detection
- Doesn’t handle logs or traces, only metrics
- Challenges at scale
4. Grafana
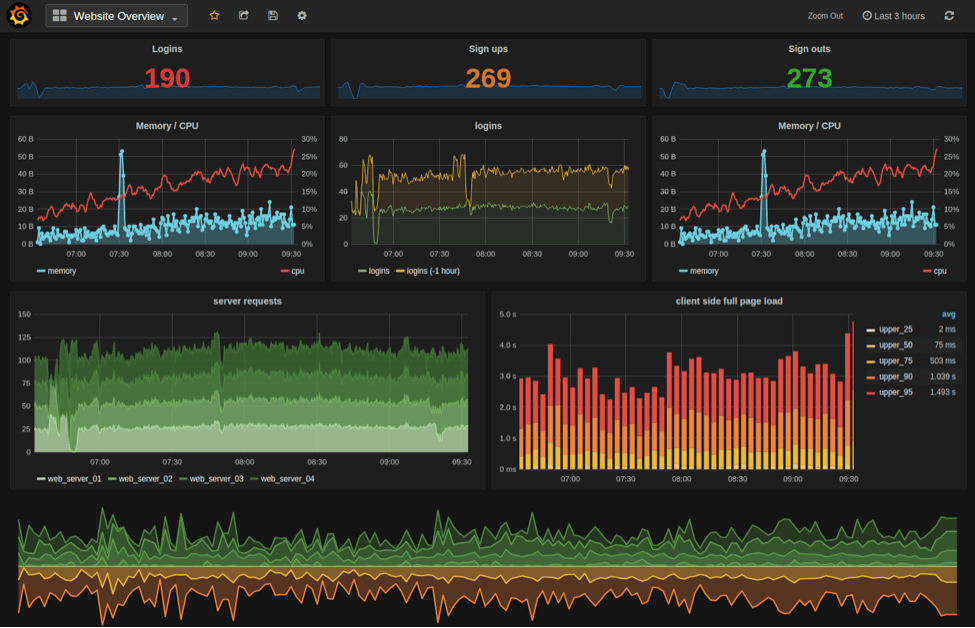
Grafana is an open-source solution used for monitoring, metrics, data visualization, and analysis.
Compared to other visualization tools, Grafana stands out because it connects with a long list of databases. When used to monitor Kubernetes, Grafana usually sits on top of Prometheus, but it’s also popular in combination with InfluxDB or Graphite. You can build comprehensive monitoring dashboards with a wide variety of graphs, from heatmaps to line graphs, bar graphs, histograms or Geo maps. And, you can already find a lot of ready-to-use Kubernetes monitoring dashboards.
Grafana also features a built-in alerting system, along with filtering capabilities, annotations, data-source-specific querying, authentication and authorization, cross-organizational collaboration, and many more.
Grafana is easy to set up and use. It’s popular in the Kubernetes community and some deployment configuration files include a Grafana container by default.
Pros:
- Includes support for Elasticsearch and Prometheus
- Broad compatibility with various data sources
- Great reporting and visualization functions
- Active developer community
- Alerting capabilities
- Can query several entities at a time
Cons:
- Not customized for Kubernetes log management
5. Datadog
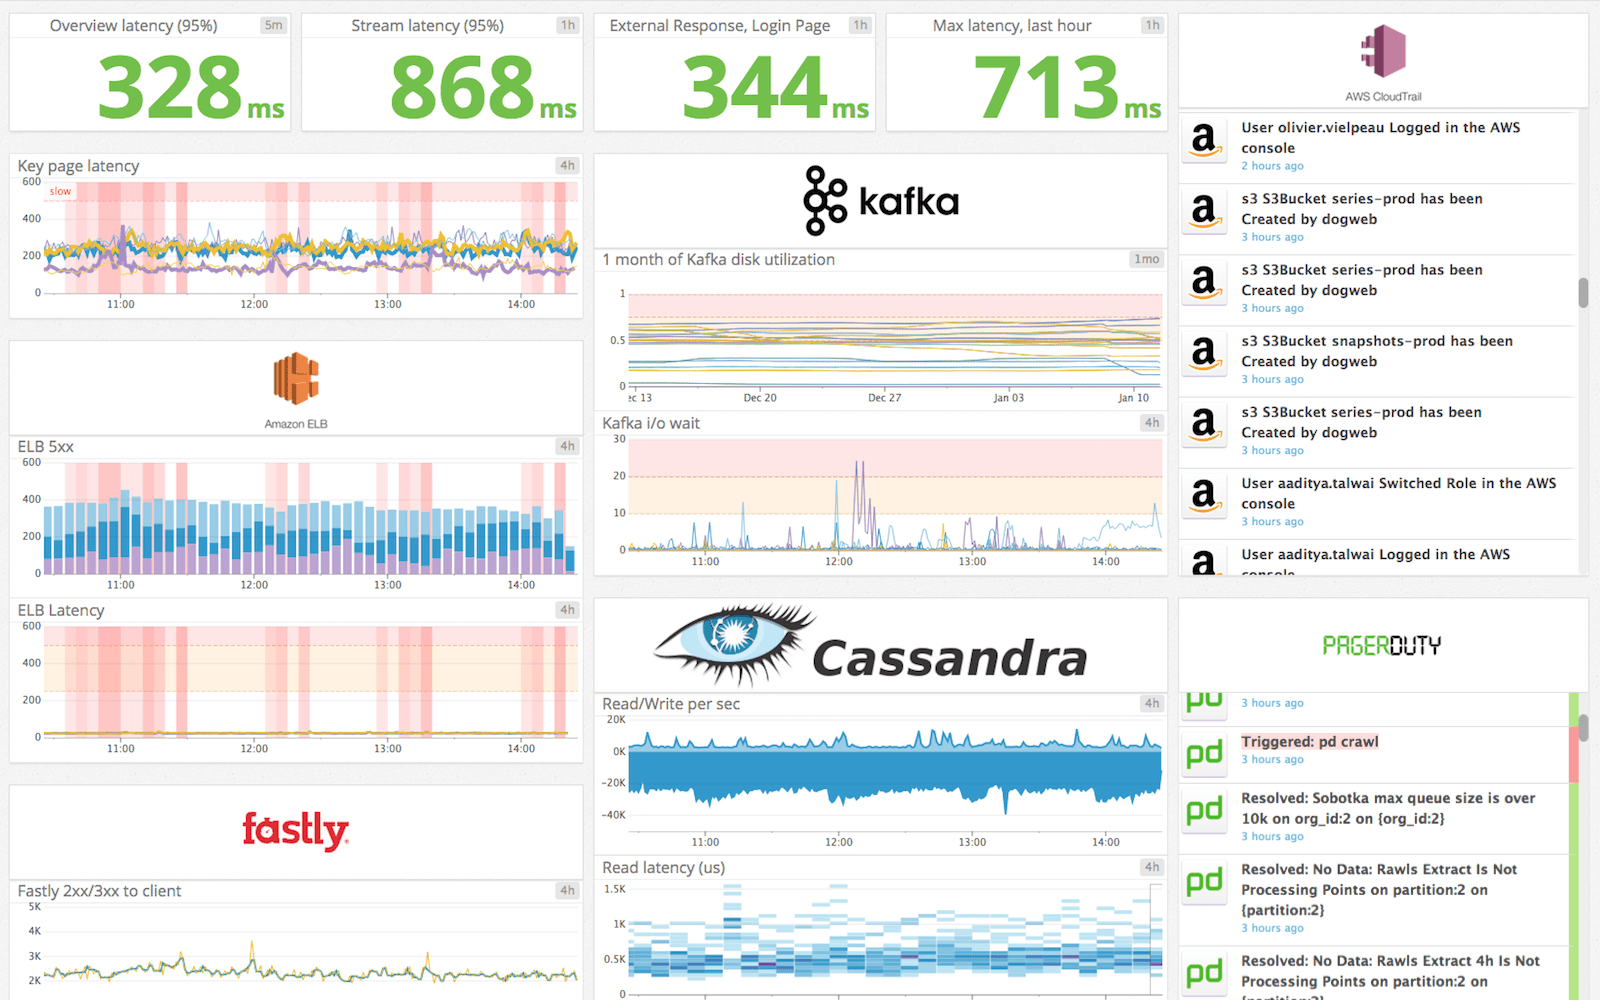
Datadog is an APM solution that enables you to extract logs, metrics, events, and service states from Kubernetes in real-time. It enables you to monitor, troubleshoot, and optimize application performance.
Datadog features dashboards and high-resolution metrics and events for manipulation and graphing. You can also set up alerts and receive notifications on various channels, including Slack and PagerDuty.
The Datadog Agent is easy to install. You can run it using a DaemonSet that will be deployed to every cluster node.
With the Datadog Agent successfully deployed, resource metrics and events will start coming into Datadog. You can view the data in the built-in Kubernetes dashboard that Datadog provides.
Pros:
- Easy to install
- Great APM integration
Cons:
- Confusing logs integrations
- Limited plans (only 1)
- Expensive
Want to see how Sematext stacks up? Check out our page on Sematext vs Datadog. You should also know about the other top alternatives to Datadog.
6. New Relic
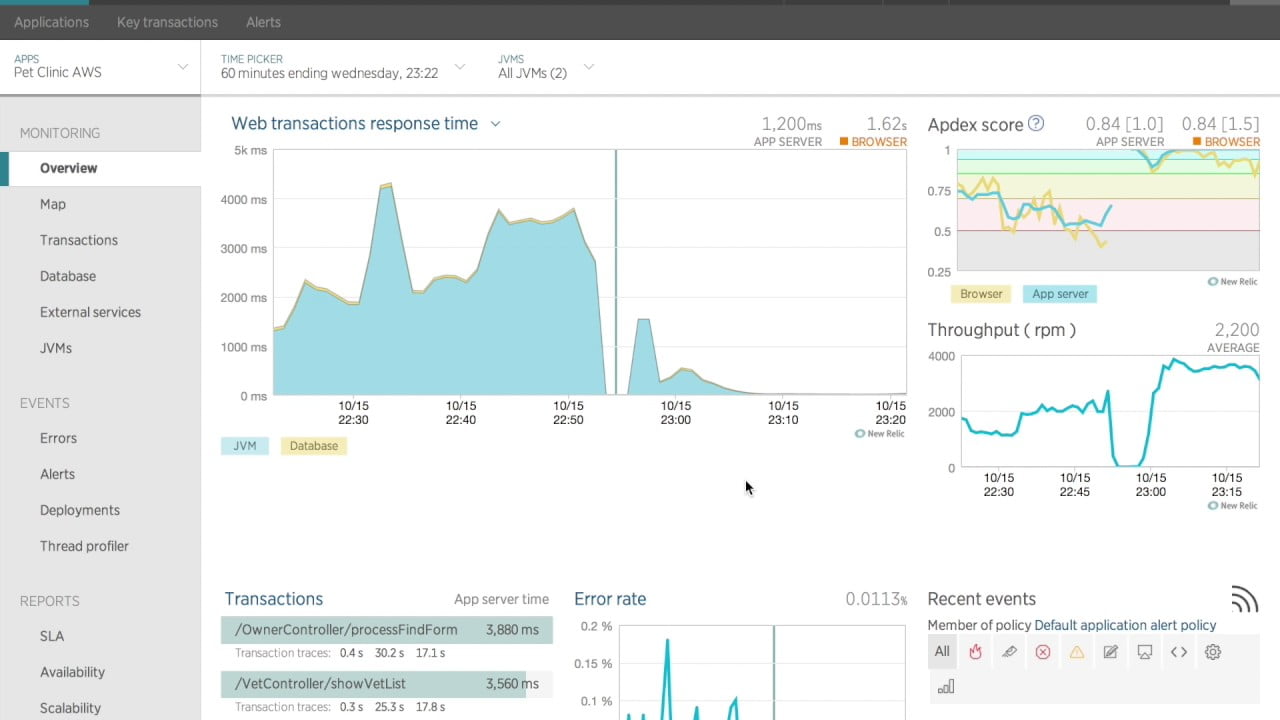
New Relic is a monitoring tool that features Kubernetes integration, giving you an overview of your servers, hosts, applications, and services. You can capture data and metadata for nodes, pods, containers, deployments, replica sets, and namespaces. It also features powerful searching capabilities, as well as tag-driven alerting and dashboarding.
You get a cluster explorer that provides a multi-dimensional representation of a Kubernetes cluster. Drill down into Kubernetes data and metadata in pre-built dashboards. Teams can use cluster explorer to quickly troubleshoot failures, bottlenecks, and other abnormal behavior across their Kubernetes environments.
The New Relic Kubernetes integration monitors and tracks aggregated core and memory usage across all nodes in your cluster. This allows you to meet resource requirements for optimal application performance.
Pros:
- Cluster health visualization
- Integration with APM
Cons:
- Confusing onboarding
- Expensive, pricing by both usage and the number of users
- UI feels very outdated
Want to see how Sematext stacks up? Check out our page on Sematext vs New Relic.
7. Jaeger
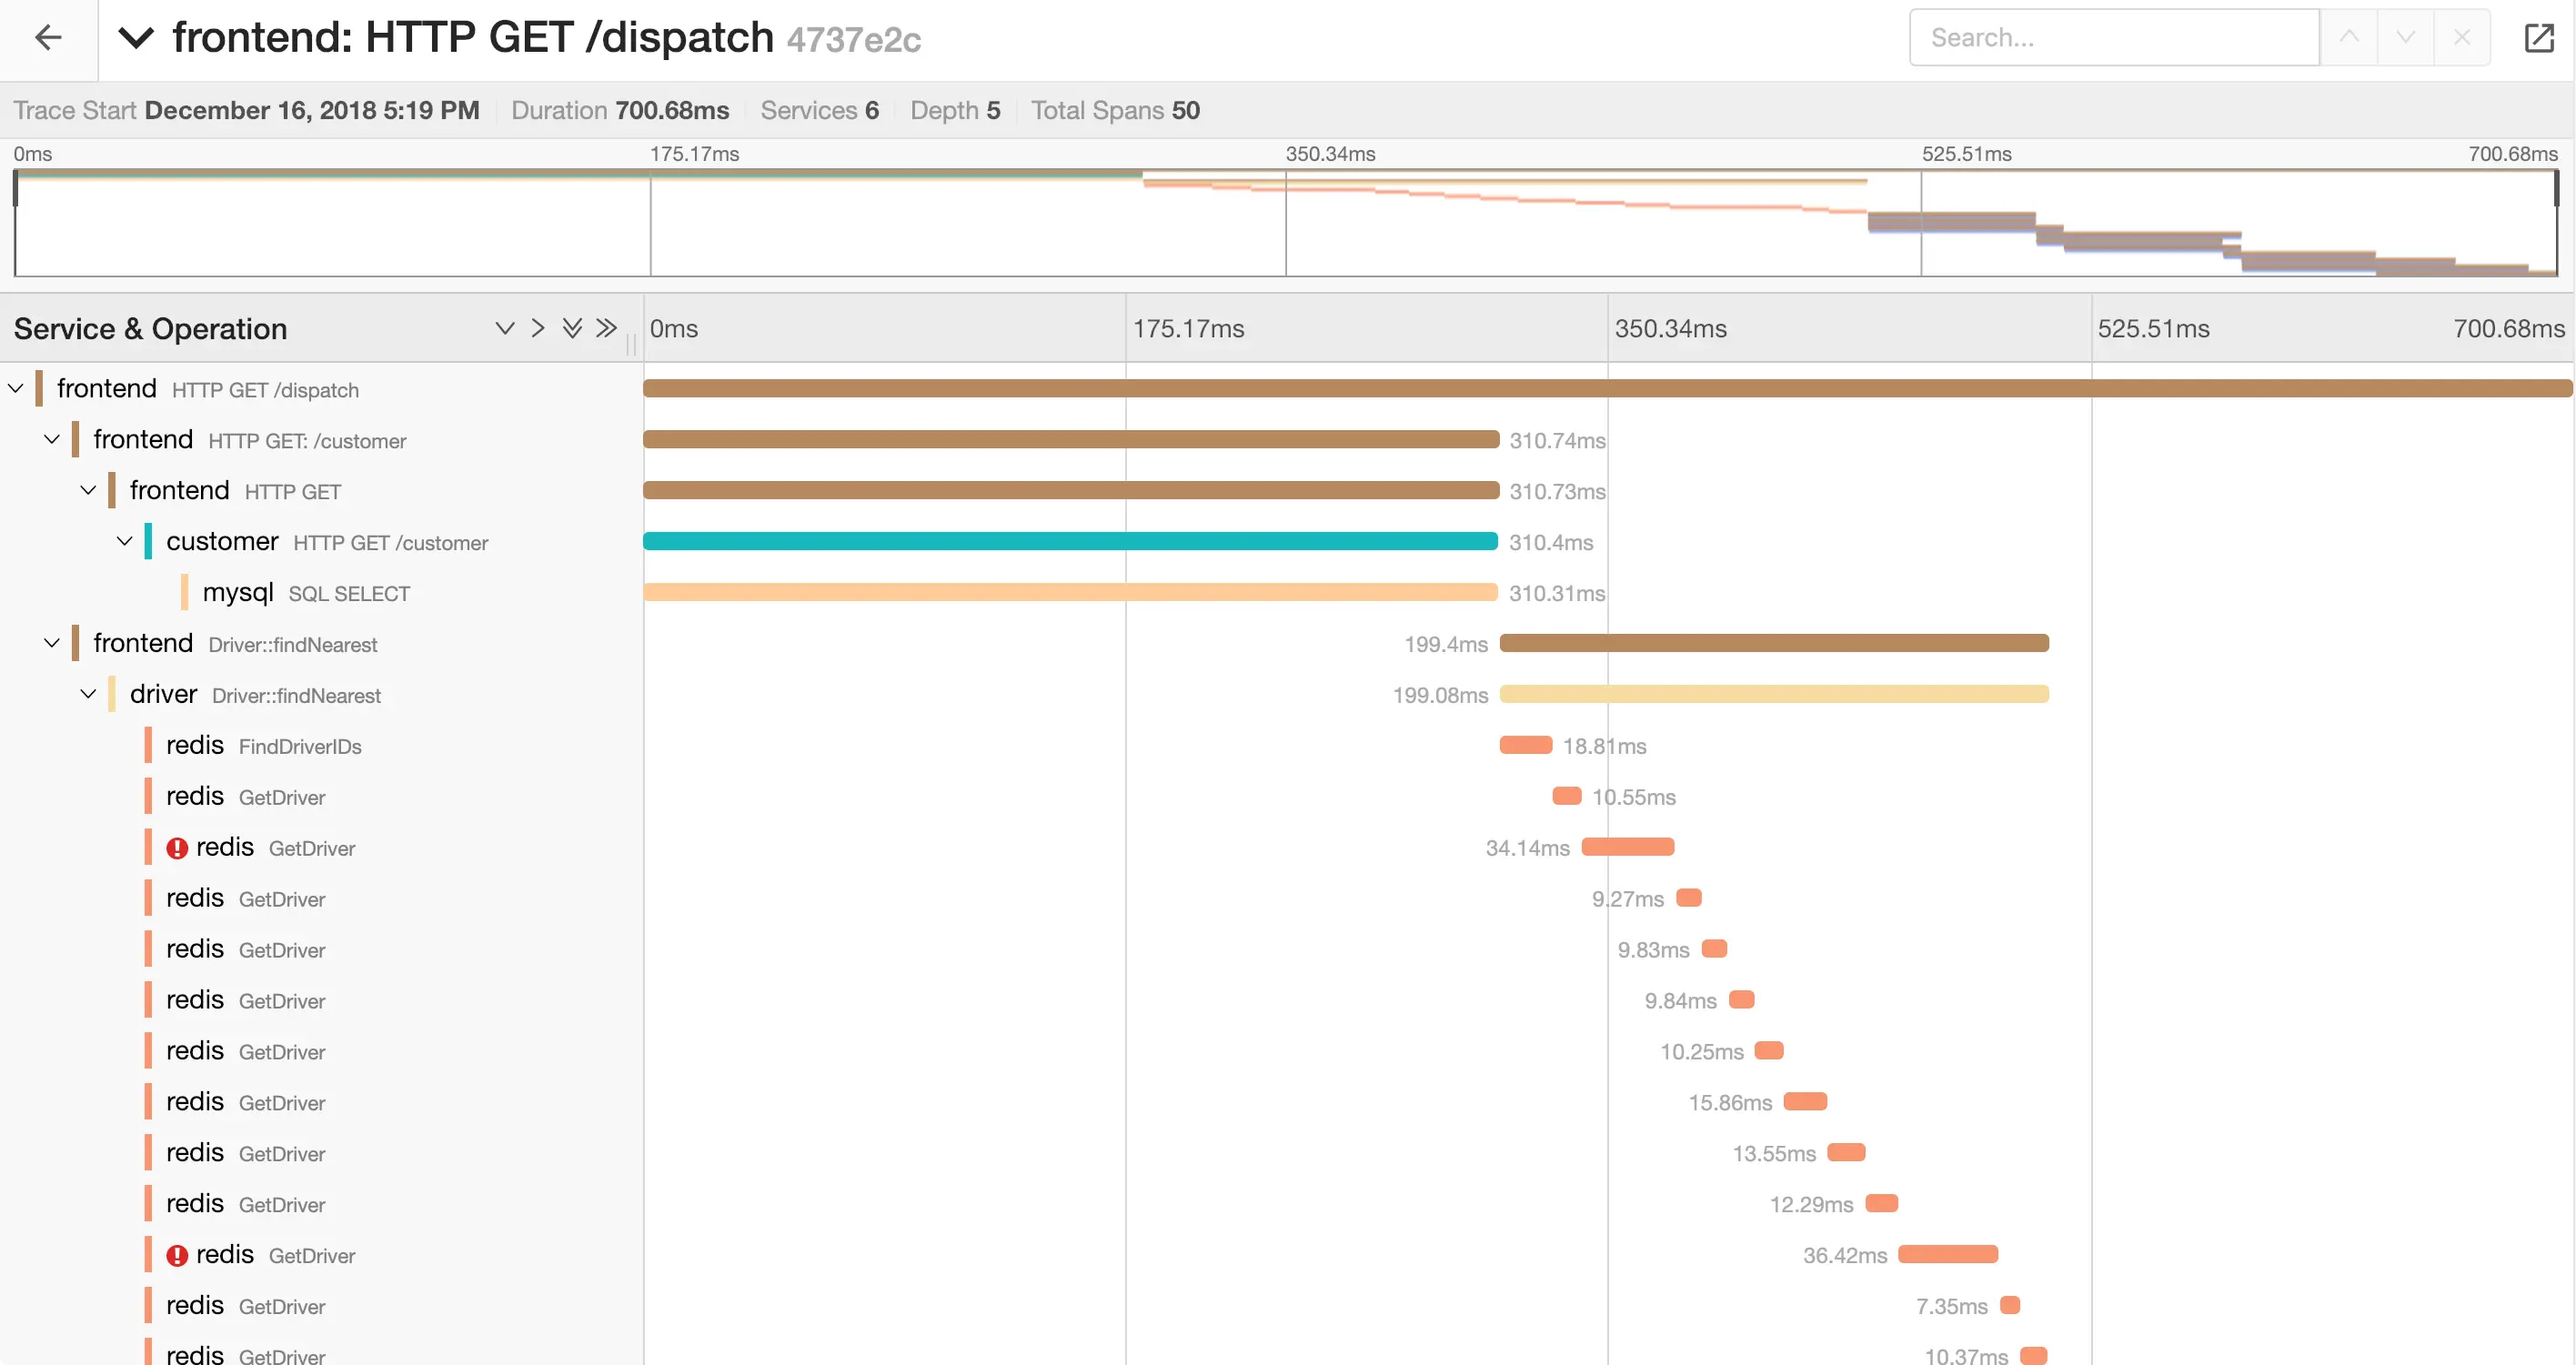
Jaeger is a free tracing tool used for monitoring and troubleshooting in complex distributed systems, including Kubernetes environments. It was released by Uber Technologies and open-sourced in 2016.
With Jaeger, users can perform root cause analysis, distributed transaction monitoring, distributed context propagations, service dependency analysis, and performance and latency optimization.
Jaeger features OpenTelemetry-based support for Java, Node, Python, Go, and C++ and for various data sources, including Cassandra, Elasticsearch, Kafka, and memory.
Learn more: How to use Jaeger as a distributed tracing system.
To deploy Jaeger, you can use the Jaeger Operator or a DaemonSet configuration.
Pros:
- Various instrumentation options
- Easy to deploy
- Modern user interface
Cons:
- Limited backend integration
8. Elastic Stack (ELK)
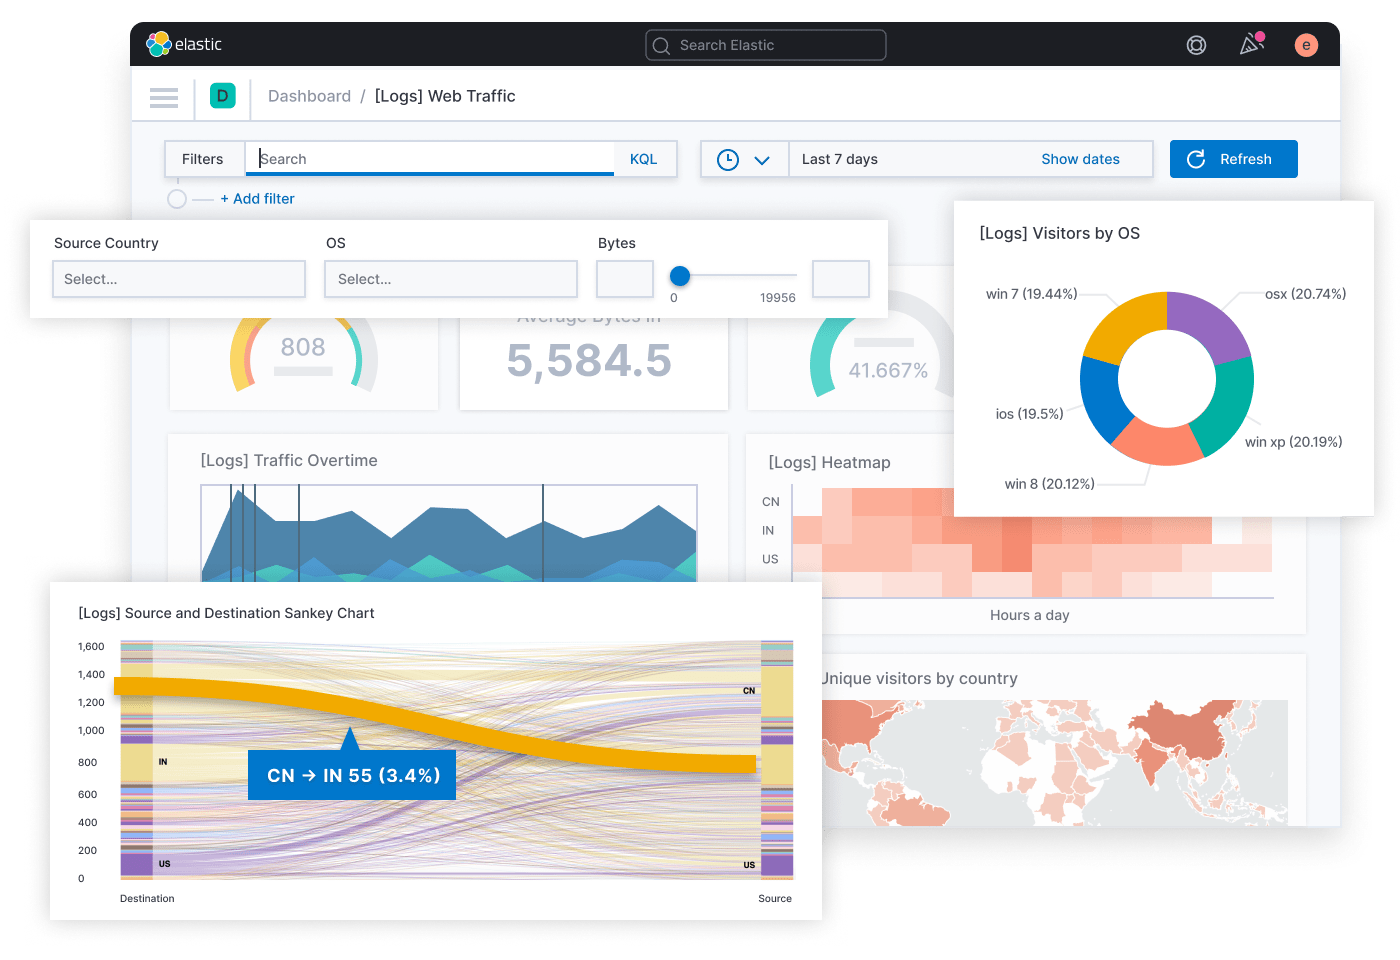
The ELK stack is among the most popular open-source log management solutions, including for Kubernetes. But it can easily be used – and it is used by many – for monitoring purposes too.
It’s a collection of four tools that ensure an end-to-end logging pipeline. Elasticsearch is a full-text search and analytics engine where you can store Kubernetes logs. Logstash is a log aggregator that captures and processes logs before shipping them to Elasticsearch. Kibana provides reporting and visualization functionalities. And finally, Beats are lightweight data shippers used to send logs and metrics to Elasticsearch.
ELK comes equipped with Kubernetes and Docker monitoring beats with auto-discovery. The Beats collect Kubernetes and Docker logs, Docker metrics, and metadata, thus helping you monitor performance at the application and system levels.
Pros:
- Rich analytics capabilities
- Easy to deploy and run in Kubernetes environment
- Large community
Cons:
- Operating at scale requires a lot of expertise
Want to see how Sematext stacks up? Check out our page on Sematext vs ELK.
9. Dynatrace
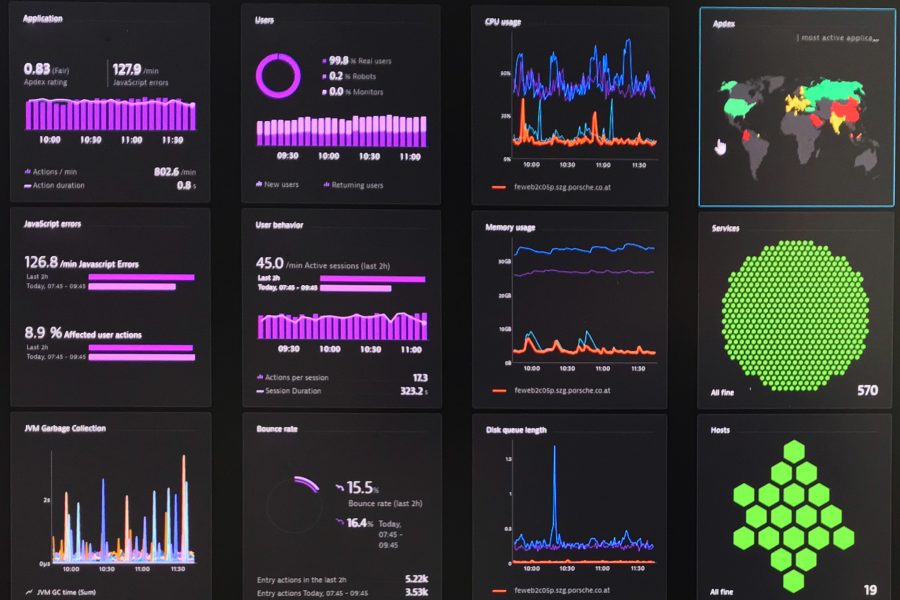
Dynatrace monitors native Kubernetes and managed services like OpenShift, EKS, AKS, GKE, IBM IKS, etc.
Your cloud platform, container runtime or service mesh layer does not matter, neither does it matter if you are running thousands of nodes or just a few. Dynatrace makes monitoring your Kubernetes infrastructure and workloads simple.
By deploying and managing the Dynatrace OneAgent Operator, OneAgent becomes a native, first-class citizen of the platform. It will track the availability, health, and resource utilization of your Kubernetes cluster.
Pros:
- Easy to install
- Great APM integration
Cons:
- Steep learning curve
- Expensive
Since you will need to consider more than Kubernetes monitoring, we have compiled a comparative list of the best alternatives to Dynatrace that you should consider.
Want to see how Sematext stacks up, specifically? Check out our page on Sematext vs Dynatrace.
10. cAdvisor
Container Advisor, officially called cAdvisor, gives you insight and understanding into the resource usage and performance characteristics of running containers. It is a running daemon that collects, aggregates, processes, and exports information about running containers.
It keeps resource isolation parameters, historical resource usage, histograms of complete historical resource usage, and network statistics for each running container. This data is exported both on the container and machine level.
For Kubernetes users, cAdvisor can be run as a DaemonSet.
Pros:
- cAdvisor is an open-source container resource usage collector.
- Native support for Docker containers with support for other container types.
- cAdvisor operates per node. It auto-discovers all containers in the given node and collects CPU, memory, filesystem, and network usage statistics.
- Supports exporting stats to various storage plugins like Elasticsearch, InfluxDB etc.
- Exposes raw and processed stats via a versioned remote REST API
Cons:
- Collects only basic resource utilization
- Doesn’t offer any long-term storage, trending, or analysis capabilities.
- Captures only metrics, not logs, traces, or events
11. Kubewatch
Kubewatch is a Kubernetes watcher that publishes notifications to available collaboration hubs/notification channels. You run it in your Kubernetes cluster and get event notifications through webhooks.
Once the Kubewatch pod is running, you will start seeing Kubernetes events in your configured Slack channel or any other webhook you configured.
Pros:
- Simple setup
- Instant notifications to preferred locations
Cons:
- It only watches basic events
- Doesn’t offer any long-term storage, trending, or analysis capabilities.
12. Kube-state-metrics
The Kubernetes API server exposes data about the count, health, and availability of pods, nodes, and other Kubernetes objects. The kube-state-metrics add-on makes it easier to consume these metrics and helps surface issues with cluster infrastructure, resource constraints, or pod scheduling.
How do kube-state metrics work? It listens to the Kubernetes API and generates metrics about the state of Kubernetes objects. These include node status, node capacities like CPU and memory, number of desired/available/unavailable/updated Kubernetes replicas per Deployment, and different pod statuses, e.g., waiting, running, ready, and so on.
Once you deploy kube-state metrics to your cluster, it provides a vast array of metrics in text format on an HTTP endpoint. These metrics can be easily consumed by any monitoring system that can collect Prometheus metrics.
Pros:
- Simple setup
- Compatible with Prometheus
Cons:
- It only watches basic Kubernetes API metrics
- Doesn’t offer any long-term storage, trending, or analysis capabilities.
13. Sensu
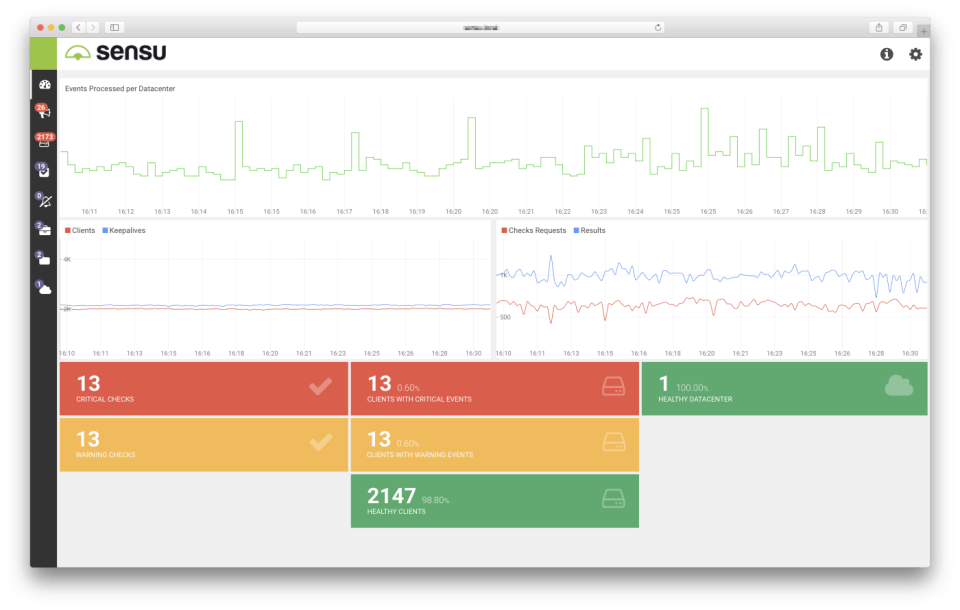
Sensu offers an end-to-end observability pipeline where you can collect, filter, and transform monitoring events and send them to the database of your choosing.
Sensu can be run in your Kubernetes cluster side-by-side with Prometheus to get the most out of both solutions. You can also run it natively without Prometheus.
However, Sensu works best when deployed as a DaemonSet alongside Prometheus, since exporting application-level metrics to Prometheus requires loading the Prometheus SDK to your application codebase and exposing a metrics endpoint. The endpoint is then scraped and stored in the Prometheus Server.
This can be tiresome. Sensu avoids this complexity by using a sidecar concept. A Sensu agent is deployed alongside your application. The agent constantly collects and exposes metrics to the Prometheus server without you having to change the application codebase.
The metrics you get include system metrics, including CPU, memory, and disk usage, as well as custom application metrics and logs that you can then send to a database of your choosing.
Pros:
- Simple setup
- Compatible with Prometheus
- Cluster health visualization
Cons:
- Very basic GUI interface
- Weak out-of-the-box dashboards
14. Zabbix
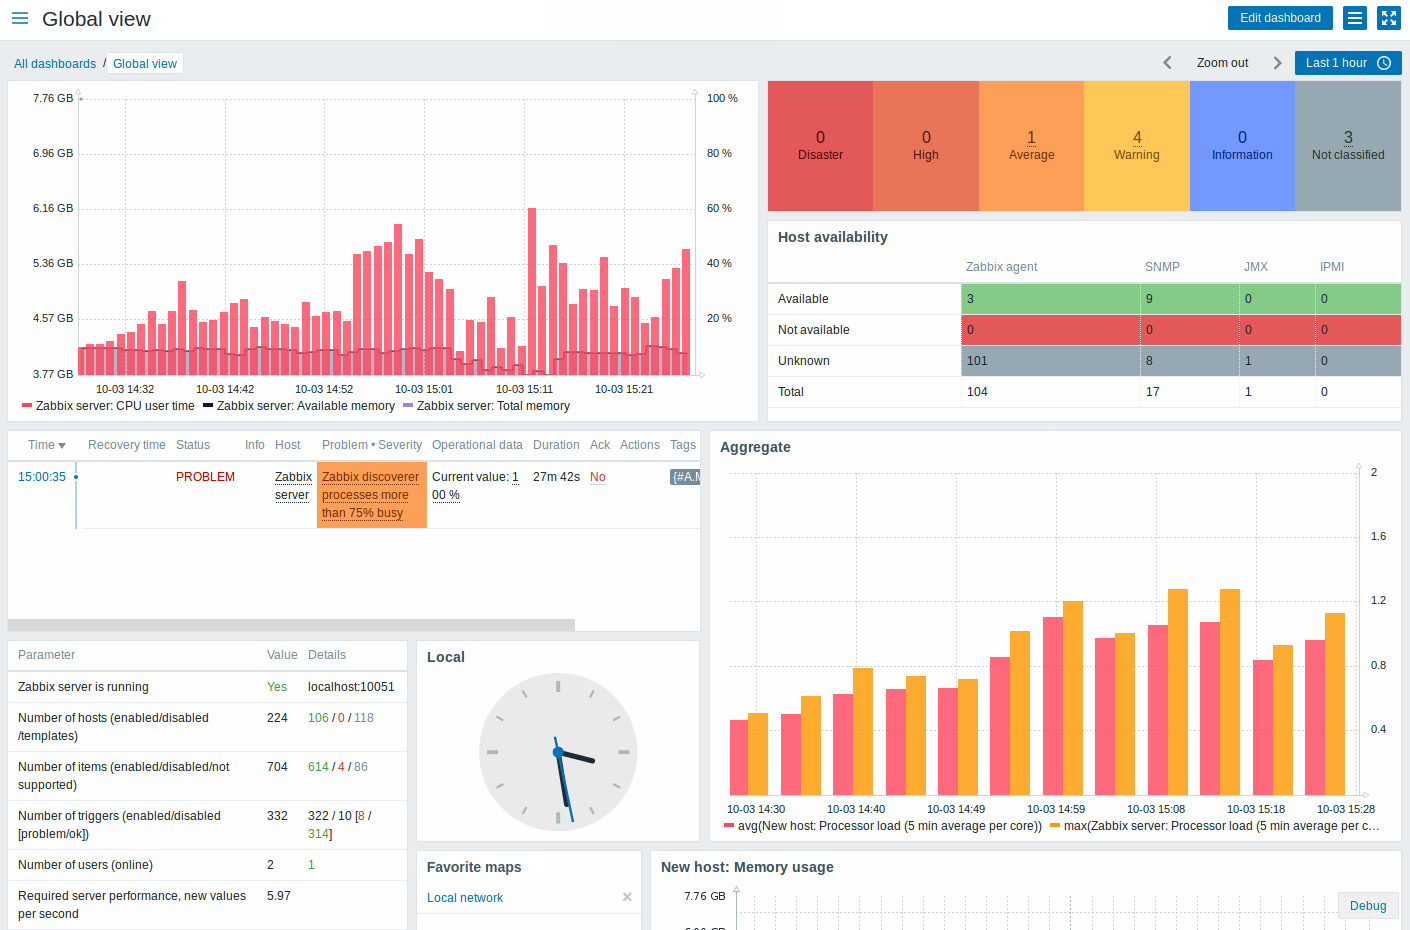
Zabbix is an open-source monitoring solution that’s designed to keep tabs on how networks, servers, applications, and IT infrastructure are running – checking their performance, availability, and overall health. It provides a versatile, adaptable monitoring platform that fits nicely in all sorts of settings, whether you’re running a small business or a big enterprise.
Although Zabbix isn’t primarily intended for Kubernetes monitoring, it’s pretty flexible and can be tweaked to keep an eye on containerized setups. If you want to use it with Kubernetes, you can do so by setting up Zabbix agents on your Kubernetes nodes or by crafting your own scripts and templates to fetch metrics from Kubernetes APIs and its various components.
Pros:
- Versatile
- Auto-discovery
- Supports distributed monitoring
Cons:
- Lackluster interface
- Tedious to set up alerts
- Steep learning curve
What Tool Will You Use to Monitor Your Kubernetes Cluster?
Choosing a tool depends on your monitoring needs and use case.
[product_banner type=”kubernetes”]Effortlessly monitor your entire Kubernetes infrastructure in minutes.[/product_banner]
When you first jump into the Kubernetes ecosystem you’ll most likely always bump into CNCF projects and you tend to always try them first. You can run such tools in your own cluster and manage it by yourself if you have the resources. They have the advantage of being backed up by large, active communities driven to improve existing solutions so you’ll most likely find help should you need it.
However, SaaS software is backed up by experts offering support, and, most importantly, it removes the overhead of managing the tools to monitor Kubernetes yourself. It helps you manage the complexity of it all, while you focus on building your own product and creating value.
If you need help deciding, our guide on alerting and monitoring includes a checklist for you to go through when picking a monitoring system. Needless to say, Sematext checks all the boxes!
Using a tool like Sematext Monitoring abstracts away all the infrastructure and management needed for Kubernetes monitoring. All you need to do is run a cluster-wide agent and point it where it should send metrics and logs. That’s how easy it is!
Try it yourself and see. We offer a 14-day free trial for you to explore all its functionalities.