Definition: What Are Core Web Vitals?
Core Web Vitals are a set of metrics that Google uses to assess a user’s experience on a web page. These metrics help developers understand how their web page is performing in three main areas:
- Page-loading performance with Largest Contentful Paint (LCP)
- Ease of interaction with First Input Delay (FID)
- Visual stability of a web page Cumulative Layout Shift (CLS)
These measurements, combined with other metrics, give the developer and Google insight into whether their web page performs within acceptable parameters. Google will also take a site’s performance metrics into consideration when ranking a site on SERP (Search Engine Results Page).
Core Web Vitals shouldn’t be confused with Web Vitals. Web Vitals are supplemental metrics that help capture additional aspects of the user experience and troubleshoot issues. Although both sets of metrics factor into a web page’s user experience, the three Core Web Vitals have more weight.
If you’d like a TL;DR version of this article, watch the video below on Web Core Vitals. Otherwise, keep on reading to learn all the details you need to know to start working with these metrics.
Why Are They Important?
The success of your website lies in how satisfied your users are with it. To help ensure the quality of your user experience, Google uses various signals from a web page. Core Web Vitals are among the most important signals out of the approximately 200 that can potentially affect the search ranking of a web page. This does not mean that having high Core Web Vitals is enough to rank first in a Google search—other signals also need to be considered. These include featuring good and relevant content, having a secure connection established via HTTPS, having mobile friendly and fast pages, enjoying a lack of interstitials, being malware-safe, implementing fast JavaScript script, and many more.
Core Web Vitals also help you maintain the performance of a web page during the development and testing phases. Checking these metrics frequently during development can help you make sure any changes to the web page code are still producing a net positive effect. These metrics help discover slow-loading resources, which can help you optimize your page for better performance and page loading times. A web page that loads quickly improves user experience, reduces bounce rates, and can help improve your Google Search ranking, which is good for business.
What Are Google’s Three Metrics for Core Web Vitals Metrics?
As I already mentioned, there are primarily three metrics that constitute the Core Web Vitals: Largest Contentful Paint (LCP), First Input Delay (FID), Cumulative Layout Shift (CLS).
It is important to note that the Core Web Vitals scores are split between desktop and mobile. So if you have a great desktop web page that’s heavy on a mobile data network, your desktop page score will be good, but the mobile page’s score will not be good.
Largest Contentful Paint (LCP)
Largest Contentful Paint (LCP) is the metric that measures how long it takes for the largest image or text block to be rendered. Note, only the user viewport, or the visible screen, is considered for this measurement instead of the entire page. In other words, LCP is the time taken between the user clicking a web link to open a web page and the web page actually opening and loading the largest image or text block.
Having anything heavy on a web page will definitely affect this metric. For example, high-resolution images, large scripts, or multiple CSS imports will take longer to load and negatively affect your LCP score.

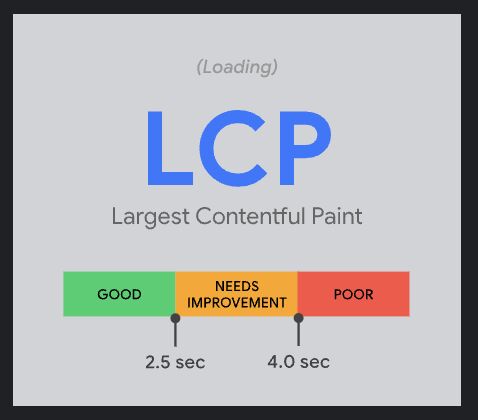
LCP thresholds (Source: web.dev)
Google breaks down LCP into three buckets: Good, Needs Improvement, and Poor. A good LCP score is within 2.5 seconds. Anything between 2.5 and 4 seconds is considered slower than average, and anything longer than 4 seconds is a serious problem. Ideally, you would want your LCP to load in less than 3 seconds. But achieving this can be a real challenge.
How can you improve your LCP score? Below are some ideas:
- Minimize large CSS files.
- Enable lazy loading for images or other UI elements so they’re loaded only when they appear in the user viewport.
- Clean up unused third-party imports.
We discuss these measures in greater detail in this article about Largest Contentful Paint.
First Input Delay (FID)
First Input Delay (FID) is a web vital that measures the amount of time it takes for a web page to process an input event from a user. When a user interacts with an input field, like clicking on a link, a form, or an anchor text, Google begins measuring the amount of time it takes from user input up until the moment the site processes the event.

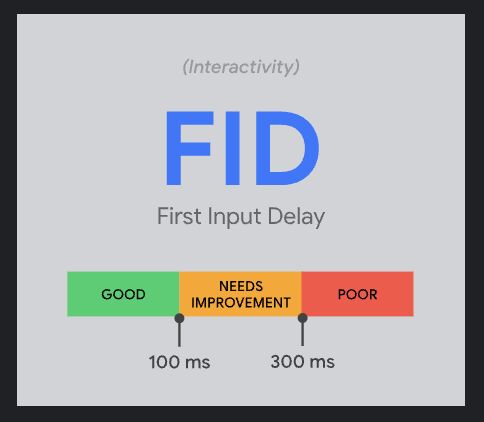
FID thresholds (Source: web.dev)
Similar to LCP, Google has guidelines on how quickly a site should process an input event. A healthy web page should be able to process the users input request in less than 100ms.
Modern web pages use advanced technologies to load dynamic content on web pages. This can easily lead to major latencies, so optimizing it is critical. The obvious culprits for poor performance in FID are under-optimized JavaScript scripts, large and redundant CSS files, large images. Below are some ideas for optimizing FID:
- Break up long-running tasks on a web page. A task that runs for more than 50 ms is considered a long-running task. Break them down into multiple chunks so that other UI tasks are not blocked.
- Defer the loading of unnecessary and third-party JavaScript scripts can drastically improve readiness.
- Use a web worker to offload processing tasks to a background task and let the UI use other threads, thereby unblocking the loading of UI elements.
You can learn more by reading the piece on First Input Delay.
[ebook_banner]
Cumulative Layout Shift (CLS)
Cumulative Layout Shift (CLS) is the metric that measures the visual stability of a web page from a user’s perspective. CLS indicates how stable the user interface (UI) elements on a web page are and is measured by how much the elements move around during page load and throughout the lifespan of a page.
You might have seen UI elements on certain web pages moving around while a page is loading. These shifts negatively impact the user’s experience as they shift the whole UI around.This forces the user to relearn and search for UI elements they’re interested in. CLS measures this shift and tells you if your site falls within acceptable parameters. Overall, the less the layout shifts, the lower the CLS score will be, leading to a better user experience.
A poor CLS score is typically caused by poorly designed CSS or JavaScript that manipulates the DOM. CSS animations, specifically the hover pseudo selectors, have historically caused many layout shifts when configured incorrectly. When designing and styling the front-end of your website, be sure that no event causes massive layout shifts on your site. These interactions can be rather off-putting to your users and cause you to have a worse CLS score.

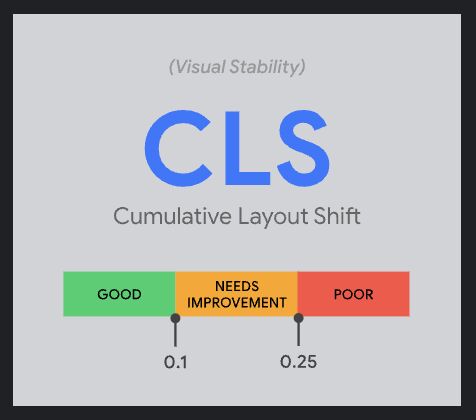
CLS thresholds (Source: web.dev)
Similar to both LCP and FID, CLS also has three buckets. Google expects a CLS score of 0.1 or less to qualify the user experience as “good”. Anything above a score of 0.25 is considered poor.
There are a few things you can do to optimize this indicator, such as:
- Add any new UI elements after the fold. This way, the existing UI elements remain where they are, as users expect.
- Add elements need to have a reserved space so they don’t appear out of nowhere, pushing out other elements in all directions.
- Using the size attributes for UI elements like images, videos, etc. helps make sure that other elements do not utilize space until these assets are loaded.
There are many more ways to decrease your CLS score. CLS is a deep topic as it touches both the visual design and user interactivity with your web page. Read more about this subject in this article dedicated to Cumulative Layout Shift.
Other Web Vitals Metrics to Consider
Below are a few other web vitals that affect your page experience and performance scores.
Time to First Byte (TTFB) measures the time taken between a request and the first byte of the response. This tells you how good or bad your server is performing. Google says a “good” TTFB score is getting the first byte of the request within 0.8 seconds.
First Contentful Paint (FCP) is a metric for how long it takes after a web page starts loading for you to see the first non-white canvas element of the content on screen. The content could be an image, a video, an SVG, a background image, some text, etc. To score a “good” FCP, a web page should load the first piece of content or UI element within 1.8 seconds from the time the page starts loading.
Time to Interactive (TTI) measures when a web page becomes responsive to user inputs, i.e., the time when a web page starts loading to when an element on the page is completely loaded and can accept user inputs. If a web page takes less than 5 seconds to become reliably responsive after it starts loading, Google will consider that a “good” TTI.
Total Blocking Time (TBT) is a metric for the time your page takes to go from FCP to TTI. This tells you how long the main thread on your web page was blocked during which it couldn’t respond to user interactions. A task is considered blocking if it’s running for more than 50 milliseconds (ms). There could be multiple such blocking tasks between FCP and TTI. A web page is expected to have a total TBT of less than 200 ms to qualify as a good user experience. Anything more than this, and the user will notice the sluggishness of the page.
Speed Index (SI) measures how quickly the content of a web page is loaded visibly. The web page is analyzed frame by frame with samples taken every 100 ms. A “good” SI score would require the page to load visually within 3.4 seconds. Anything over 5.8 seconds is considered “poor.”
Tools to Measure and Report Core Web Vitals
There are various tools available to test how a web page is performing with respect to the Core Web Vitals.
- Field tools and tests use real-world data from the “field,” including user interaction, network delays, caching, etc. All this will help give you a realistic picture of the performance of a web page. In this category, we can name tools such as the Chrome User Experience Report (CrUX), PageSpeed Insights, Sematext Experience, and others. These tools can also be referred to as real user monitoring tools.
- Lab tools and tests, also known as synthetic monitoring tools, run in controlled environments with very few variables. These use the same test conditions or environment to run tests consistently to observe the performance of a web page. The advantage here is that you can run the same tests over and over again without any variables to measure the performance of your web page. Tools such as Lighthouse, WebPageTest, Ahrefs’ Site Audit, and Sematext Synthetics fall under lab tools.
Lab tools help you during the development and testing of websites to maintain good scores in each of the Core Web Vitals. Similarly, field tools help validate those scores with real-world users after a website is deployed to production. Read this Core Web Vitals monitoring tools comparison to see what are the best options available from each category.
[product_banner type=”synthetic-monitoring”]Keep a finger on the pulse of your website and get alerted when issues are detected.[/product_banner]
Monitor Core Web Vitals Metrics with Sematext
[youtube_video]https://www.youtube.com/watch?v=4VNqaLF-XfQ[/youtube_video]
Sematext Cloud offers a whole suite of tools to monitor and troubleshoot your site, including field and lab tools.
Sematext Synthetics is a synthetic monitoring solution that enables you to run periodical tests to actively fetch your website’s performance metrics. For each test run, you can check for site uptime, view individual HTTP request, visualize your Core Web Vitals, and set alerts for when your web page falls behind in a predetermined performance metric.
With Sematext Experience, a real user monitoring tool, you can passively gather Core Web Vitals from real users. As a user browses your site, you can see each page’s Core Web Vitals, HTTP Request, client device info, and so much more.
Whether you use one or both tools, with Sematext, you can be confident that your sites have amazing Core Web Vitals, ensuring a stable experience for your users and bringing you one step closer to converting a visitor into a paying customer.
Start monitoring your site with the 14-day free trial to see if Sematext is right for you.
Conclusion
Google’s Core Web Vitals help you measure the performance of your web pages, giving developers and site owners an idea of how good or bad the user experience is with their site. This lets you easily improve website performance, reduce the time taken to load and display UI elements and make them more responsive to user inputs.
Using various tools, you can run these tests at regular intervals to track how performance is improving or deteriorating. Give them a try! Use Sematext’s 14-day free trial to see for yourself how such solutions can help.
Author Bio

Sunny Srinidhi
Sunny has been working in the data space for over seven years. He writes microservices to work with data at scale and has experience using a variety of databases, including MySQL, MongoDB, DynamoDB, Couchbase, Amazon Athena, and Apache HBase. He is currently working on a Customer 360 product that is intelligently unifying customer data from multiple sources at scale.