Red Hat is a Linux distribution known for its stability, security, and enterprise-grade features. Whether you’re running Red Hat on bare metal servers or virtual machines, monitoring the performance of your infrastructure is essential. In this article, we’ll explore the top performance monitoring tools for Red Hat servers. We’ll compare their pros, cons, and pricing to help you make an informed decision.
1. Sematext
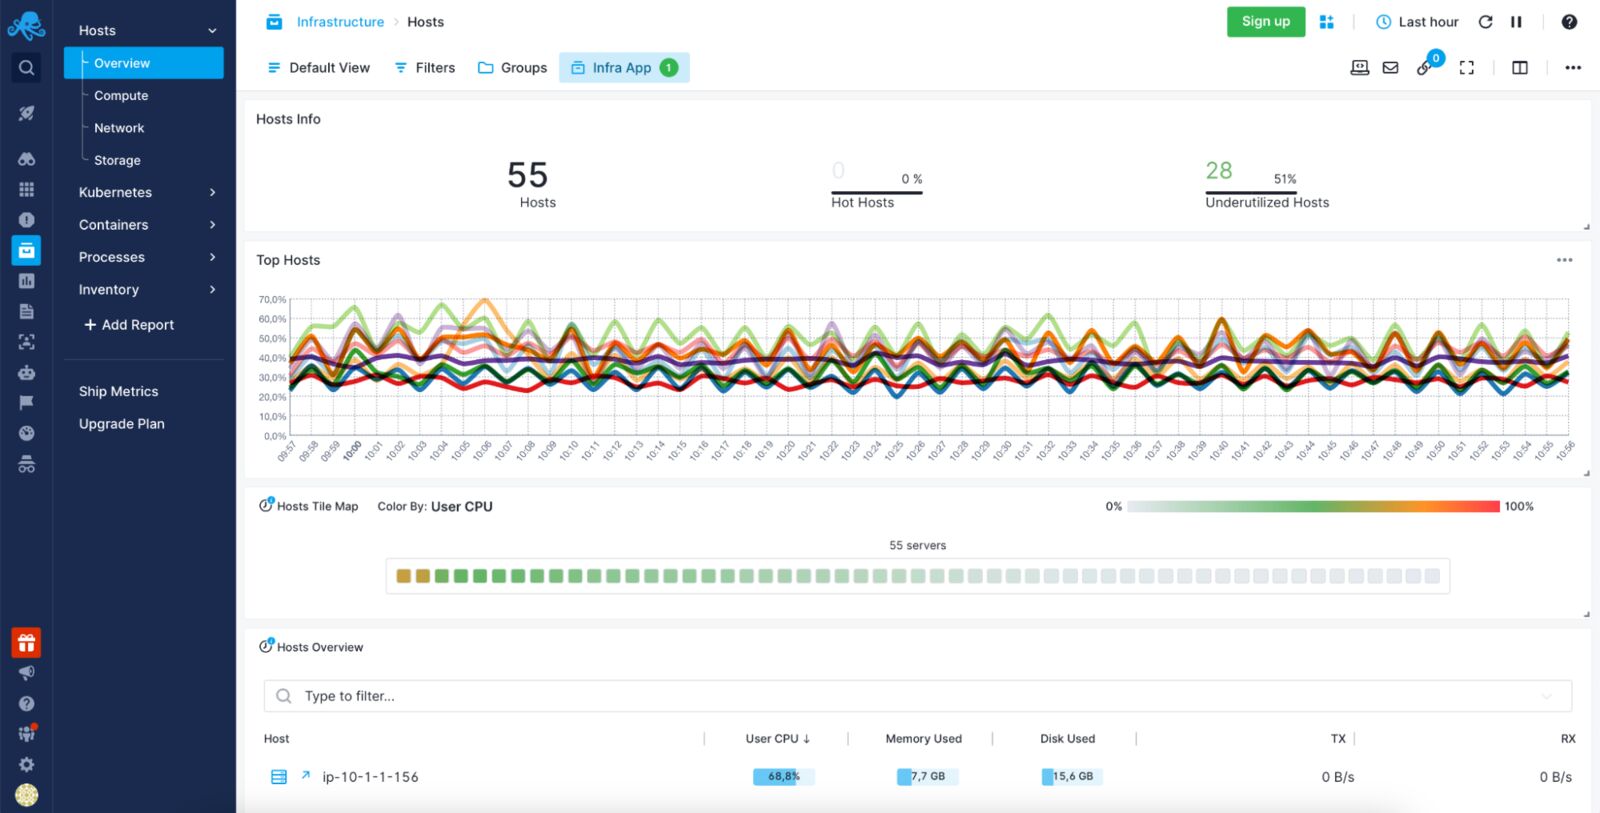
Sematext Monitoring is a full-stack observability tool with Red Hat monitoring capabilities. It provides an easy-to-use interface that offers a complete overview of your infrastructure, including Red Hat bare metal servers and virtual machines. In addition to monitoring metrics like CPU and memory utilization, you get the powerful alerting engine with anomaly detection and scheduling allowing you to avoid alerts fatigue and be notified when necessary.
Pros
- Quick and straightforward installation
- Overview of top resource-consuming processes on your Red Hat servers.
- Alerting and anomaly detection for metrics and logs generated by Red Hat hosts and any services running on them.
- Includes an inventory of all installed packages and their versions across the whole infrastructure, allowing for detection of outdated packages that ought to be updated.
- Includes the server inventory along with Linux distribution and kernel version information, which enables detection of old distro and kernel versions.
- Handy visualization of host (CPU or memory) utilization that lets you spot “hot” or underutilized hosts.
- Tight, but optional integration with Sematext Logs makes correlation of Red Hat performance metrics and logs very easy when doing root cause analysis.
Cons
- No transaction tracing.
- No full-featured profilers.
Pricing
Sematext pricing is straightforward and flexible, depending on your needs. Red Hat monitoring is metered by the hour, making it suitable for dynamic environments that scale up and down. The Standard plan starts at $3.6 per host per month with 7 days of data retention, and the Pro plan is available at $5.76 per host per month. You can try Sematext Red Hat Monitoring for free for 14 days.
For more information on Sematext Monitoring, check out the video below:
2. SolarWinds Server & Application Monitor
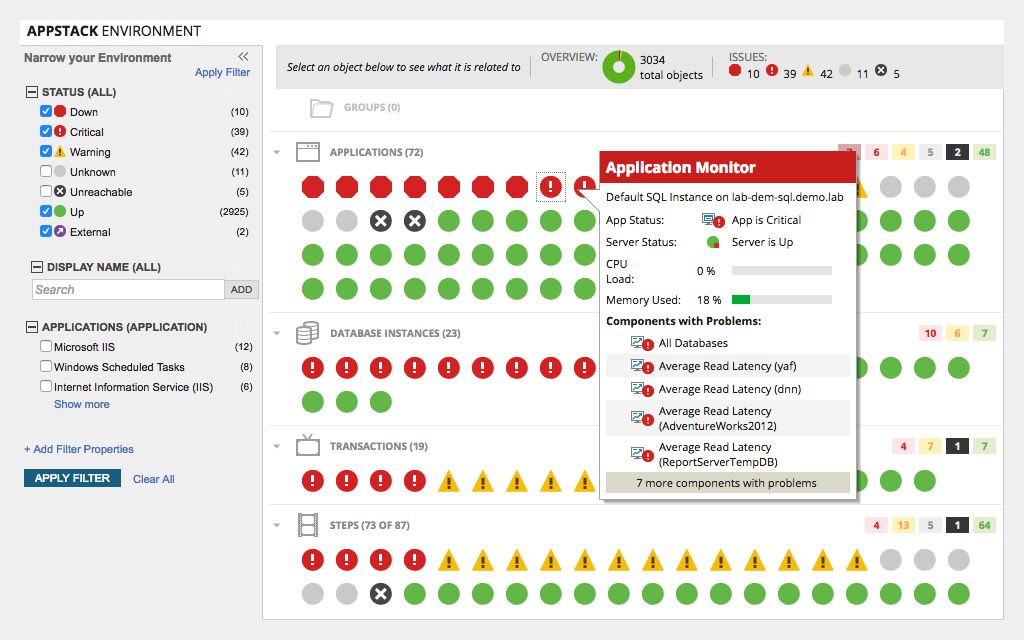
SolarWinds Server & Application Monitor is a comprehensive cloud monitoring platform with full support for monitoring Red Hat server infrastructure. It provides intuitive dashboards for visualizing and analyzing key metrics, including CPU, memory, I/O, and network-related data. Real-time monitoring, alerting, and reporting help proactively detect and resolve issues.
Pros
- Pre-built dashboards for quick setup and monitoring of Red Hat hosts.
- Infrastructure visibility beyond essential metrics, with support for distributed tracing and code profiling.
- Infrastructure dependency mapping for understanding service interactions.
- DevOps-friendly log streaming with log encryption for centralized logs from Red Hat servers.
Cons
- Pricing based on packs of hosts.
Pricing
SolarWinds’ pricing structure is dependent on the functionalities you intend to utilize. For instance, the infrastructure monitoring solution for Red Hat starts at $9.99 per host per month, but it is only available in packs of 10 hosts and 100 containers. If you require application monitoring in addition to infrastructure monitoring for your Red Hat hosts, the combined cost is $24.99 per host per month, following the same packaging approach.
3. Nagios
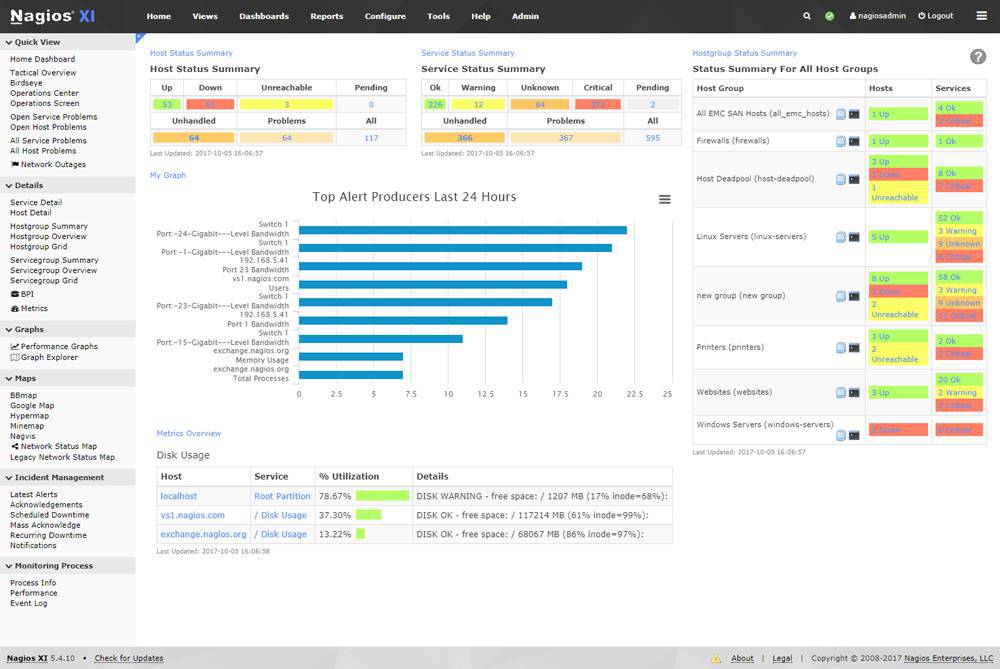
Nagios is a mature and popular monitoring tool with extensive support for Red Hat systems. It offers a wide range of plugins out of the box and a pluggable architecture for easy customization. With Nagios, you can monitor various metrics generated by your Red Hat infrastructure and receive alerts and notifications when abnormalities occur.
Pros
- Mature monitoring solution with a user-friendly GNU GPL license.
- Alerts with escalation capabilities for Red Hat system metrics.
- Scripting API for monitoring beyond Red Hat systems.
- Nagios XI includes capacity planning, data visualization, configuration wizard, and infrastructure management.
Cons
- More advanced features available only in the commercial Nagios XI version.
Pricing
Nagios Core is an open-source tool available for free. Nagios XI, the commercial version with additional features, has two pricing tiers: Standard (starting at $1995 per 100 nodes) and Enterprise (starting at $3495). Contact Nagios for detailed pricing information.
4. Stacer
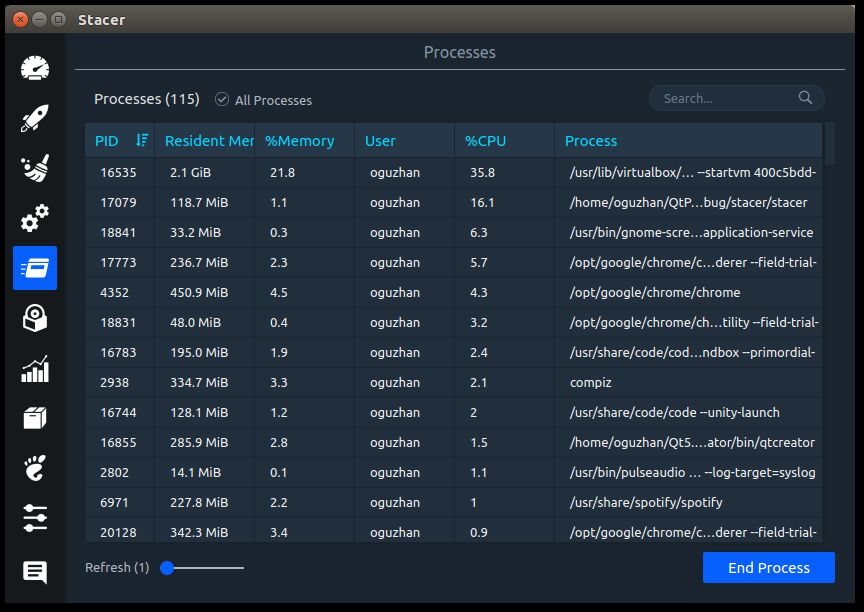
Stacer is an open-source system optimizer and application monitor that provides performance monitoring for Red Hat systems. While its primary functionality is system management, Stacer offers graphical monitoring of key metrics such as CPU, memory, and disk usage. It also includes features for managing startup applications, cleaning package caches, controlling running services, removing applications, and monitoring processes.
Pros
- Graphically appealing monitoring of Red Hat resource usage.
- Process monitoring for identifying resource-consuming processes.
- Services manager for easy control of running services.
Cons
- Not suitable for server environments due to dependencies that its graphical design might require – these dependencies are often not installed on production servers.
- Lack of notifications and alerting capabilities.
Pricing
- Stacer is a free and open-source tool for monitoring Red Hat performance.
5. GNOME System Monitor
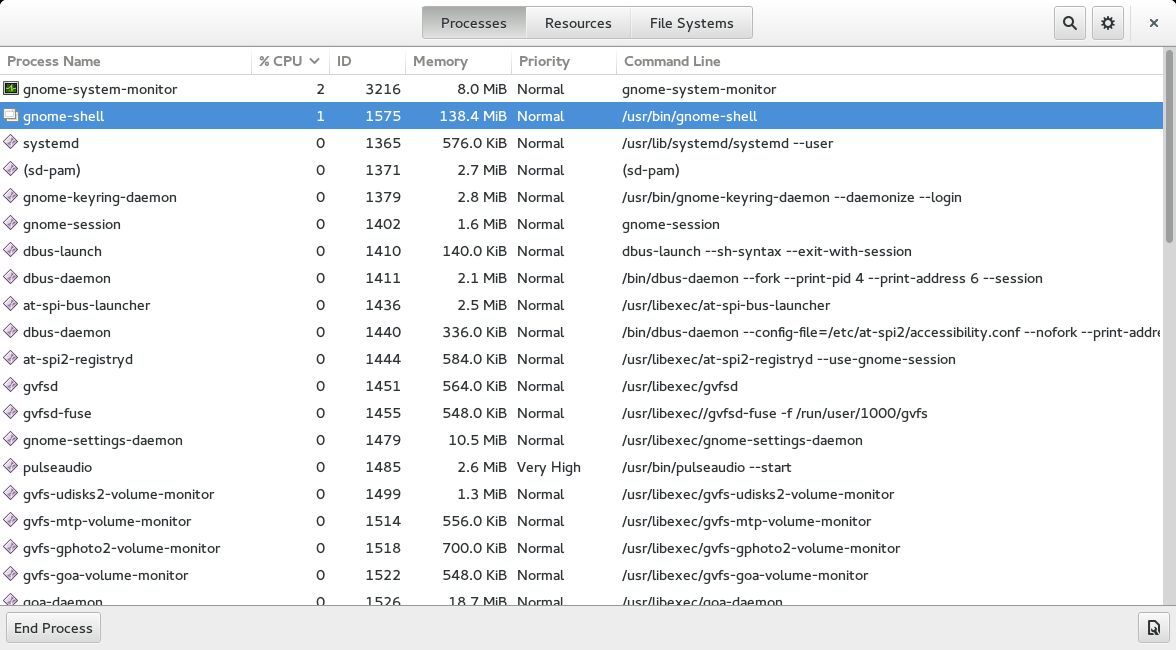
GNOME System Monitor is a system monitoring tool with a clean and simple interface that comes pre-installed with Red Hat. It allows you to monitor essential system metrics such as CPU utilization, memory usage, network activity, swap usage, disk utilization, and open files. The process viewer in GNOME System Monitor provides a detailed view of processes and their dependencies, making it easier to identify resource-intensive processes.
Pros
- Easy-to-use interface for monitoring Red Hat system metrics.
- Powerful process monitoring with dependency visualization.
Cons
- Lack of built-in alerting and notification mechanisms.
- Not suitable for server environments due to dependencies that its graphical design might require – these dependencies are often not installed on production servers.
Pricing
GNOME System Monitor is an open-source tool that is freely available under the GNU Public License 2.0.
6. Glances
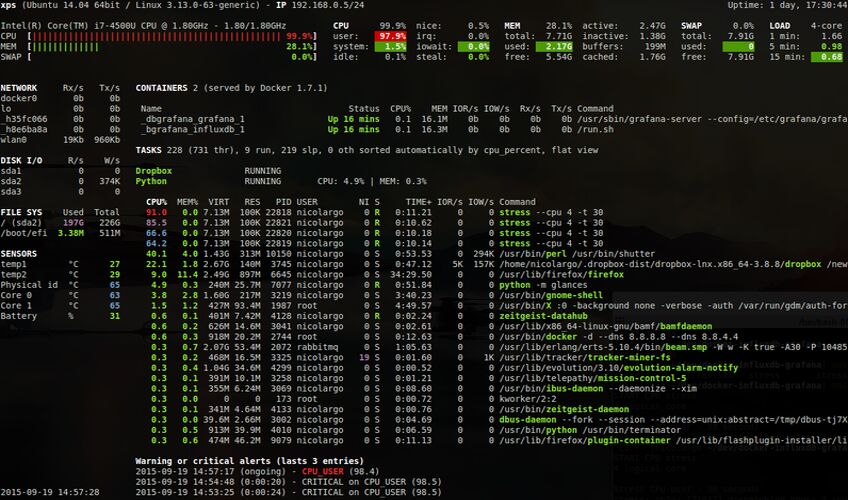
Glances is an open-source observability tool written in Python that enables real-time monitoring of various aspects of your Red Hat system. It provides metrics on CPU, memory, disk usage, and network activity. Glances also offers less common metrics such as component temperatures, voltages, and fan speeds, which can be useful for bare metal Red Hat servers. You can access these metrics through a web interface or a command-line dashboard.
Pros
- Extremely easy to use and configure.
- Option to export metrics to data stores like InfluxDB, OpenTSDB, Cassandra, StatsD, and Elasticsearch.
- Cross-platform support, making it suitable for monitoring Red Hat and other systems.
Cons
- No built-in mechanism for alerting and notifications.
Pricing
- Glances is an open-source and free tool for monitoring Red Hat servers.
7. Dynatrace
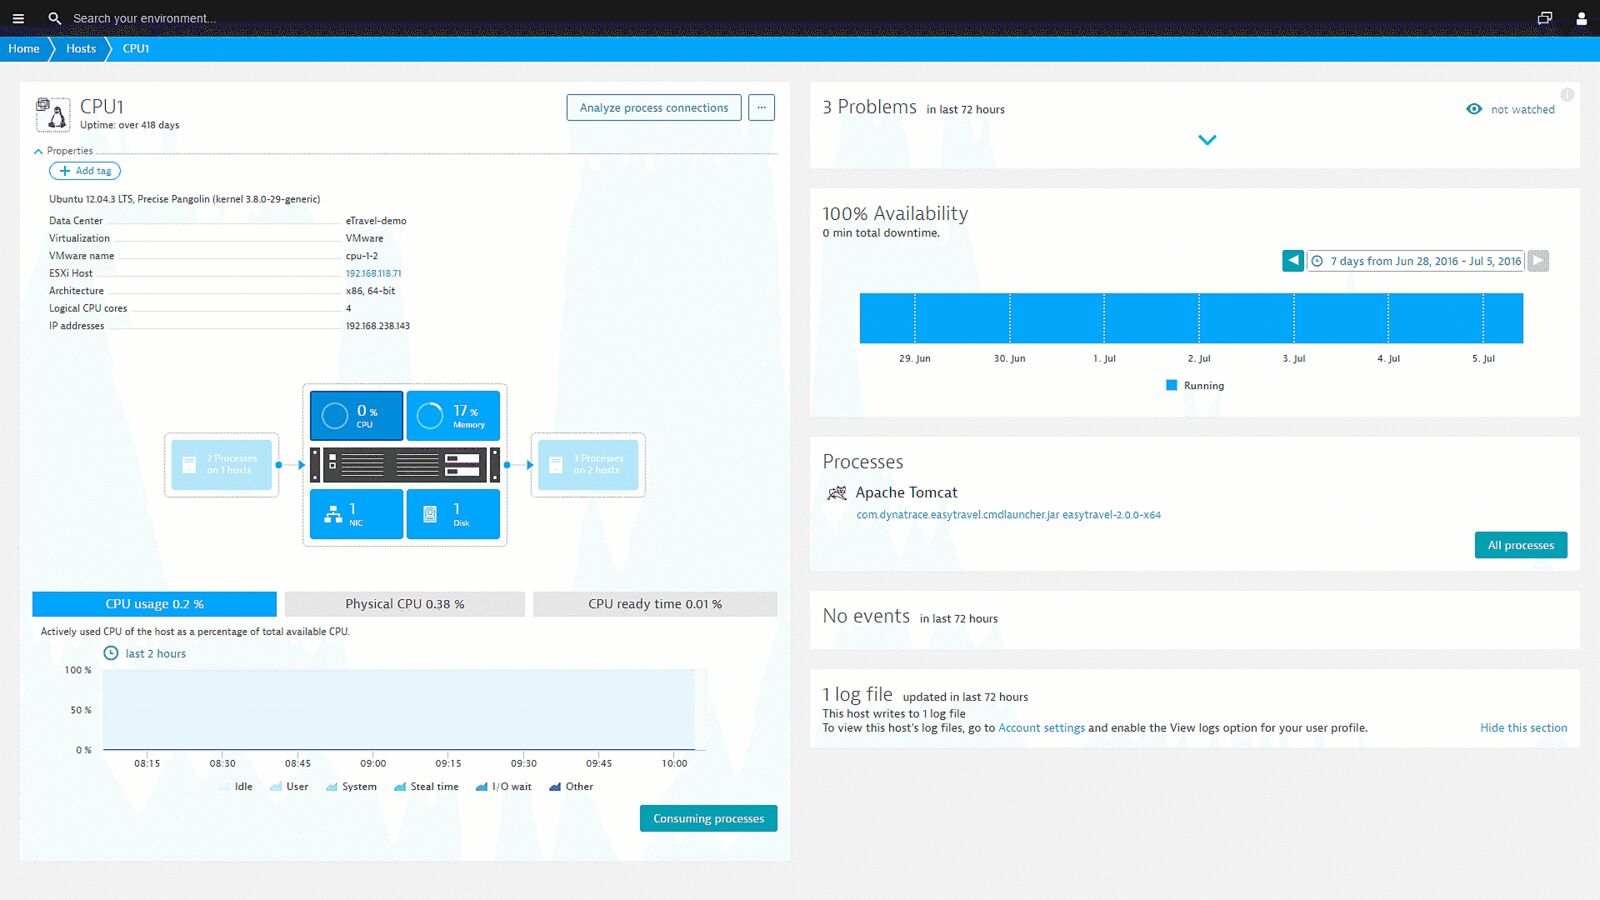
Dynatrace is a comprehensive observability solution that offers a user-friendly approach to monitoring your Red Hat machines. It supports a single running agent that, once installed, can be conveniently managed through the intuitive Dynatrace UI, simplifying the monitoring process. Available in both on-premise and SaaS models, Dynatrace fulfills a wide range of monitoring needs, covering the health and performance of your Red Hat servers and various other components within your infrastructure.
Pros
- Real-time monitoring capabilities for Red Hat, empowering you to detect and respond promptly to issues as they arise.
- Diagnostic tools that facilitate memory dumps, exception and CPU analysis, top database and web requests.
- Compatibility with major cloud providers, such as Amazon Web Services, Microsoft Azure, and Google Cloud Platform.
- Dedicated problem-solving functionalities that aid in quick and efficient issue detection.
Cons
- The feature set can initially appear complex and overwhelming, but Dynatrace makes efforts to assist new users with helpful descriptions and instructions.
- The premium nature of the solution makes it expensive for smaller organizations.
Pricing
Dynatrace’s pricing for infrastructure monitoring features is based on your hardware specifications, particularly the memory usage. The pricing starts at $22 per month for 8GB per host when billed annually.
Want to see how Sematext stacks up? Check out our page on Sematext vs Dynatrace.
Read out Dynatrace alternatives article if you want to see how it compares to other competitors.
8. AppDynamics
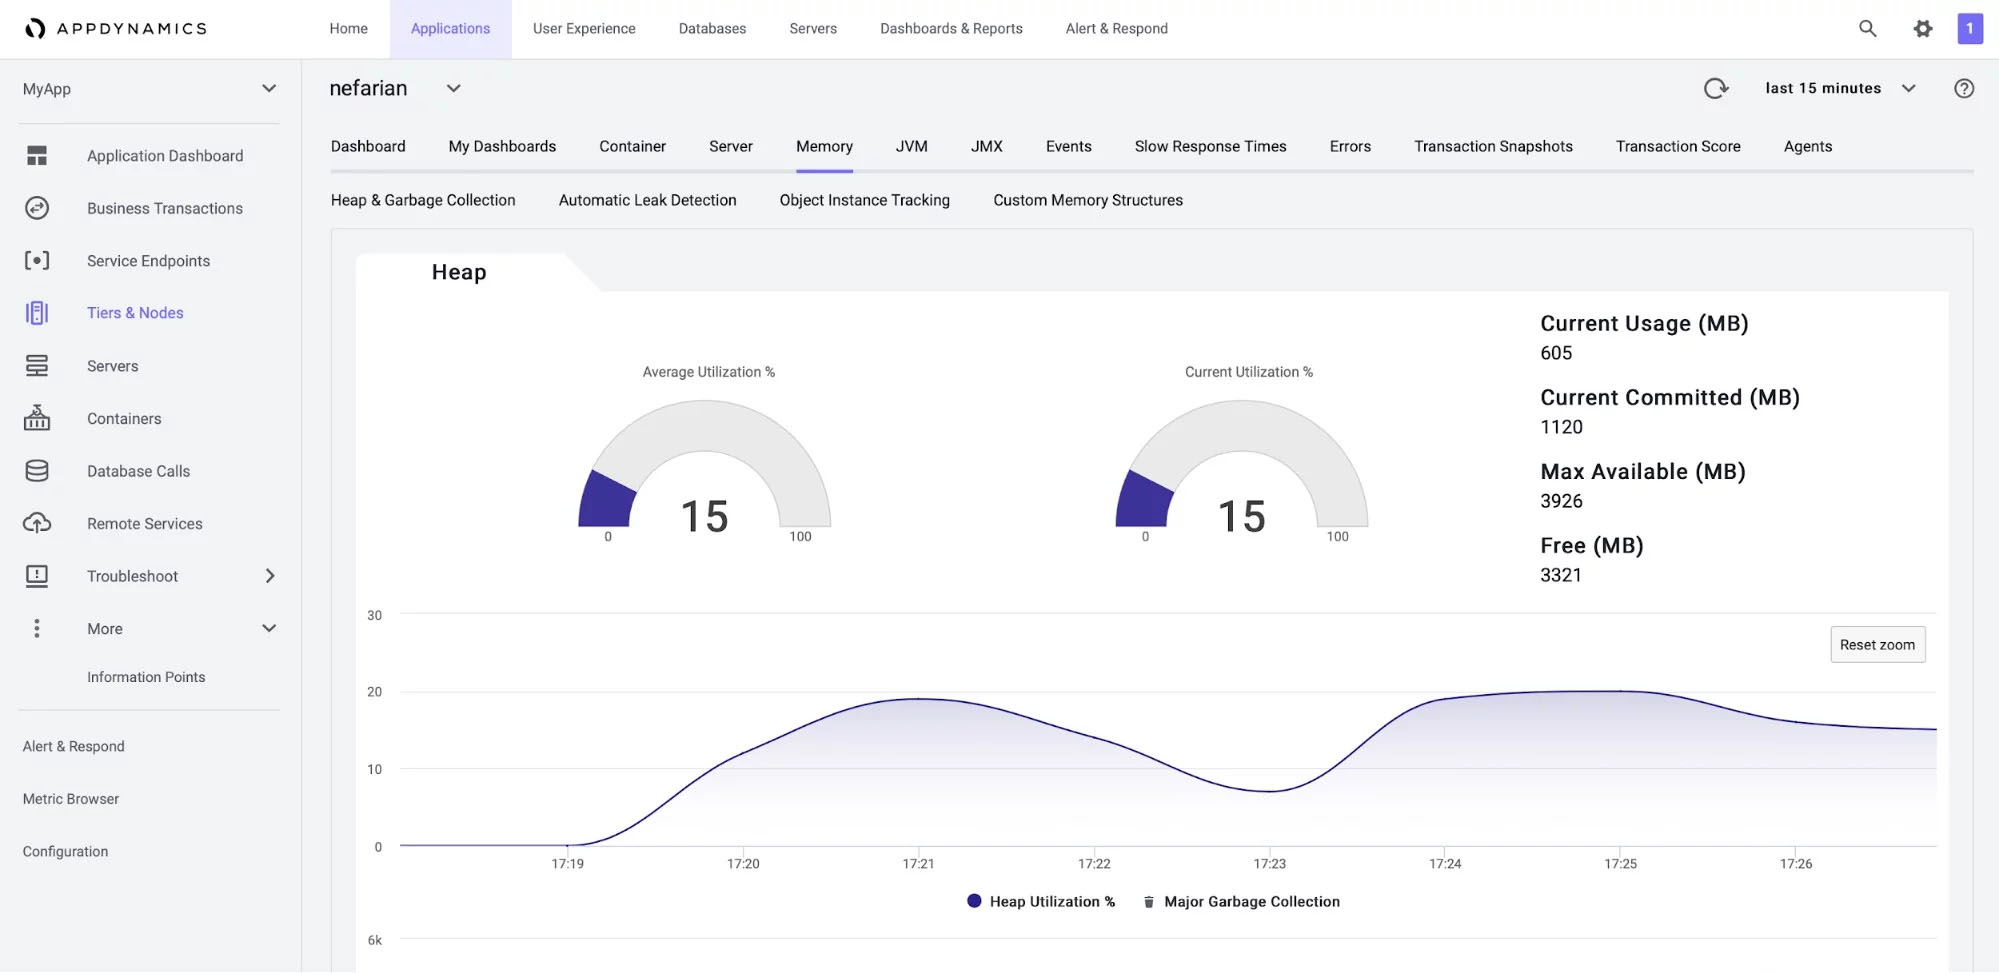
AppDynamics is an observability tool designed to monitor your Red Hat bare metal servers and virtual machines, along with the applications running on them. This solution caters specifically to large enterprises, offering a comprehensive set of infrastructure and application metrics that can be correlated with business-level metrics, leading to valuable insights for enhancing system performance. AppDynamics provides complete visibility into your environment, ranging from high-level transactions that resonate with business executives to code-level details that are valuable for DevOps teams and developers.
Pros
- Red Hat monitoring capabilities, including network components and server visibility features that provide information on status, utilization, and flow between elements.
- Effective alerting with customizable email templates, delivering the necessary information about your Red Hat-based infrastructure when required.
- Visibility into connections between the system components, environment elements, endpoint response times, and business transactions.
- Incorporates machine learning-based anomaly detection and root cause analysis features, enabling faster troubleshooting of your Red Hat machines and the applications they host.
Cons
- Pricing can be on the higher side for larger deployments, as it is based on the number of CPU cores.
- The agent installation process requires manual downloading and initiation, lacking a convenient one-line installation and setup command.
Pricing
AppDynamics offers flexible pricing based on the chosen plan and monitoring requirements. The basic infrastructure monitoring package starts at $6 per month per machine CPU core.
Want to see how Sematext stacks up? Check out our page on Sematext vs AppDynamics.
While the full-stack monitoring solutions and tools are nice, there are other ways to monitor your Red Hat servers that come free of charge – command-like tools that provide all the data that are critical to ensuring the health and performance of your machines.
There are various pros for the command line tools including:
- Widely available and open-sourced in most cases
- Simple to install and use
- Provide quick view of the Red Hat metrics for efficient, host-oriented troubleshooting
- Can provide more detailed metrics compared to SaaS solutions that are focused on high-level monitoring
However, there are also downsides, such as:
- Lack of support for alerting and long term monitoring (with exceptions)
- No distributed monitoring, meaning you are looking at a single host metrics
- In most cases lack of support for historical data, which makes them not a go to tool for post-mortem analysis.
Let’s have a look at some of the most popular ones.
9. BashTop
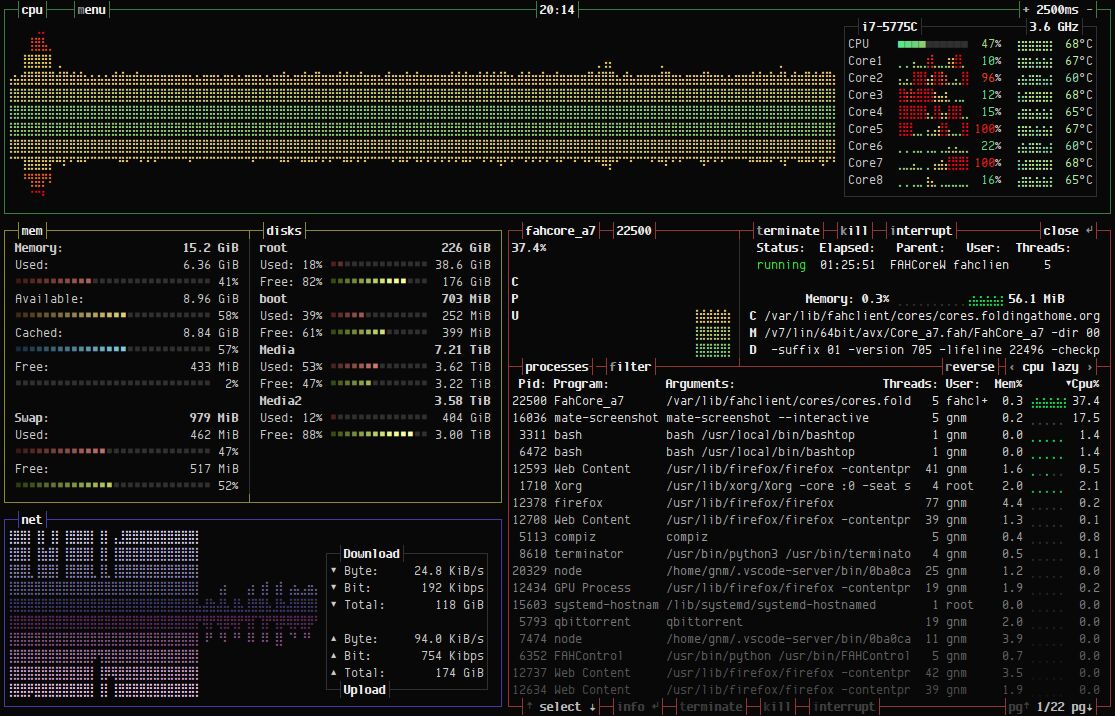
BashTop is a command-line-based system resource monitor with support for Red Hat. It tracks essential system metrics like CPU utilization, memory usage, I/O, network activity, and processes. BashTop provides detailed monitoring of processes, allowing easy sorting and switching between them. It offers auto-scaling for network graph usage and displays the current speed of system hard drives. With BashTop, you can effortlessly filter processes to focus on specific ones and send signals like SIGTERM, SIGKILL, and SIGINT. In summary, BashTop offers a comprehensive range of features expected from a monitoring tool. Moreover, it supports customizable themes to personalize your monitoring experience.
10. Vtop
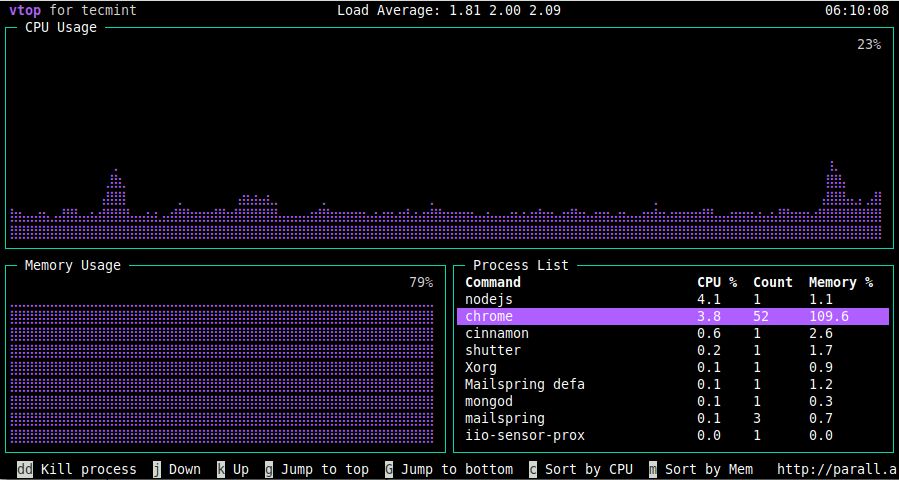
Vtop is an open-source, MIT-licensed graphical activity monitor written in Node.js, designed to support various platforms, including Red Hat. It provides information about system-wide CPU and memory usage, as well as a detailed view of the processes running on the server, including their count, CPU utilization, and memory usage. Vtop even allows you to terminate processes if necessary.
Vtop was developed to address the limitations of tools like top by visualizing CPU usage across multi-process applications. It stands out with its use of Unicode braille characters to present data visually, a unique feature rarely found in similar tools.
11. Htop
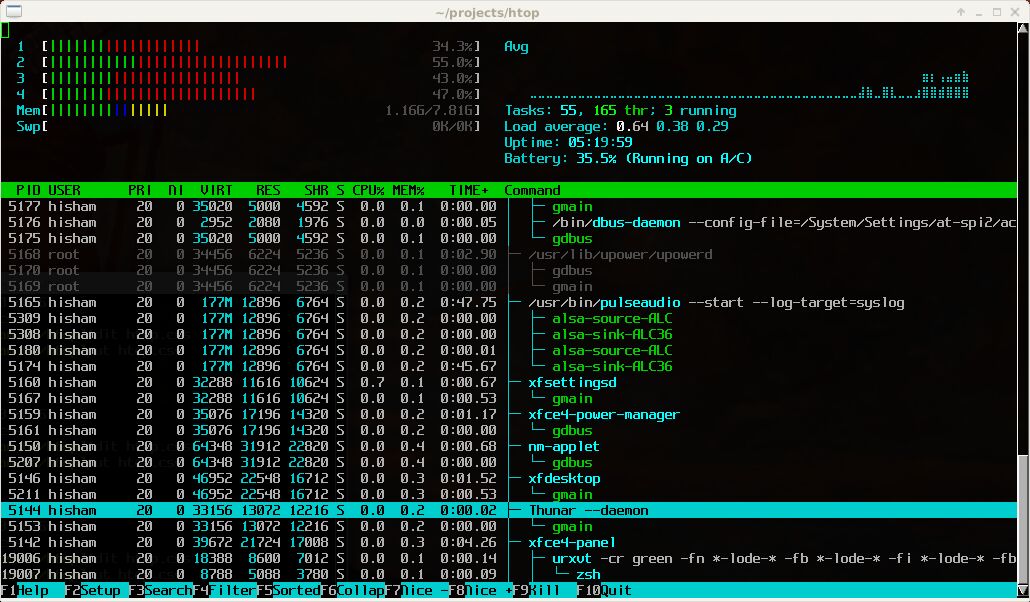
Htop is a cross-platform, command-line-based interactive process viewer that allows you to monitor and navigate the processes running on your Red Hat machine. It provides graphical information about metrics such as CPU core utilization, memory utilization, and swap memory usage in a compact format. Htop also offers real-time insights into the number of tasks, average load, and uptime of your host. Additionally, Htop enables you to configure I/O scheduling and CPU affinity for displayed processes. You can even customize the console appearance with dark or light themes to suit your preferences.
12. Nmon
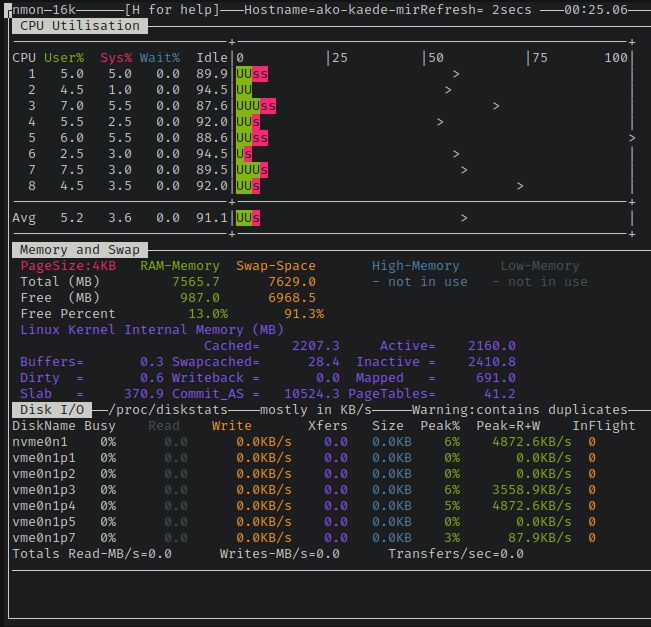
Nmon is a system monitoring tool designed for AIX and Linux operating systems, including Red Hat. It offers a comprehensive set of metrics to provide an overview of the health and performance of your Red Hat server. These metrics include CPU utilization, memory utilization, I/O statistics, swap, and paging. Nmon displays per CPU-related metrics in both numerical and visual formats, enabling you to quickly identify overloaded CPU cores. It operates in two modes: live, on-screen monitoring or writing metrics to a CSV file for later analysis and visualization.
13. Atop
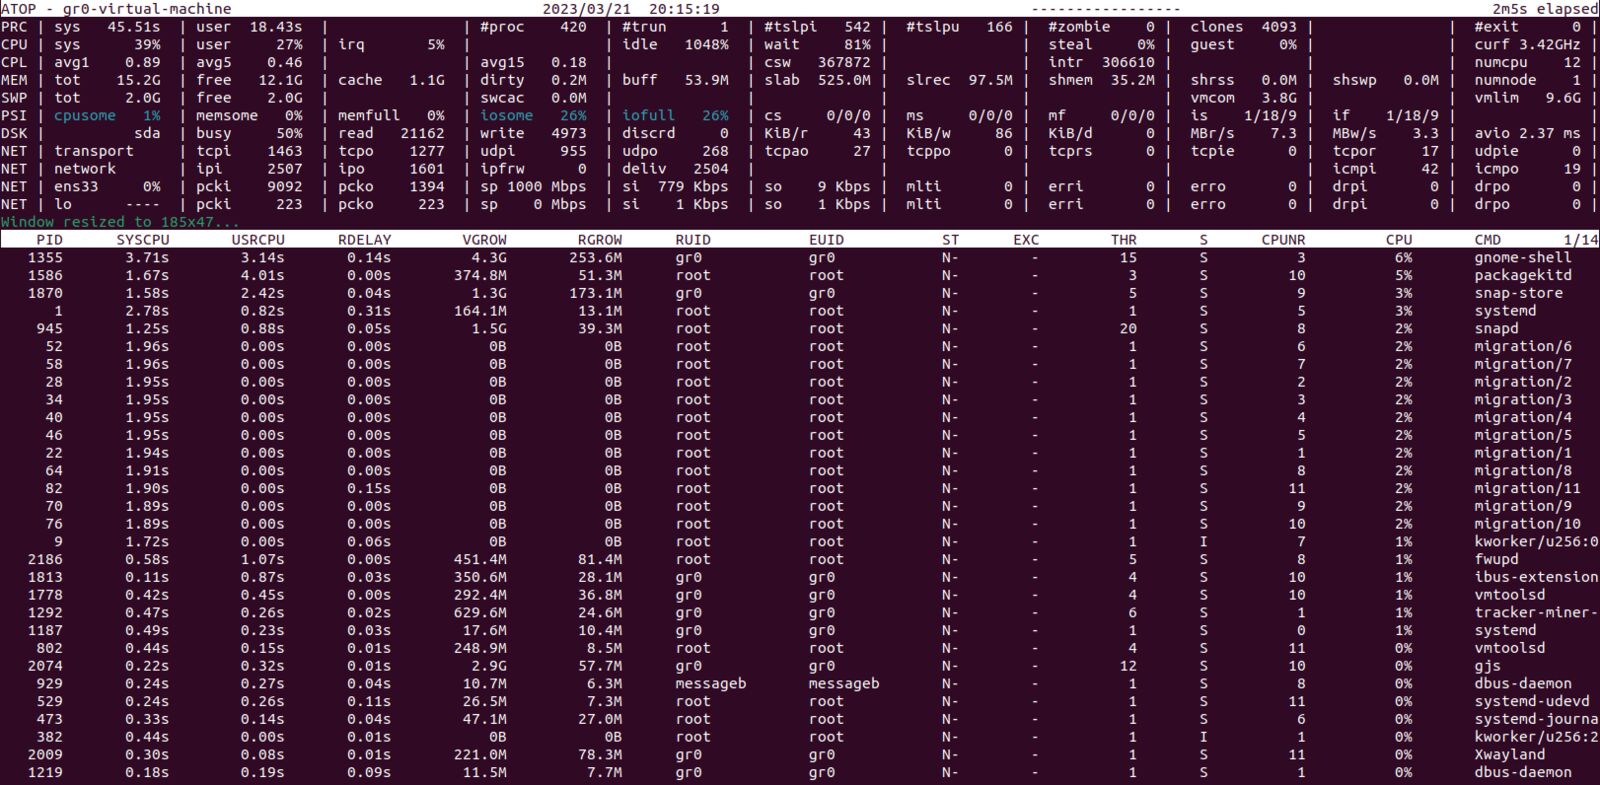
Atop is a command-line-based, full-screen Linux performance monitoring tool that fully supports Red Hat. It allows you to monitor critical system metrics such as CPU, memory, swap, disks, and network activity. Atop provides detailed insights into the activity of all the processes running on the machine and can log processes and system metrics for long-term analysis. Most importantly, Atop excels at pinpointing overloaded system resources. With optional kernel modules, Atop can also provide information on per-process/thread network activity and the system’s GPU activity.
14. Gotop
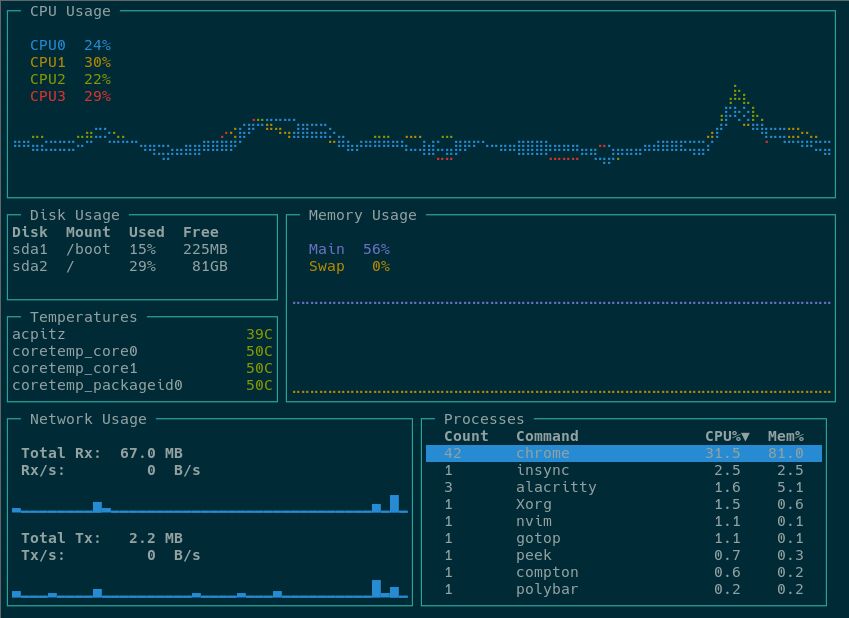
Gotop is a monitoring tool written in Go, designed to support various operating systems, including Red Hat. It provides essential metrics to understand the system’s status, including CPU, disk, and memory usage, as well as temperatures and network usage. Gotop also offers per-process CPU and memory utilization data for in-depth process monitoring.
One notable feature of Gotop is its ability to monitor other Gotop instances running on remote machines and consolidate the information within a single instance. However, achieving this requires following additional security steps that are not part of the Gotop tool itself.
Conclusion
The tool you choose for monitoring your Red Hat systems depends on your monitoring requirements, whether you need continuous and comprehensive analysis or occasional metrics viewing.
If you require continuous monitoring and in-depth analysis, it is recommended to look for a full-stack monitoring tool that provides visibility across your entire infrastructure, including your applications, their logs, and dependencies.
On the other hand, for ad hoc monitoring needs, one of the tools that provide specific metrics of interest would suffice – Htop, Atop, etc. fall in this category. Start monitoring your Red Hat servers with Sematext: