Unless you are using a very old version of Elasticsearch you’re able to define pipelines within Elasticsearch itself and have those pipelines process your data in the same way you’d normally do it with something like Logstash. We decided to take it for a spin and see how this new functionality (called Ingest) compares with Logstash filters in both performance and functionality. Is it worth sending data directly to Elasticsearch or should we keep Logstash?
Specifically, we tested the grok processor on Apache common logs (we love logs here), which can be parsed with a single rule, and on CISCO ASA firewall logs, for which we have 23 rules.
This way we could also check how both Ingest’s Grok processors and Logstash’s Grok filter scale when you start adding more rules.
Baseline performance: Shipping raw and JSON logs with Filebeat
To get a baseline, we pushed logs with Filebeat 5.0alpha1 directly to Elasticsearch, without parsing them in any way. We used an AWS c3.large for Filebeat (2 vCPU) and a c3.xlarge for Elasticsearch (4 vCPU). We also installed Sematext agent to monitor Elasticsearch performance.
It turned out that network was the bottleneck, which is why pushing raw logs doesn’t saturate the CPU:
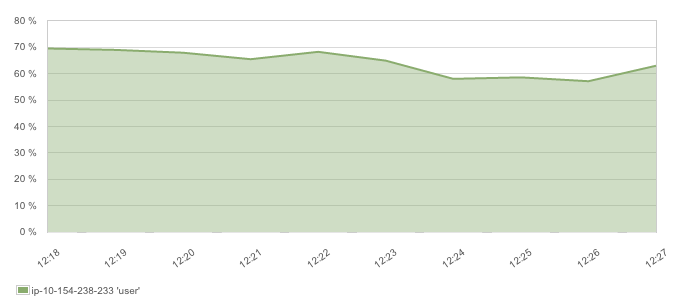
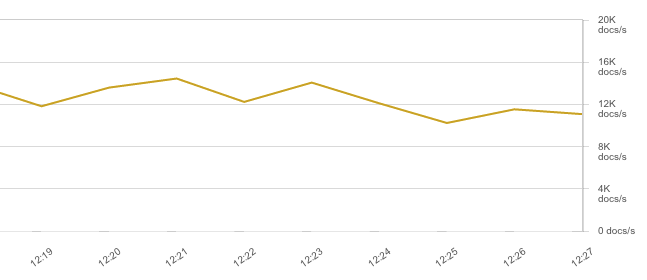
Even though we got a healthy throughput rate of 12-14K EPS:
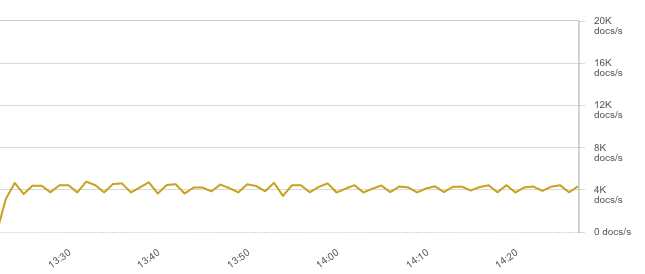
But raw, unparsed logs are rarely useful. Ideally, you’d log in JSON and push directly to Elasticsearch. Conveniently, Filebeat can parse JSON since 5.0. That said, throughput dropped to about 4K EPS because JSON logs are bigger and saturate the network:
CPU dropped as well, but not that much because now Elasticsearch has to do more work (more fields to index):
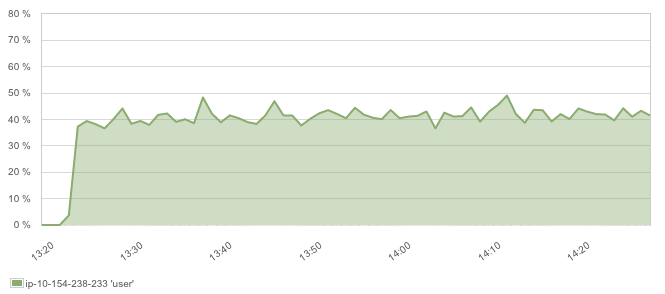
This 4K EPS throughput/40 percent CPU ratio is the most efficient way to send logs to Elasticsearch – if you can log in JSON. If you can’t, you’ll need to parse them. So we added another c3.xl instance (4 vCPUs) to do the parsing, first with Logstash, then with a separate Elasticsearch dedicated Ingest node.
Elasticsearch Ingest Node vs Logstash Performance – https://t.co/8n3JDI2UXP #elasticsearch5 #logstash
— Sematext Group, Inc. (@sematext) April 26, 2016
Logstash
With Logstash 5.0 in place, we pointed Filebeat to it, while tailing the raw Apache logs file. On the Logstash side, we have a beats listener, a grok filter and an Elasticsearch output:
input {
  beats {
    port => 5044
  }
}

filter {
   grok {
     match => ["message", "%{COMMONAPACHELOG}%{GREEDYDATA:additional_fields}"]
   }
}

output {
  elasticsearch {
    hosts => "10.154.238.233:9200"
    workers => 4
  }
}
Logstash pipeline workers
The default number of 2 pipeline workers seemed enough, but we’ve specified more output workers to make up for the time each of them waits for Elasticsearch to reply.
Logstash performance benchmark results
That said, network was again the bottleneck so throughput was capped at 4K EPS like with JSON logs:
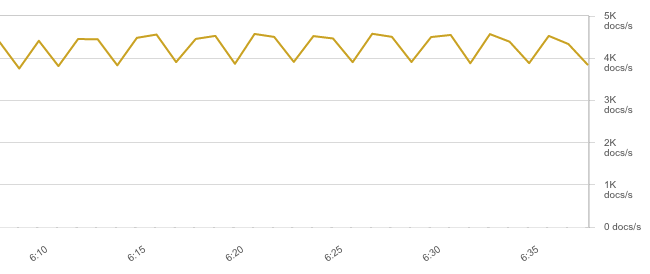
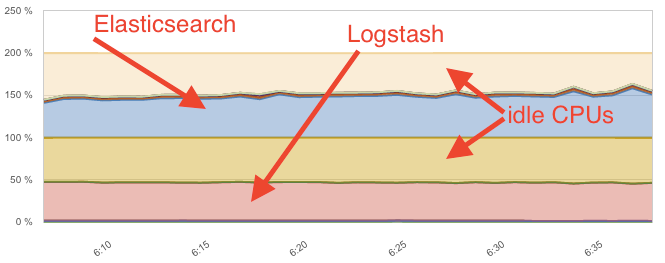
Meanwhile, Logstash used just about the same amount of CPU as Elasticsearch, at 40-50%:
Multiple Grok rules
Then we parsed CISCO ASA logs.
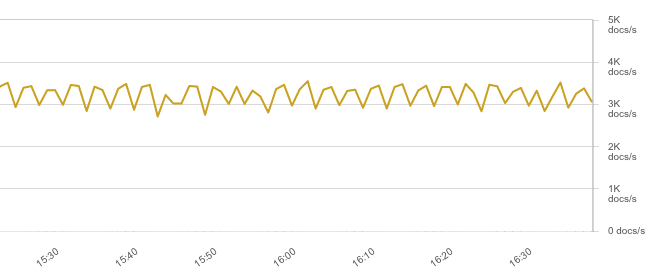
The config looks similar, except there were 23 grok rules instead of one. Logstash handled the load surprisingly well – throughput was again capped by the network, slightly lower than before because JSONs were bigger:
While CPU usage only increased to 60-70%:
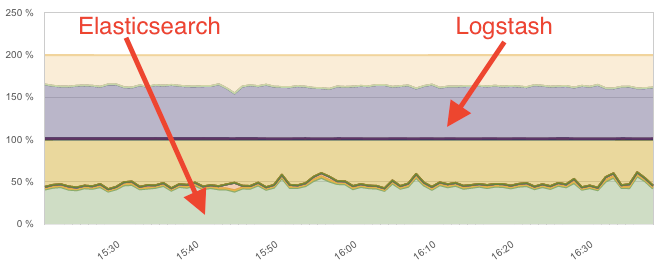
This means the throughput-to-CPU ratio only went down by about 1.5x after adding a lot more rules. However, in both cases Logstash proved pretty heavy, using about the same CPU to parse the data as Elasticsearch used for indexing it. Let’s see if the Ingest node can do better.
Ingest node
We used the same c3.xl instance for Ingest node tests: we’ve set node.master and node.data to false in its elasticsearch.yml, to make sure it only does grok and nothing else. We’ve also set node.ingest to false of the data node, so it can focus on indexing.
Next step was to define a pipeline that does the grok processing on the Ingest node:
curl -XPOST localhost:9200/_ingest/pipeline/apache?pretty -d '{
  "description": "grok apache logs",
  "processors": [
    {
      "grok": {
        "field": "message",
        "pattern": "%{COMMONAPACHELOG}%{GREEDYDATA:additional_fields}"
      }
    }
  ]
}'
Then, to trigger the pipeline for a certain document/bulk, we added the name of the defined pipeline to the HTTP parameters like pipeline=apache. We used curl this time for indexing, but you can add various parameters in Filebeat, too.
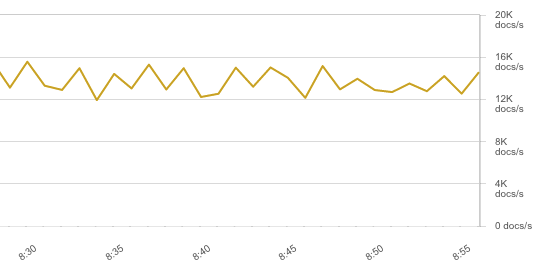
With Apache logs, the throughput numbers were nothing short of impressive (12-16K EPS):
This used up all the CPU on the data node, while the ingest node was barely breaking a sweat at 15%:
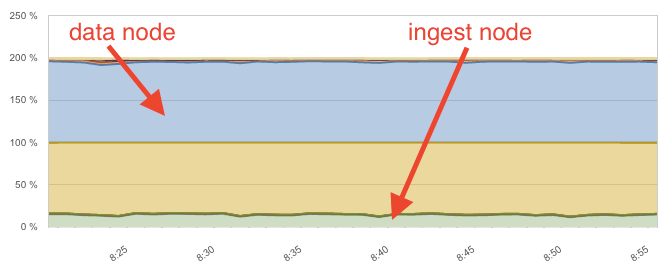
Because Filebeat only sent raw logs to Elasticsearch (specifically, the dedicated Ingest node), there was less strain on the network. The Ingest node, on the other hand, also acted like a client node, distributing the logs (now parsed) to the appropriate shards, using the node-to-node transport protocol. Overall, the Ingest node provided ~10x better CPU-to-throughput ratio than Logstash.
Multiple Grok processors
Things still look better, but not this dramatic, with CISCO ASA logs. We have multiple sub-types of logs here, and therefore multiple grok rules. With Logstash, you can specify an array of match directives:
grok {
  match => [
   "cisco_message", "%{CISCOFW106001}",
   "cisco_message", "%{CISCOFW106006_106007_106010}",
...
There’s no such thing for Ingest node yet, so you need to define one rule, and then use the on_failure block to define another grok rule (effectively saying “if this rule doesn’t match, try that one”) and keep nesting like that until you’re done:
"grok": {
  "field": "cisco_message",
  "pattern": "%{CISCOFW106001}",
  "on_failure": [
    {
      "grok": {
      "field": "cisco_message",
      "pattern": "%{CISCOFW106006_106007_106010}",
      "on_failure": [...
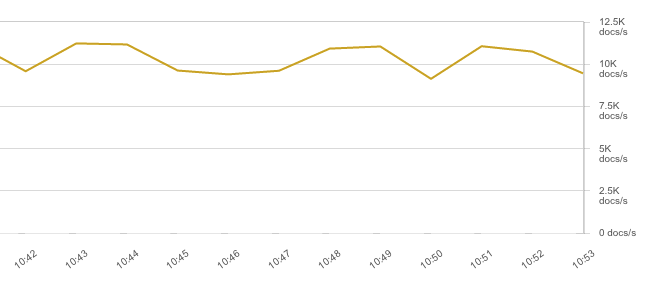
The other problem is performance. Because now there are up to 23 rules to evaluate, throughput goes down to about 10K EPS:
And the CPU bottleneck shifts to the Ingest node:
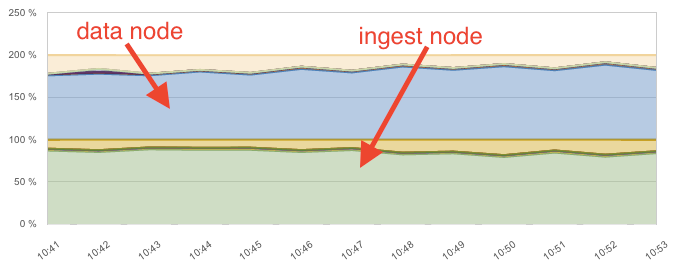
Overall, the throughput-to-CPU ratio of the Ingest node dropped by a factor of 9 compared to the Apache logs scenario.
Performance Conclusions: Logstash vs Elasticsearch Ingest Node
- Logstash is easier to configure, at least for now, and performance didn’t deteriorate as much when adding rules
- Ingest node is lighter across the board. For a single grok rule, it was about 10x faster than Logstash
- Ingest nodes can also act as “client” nodes
- Define the grok rules matching most logs first because both Ingest and Logstash exit the chain on the first match by default
Ingest Logstash performance tuning:
- Make sure Logstash’s pipeline batch size and number of threads are configured to make the best use of your hardware: use all the CPU, but don’t spend too much time on context switching
- If parsing is simple, Logstash’s Dissect filter might be a good replacement for Grok
- For Ingest, it’s best to have dedicated Ingest nodes. By default, all nodes can perform Ingest tasks (node.ingest=true in elasticsearch.yml). Ingest work is almost all CPU, so you can choose compute-optimized machines for the job
You’ve made it all the way down here? Bravo! If you need any help with Elasticsearch – don’t forget @sematext does Elasticsearch Consulting, Production Support, as well as Elasticsearch Training.