The Apache HTTP Server (httpd) is a widely used, open-source web server application. Because you can easily customize it through modules, it has become the go-to choice of both individuals powering their personal blogs and enterprises running high-traffic websites and web apps.
It’s a well-known fact that with high traffic, the performance of Apache web servers can take a hit, experiencing bottlenecks as your traffic scales up, which will lead to delayed responses. Regularly monitoring the performance can help you avoid these issues.
In this blog post, we’ll go through the key Apache server metrics you should track and the best performance monitoring tools to help you set up an efficient monitoring and alerting strategy.
The Three Most Popular MPMs Used in Apache
Knowing which Multi-Processing Module (MPM) your Apache installation is using will make it easier to identify which parameters you need to monitor. MPMs are accustomed to handling multiple requests in parallel by using a threaded approach and running on multiple CPU cores. There are three popular MPMs commonly used in most Apache web servers: Prefork, Worker, and Event.
1. Prefork
Prefork is a very well-known MPM for Apache. But while it’s been around for a long time, it’s not one of the best-performing options. Prefork creates copies of itself before requests come into the server, hence the name. This can be costly. It runs Apache as a single master instance, making Apache responsible for all child processes created. Each child process is responsible for servicing only one request. Because this is a single-threaded process, a Prefork-enabled Apache server can serve fewer concurrent connections. Monitoring this is important for determining whether additional child processes need to be added.
2. Worker
Worker functions in a similar way to Prefork; there’s one master that takes care of a bunch of child processes. But with Worker, each child process is multithreaded and can service multiple requests. Worker, however, locks a thread for the keep-alive duration before releasing it for other requests. This, in turn, affects the number of concurrent requests the server can handle. Monitoring the number of concurrent connections to the server will enable you to understand how Worker is handling keep-alive threads as well as the server throughput.
3. Event
Event builds on Worker to solve the issue of thread locks for a keep-alive request. In Worker, a child thread is completely blocked and basically useless until a keep-alive timeout. To solve this, Event adds an extra listener thread to each child process. It listens to incoming requests in order to route them to handlers, regardless of whether a keep-alive request is active or not. This means the number of concurrent requests to the server should not be affected much. Still, monitoring the metric regularly will help, since the Event MPM module wasn’t stable in earlier versions of Apache.
How to Monitor Apache Web Server Performance: Key Metrics to Measure
The metrics that help monitor the performance of your Apache web server are exposed by a module called mod_status. These metrics can be broadly classified into the following categories:
- Performance metrics
- Resource metrics
- System metrics
Performance Metrics
As the name suggests, these metrics paint a picture of how Apache performs. But if these numbers are outside the acceptable range, it doesn’t necessarily mean that the server itself is performing badly. The culprit could also be some underlying component experiencing performance issues. Let’s take a look at a few performance metrics.
Request Processing Time
Request processing time is the amount of time Apache needs to process one request. This includes the time it takes for all of the underlying services to process the request, as well as the web server itself.
For example, if there is a request to fetch a user’s profile from a database, the processing time includes the time it takes for Apache to route the request to a web service, the time that web service takes to pull the record from the database and return to the web service, and the time the web service takes to return the result to the client.
The bottom line: When you see a very high request processing time with Apache, don’t automatically assume there’s an issue with the web server itself — unless you also look at the Apache logs for all related services.
Requests Per Second
This metric represents the average number of requests per second, calculated over the entire uptime of the server. It can be a bit misleading when you’re trying to look for spikes over a period of time.
A sudden and unexpected rise in the number of requests could point to a denial-of-service (DOS) attack. On the other hand, you might see an increase in this number if you just started a sale on your e-commerce website. You want to be prepared with enough hardware commissioned to scale the services to match traffic. Otherwise, the processing time for each request could increase, and you might see requests being dropped without being serviced.
Uptime
Uptime is the amount of time Apache HTTP Server has been up and running. An unexpected drop in uptime may be an indication of an unplanned restart or server downtime. This can mean a whole host of things. For example, the allocated resources may not be enough for processing all requests, resulting in high CPU or memory usage that then leads to a freeze and restart. With uptime monitoring you can track down slow loading resources and check the availability and response time of both your website and publicly accessible infrastructure.
Bytes Per Second
The number of bytes per second is the number of bytes or the amount of data that is being sent to and from your Apache web server every second on average. This indicates the amount of data transfer that your infrastructure is handling.
Resource Metrics
Resource metrics provide insights into how Apache is handling resources provided by the server. They can help you decide if you need to scale up your hardware or if you have already overprovisioned resources and can scale down a bit for cost efficiency. Here are a few resource metrics to monitor.
Idle Workers
The number of idle workers can tell you if you’re short of resources or if you have them in abundance. A lack of idle workers means that there are too many requests coming in and your server will have to create new threads and processes to handle them. This could cause each request to take more time to process, which increases the latency of each request. If you’re facing this issue, you should consider increasing the resource allocation to your Apache web server.
On the other hand, if there’s always a large number of idle workers, you have allocated too many resources. You might as well use those resources for other services running on the same machine.
In either case, your decision completely depends on the amount of traffic you are getting on your web server and the amount of resources you have on your machines. Before making any changes to your resources, it’s best to observe the idle worker count over a few weeks. This will eliminate the possibility of having low traffic in an off-season.
Alive Connections
If there are a lot of alive connections on your web server that are waiting for requests, you might have a few rogue clients that are not making use of the keep-alive feature. This is because the keep-alive feature is used by clients when they have to send a bunch of subsequent requests.
On the other hand, if there are a lot of such connections active, then the clients are not sending those requests. This could lead to congestion, due to a shortage of connections available for clients who actually need to keep their connections open. To fix this issue, decrease the timeout period for keep-alive connections so that if a client doesn’t come back in a certain time period, the connection will be closed, releasing one more connection to the pool. You can also increase the permitted number of keep-alive connections. But this requires more resources, leading to an increase in cost. An Apache connection monitor can help monitor this metric.
Bandwidth
The bandwidth allocated to a server or VM can often limit the server from servicing all the requests that it’s getting.
In such cases, you might want to think about increasing the allocated bandwidth, or changing network interfaces on your hardware if you are hosting the servers yourself. It’s always a good idea to have more bandwidth than the maximum amount of data you want to transfer. But, at the same time, make sure you’re not spending too much on network infrastructure that you don’t need.
System Metrics
As the name implies, system metrics indicate the status of the system underlying your Apache web server. Here are some useful system metrics to monitor.
Memory
Some Apache modules consume a lot of memory, so whenever you install or enable a new module, make sure you observe how the memory is affected.
Apache has configurations that tell the server what to do if it consumes all the allocated memory. By default, if all of the memory is used up, Apache starts swapping to disk. Since any disk operation is much slower than memory, this will have a significant effect on web server performance. You can change this configuration from default to a better value calculated based on how many threads you need and how much traffic you usually get. This should help maintain the memory usage of the web server by killing off threads and processes that don’t need to be running anymore.
CPU
Apache creates threads and processes to process each request. The more requests you’re receiving, the more threads the server will need. Remember that it’s costly to create threads and processes because they need a lot of CPU power. And each new thread will consume some amount of CPU to do its job. CPU usage will scale linearly with the amount of traffic you’re getting.
High CPU usage indicates that there’s not enough CPU power to service all the requests coming in. But this may not be only because of poor Apache performance. Services running on the same box, such as an API server, and especially a database service, also require CPU and will compete for other resources, such as memory and network.
If you are experiencing high CPU usage, make sure to monitor the list of processes that are using a lot of CPU. If you see the Apache HTTP Server listed at the top of the list of processes, you might want to consider adding more resources to the box or moving other services (if there are any) to another server.
File Descriptors
In a Unix-based system, every socket opened needs a file to be created, as well as a file descriptor for that file. The number of file descriptors for a process is limited. For Apache, this means that the number of concurrent sockets or connections is limited.
To fix this, you can increase the number of open file descriptors there at a given time. But increasing this beyond a certain number (the specifics are system dependent) forces you to add more resources. You can also configure the Apache HTTP Server to club log files so that there are few files created for logging. But there’s very little you can do about getting too many requests.
Top Apache Monitoring Tools
Now that you know which metrics to measure, you need to choose the right monitoring solution. Here are the nine best Apache performance monitoring tools currently available.
1. Sematext Monitoring
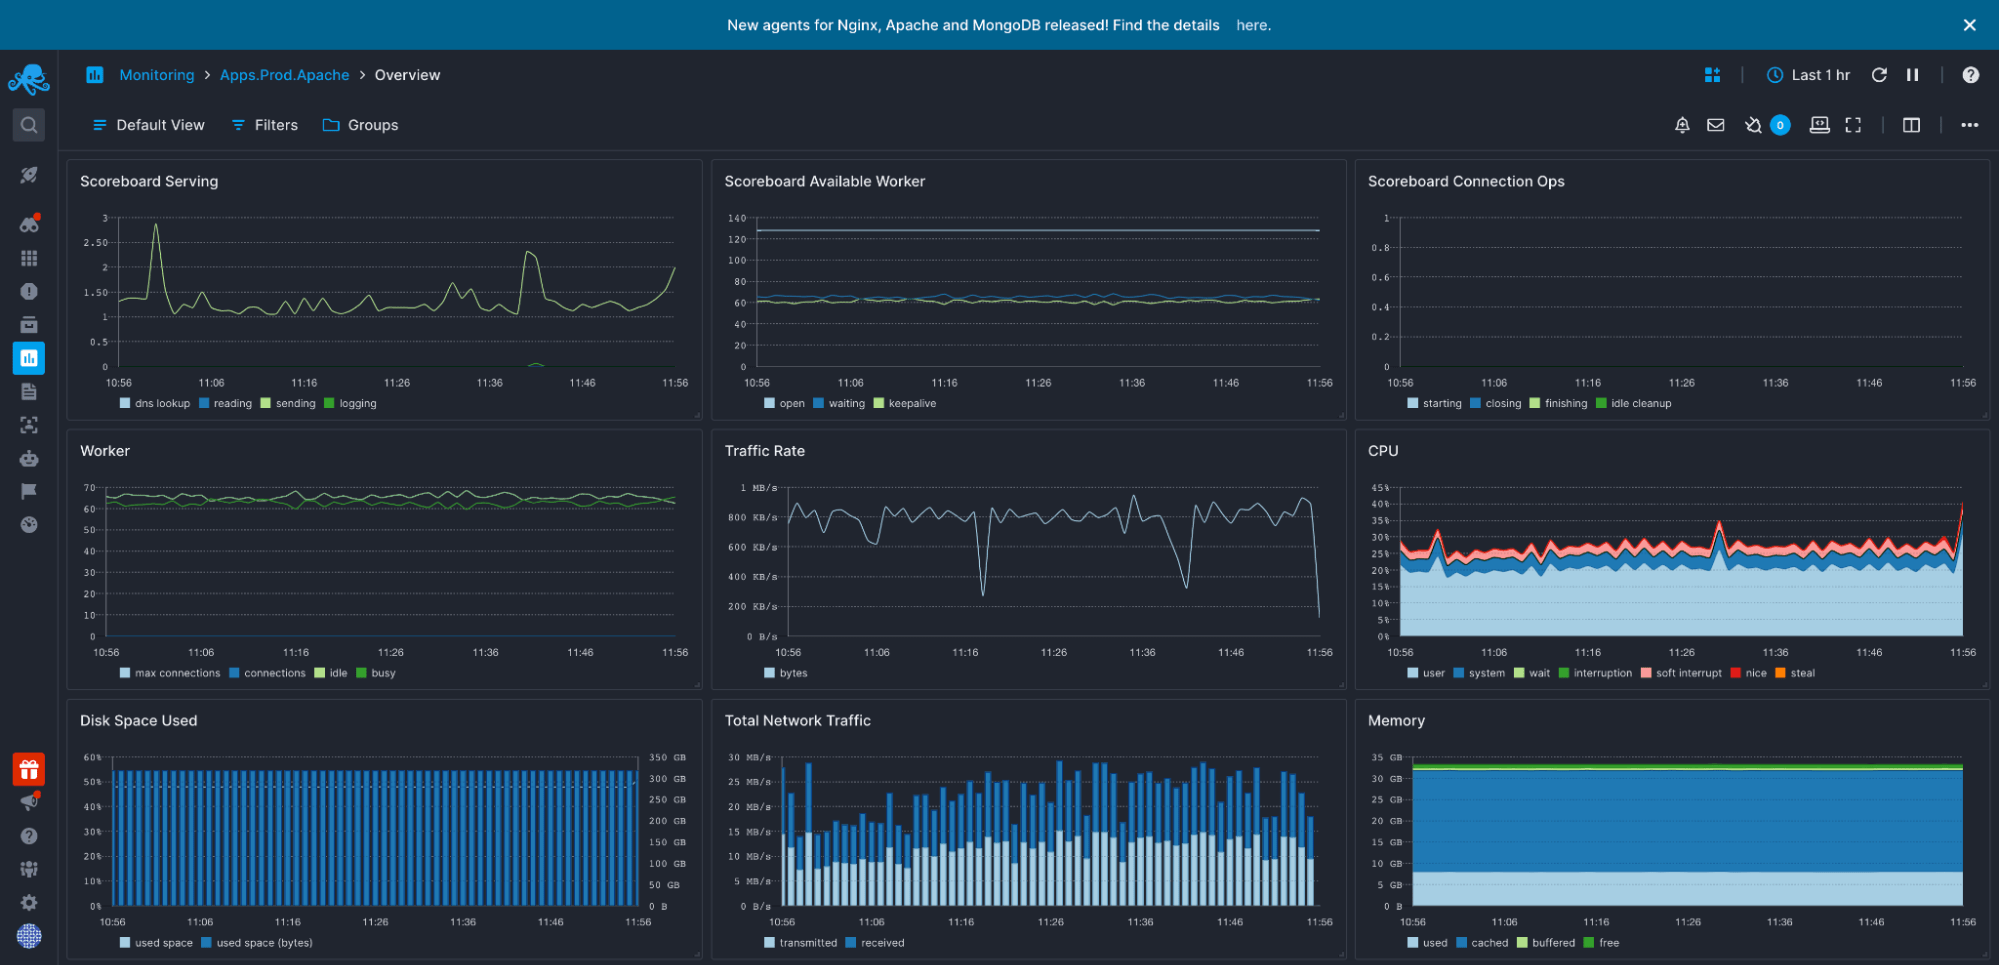
Sematext Monitoring is a performance monitoring tool that supports Apache web server monitoring, as well as a host of other tools and services. So along with the Apache HTTP Server, you can monitor the applications that are running on that server or anywhere else in your infrastructure.
Sematext monitors many Apache performance metrics and provides out-of-the-box dashboards and alerts that give you a clear idea of how the server is performing. You can also create custom charts and dashboards. It collects and visualizes all metrics that are provided by the Apache HTTP Server. If something goes wrong, this tool alerts you so that you can jump into action to prevent downtime.
Sematext also makes it easy to collect Apache web server logs so that you can correlate them with your application’s logs, performance metrics, etc.
Pros
- Ability to monitor all Apache metrics
- Pre-designed dashboards and reports specifically designed for monitoring Apache web server
- Ability to monitor logs and correlate them with performance metrics
Cons
- Closed-source primary agent, while other agents are open source
- No annual pricing, although bundling discounts are available
Pricing
There is a free plan as well as paid plans with a 14-day free trial. After that, pricing starts at $10.08 per agent per month or just $3.6 per month when running Apache in a container.
Check out our short video below for more information on Infrastructure Monitoring from Sematext.
2. Nagios
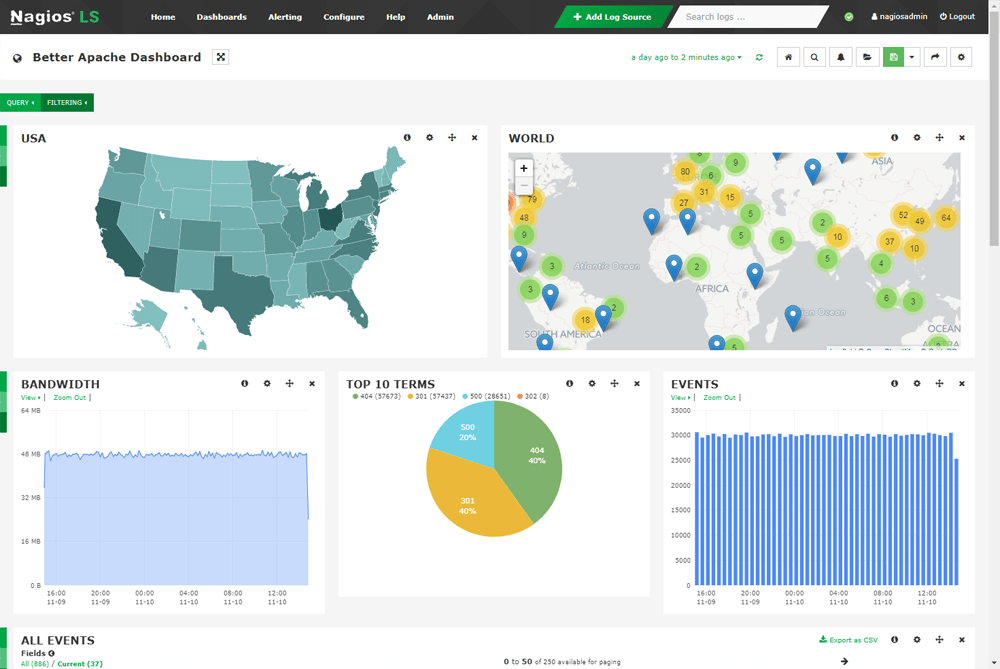
Nagios is a popular monitoring tool for Apache web servers. It collects all metrics exposed by the mod_status module of an Apache installation, allowing you to then create charts and dashboards to make troubleshooting easier. You can also integrate Nagios with Apache web servers to collect logs. This solution can check the logs to detect specific patterns, which indicates issues with the Apache HTTP Server.
Nagios is one of the few monitoring tools to provide server monitoring both with and without installing agents on the machines you wish to monitor. Of course, not all metrics will be collected for monitoring without an agent, but you can choose not to install an agent on your infrastructure.
Pros
- Supports a wide variety of plugins
- Can expose data to third-party visualization tools, such as Grafana, for richer dashboards
Cons
- Need to configure plugins from the CLI (there’s no easy GUI for this)
- Steep learning curve
- Not a SaaS, requires infrastructure and management
Pricing
There is a free version that supports up to seven nodes and 100 total hours of monitoring. The standard edition costs $1,995. The enterprise edition, which offers everything in the standard edition plus extra features, costs $3,495.
3. Zabbix
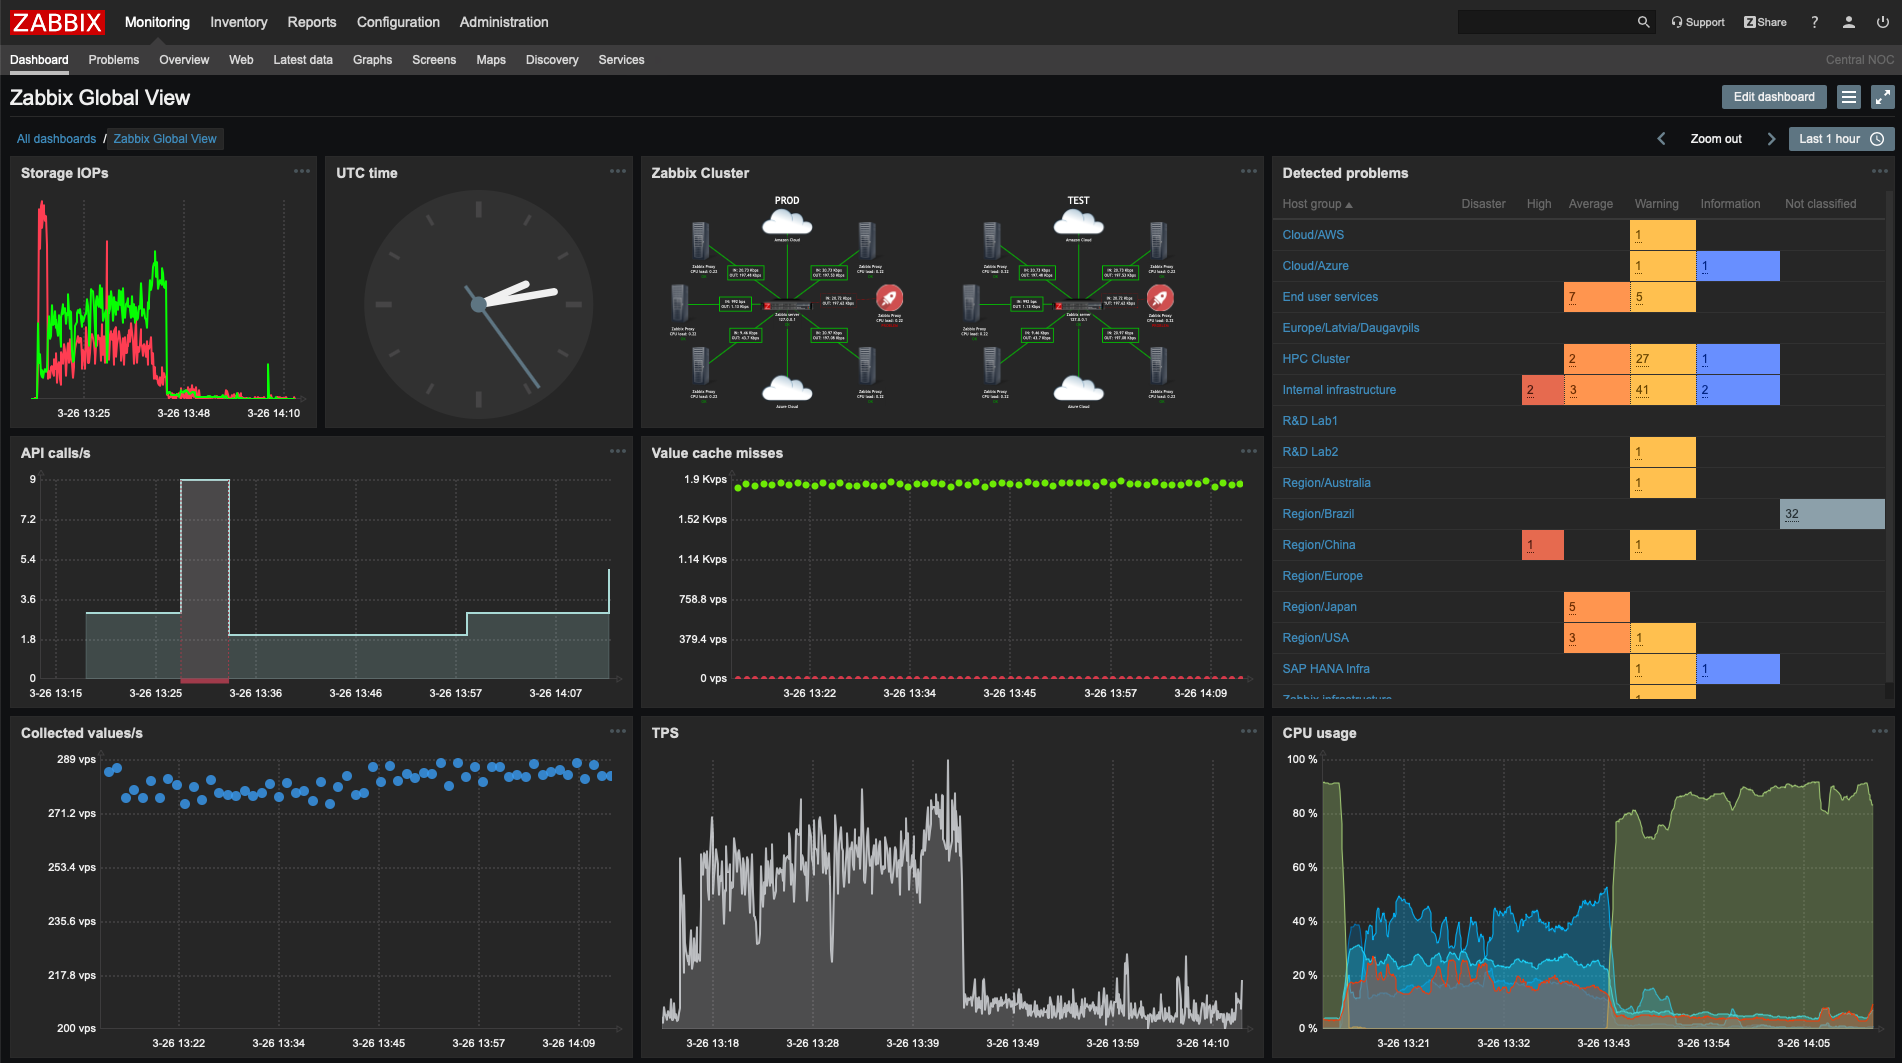
Zabbix is another popular web server monitoring tool with the ability to collect an impressive list of Apache metrics.
This Apache server monitor supports several triggers, such as the server being down, high response times, and more. When triggered, these can be configured to alert you so that you can diagnose the problem before it causes too much damage.
As an open-source tool, Zabbix makes it easy and cost effective to create custom plugins tailor-made for your use case. The Zabbix community is pretty active, so troubleshooting issues shouldn’t be a concern. The tool also provides a convenient web interface for configuration, unlike some tools that require you to write configuration files.
Pros
- Completely free and open source
- Supports plugins to extend the functionality
Cons
- Requires good knowledge of the operating system to configure properly
- Open-source software—updates depend heavily on the community
- The cost of maintenance
Pricing
The monitoring software itself is open source and free, but you have to pay for support.
4. SolarWinds Server and Application Monitor
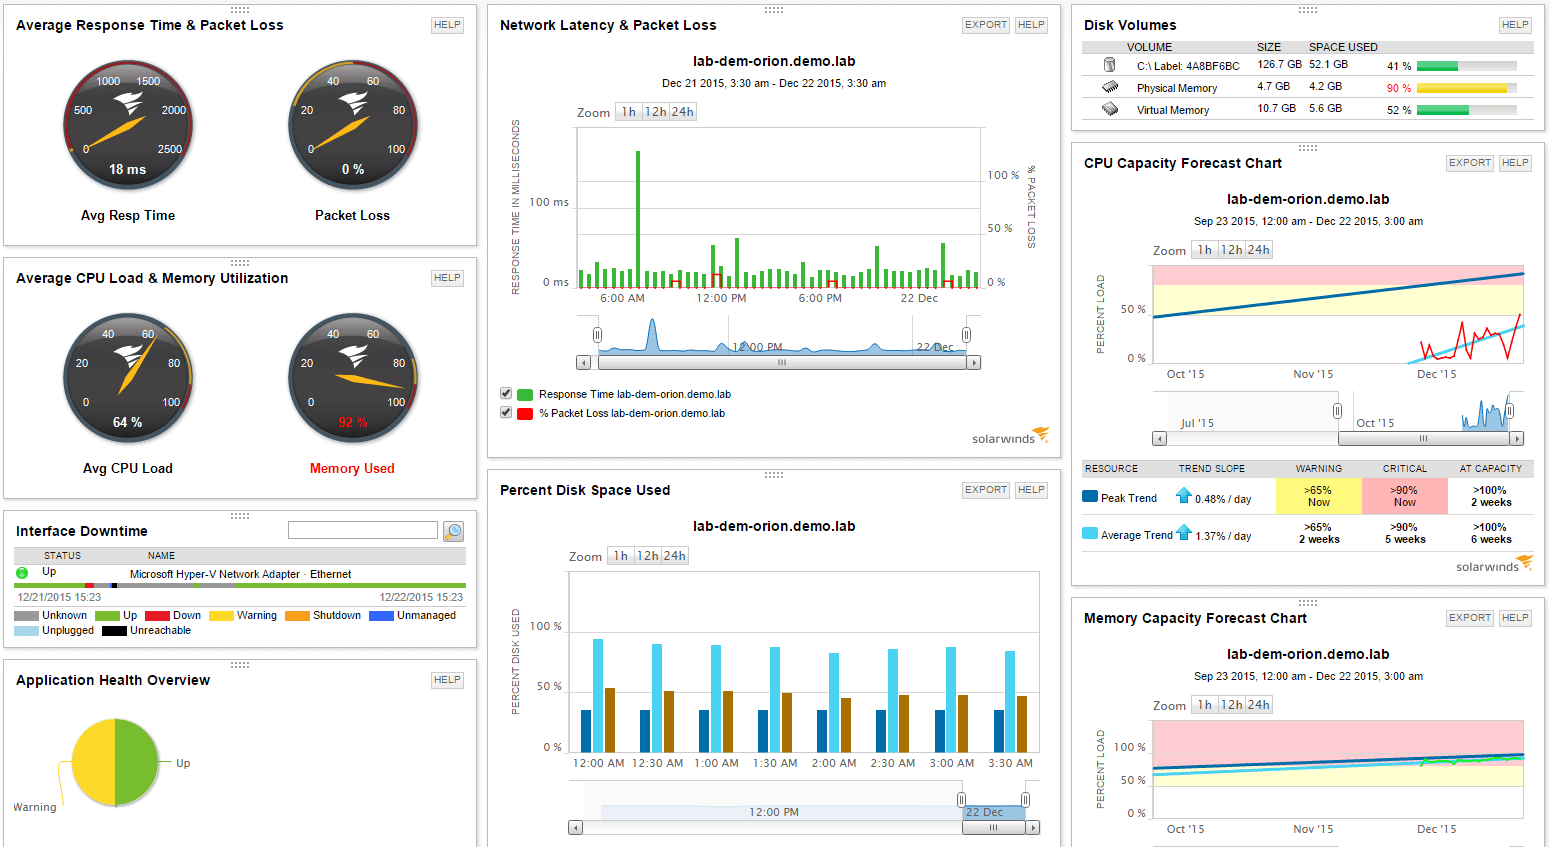
SolarWinds is another community favorite for monitoring Apache web server performance. Like other tools in this list, it can monitor a variety of services, such as databases and applications, along with your Apache server. This provides a bigger picture in terms of monitoring. It also alerts you when a metric goes out of the expected range.
SolarWinds can monitor all Apache performance metrics. With the ability to map these metrics on various charts, it provides dashboards that give you all the information you need at one glance. With over a thousand official application monitoring templates and over a thousand more designed by the community, SolarWinds offers you a lot of options for out-of-the-box Apache monitoring.
Offering an open database that can be accessed using a SolarWinds tool, SolarWinds allows you to easily integrate with almost any other service being used in your organization. It also provides capacity planning to help you plan for future infrastructure upgrades and budgeting.
Pros
- Various monitoring templates to choose from
- Proactive alerting system detects issues in advance
Cons
- Non-intuitive configuration wizard
- Difficult to find root cause of errors due to too many log messages
Pricing
You can get started with a 30-day free trial that includes all features. After that, the price is $1,622 per year.
5. Datadog’s Apache Monitor
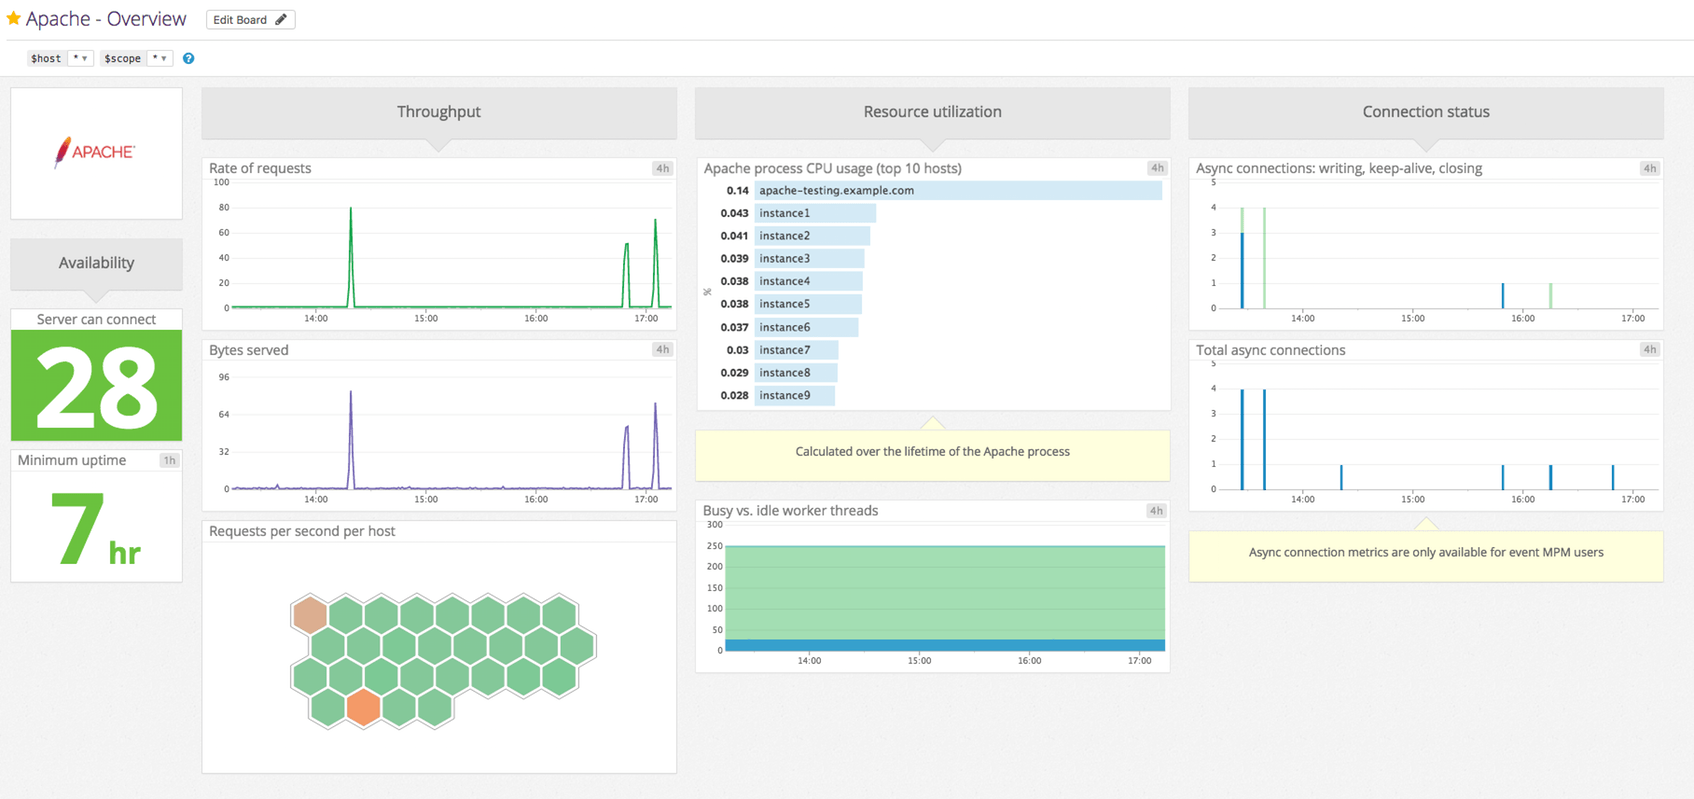
Datadog is a SaaS monitoring solution with Apache performance monitoring capabilities. It relies on the mod_status module to track key Apache web server metrics. Like with Sematext and other tools with built-in alerting, you can set performance thresholds and create custom dashboards so that you are only notified about relevant metrics when one or more grow out of the specified range.
Datadog can connect to databases and applications that you have installed on your servers to collect monitoring data from those systems as well. This adds the ability to monitor both the server and the applications running on that server.
Datadog provides a nice ranking of performance metrics, allowing you to focus on the most important ones. With over 80 turnkey integrations out of the box, you can collect and monitor many different metrics from your infrastructure and applications.
Pros
- Ability to monitor all Apache metrics
- Alerting with a variety of email templates and a time-period-based digest of alerts
Cons
- Complex user interface
- Cumbersome setup
Pricing
The free plan offers five hosts and one-day data retention. Paid plans start at $15 per host per month with an annual commitment—$18 otherwise—and increase from there.
Want to see how Sematext stacks up? Check out our page on Sematext vs Datadog. Before going for any Apache monitor, read through our comparison between Datadog and its top competitors.
6. Dynatrace
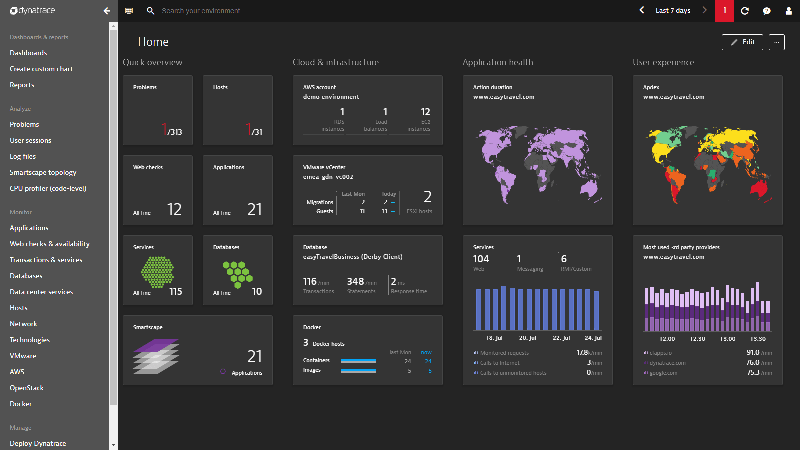
Dynatrace is an application performance monitoring tool that can integrate easily with your Apache web server to monitor its vitals, including data transfer size, number of works, and more. Along with performance metrics, Dynatrace can also work with your server’s underlying operating system to collect resource metrics, such as CPU and memory, as well as network stats.
All this information lets Dynatrace map various services together so that you can easily trace any issue with the Apache HTTP Server down to the root cause. Dynatrace offers an interactive infographic-style reporting tool that makes it easy for you to take action when an issue is reported.
Dynatrace offers a number of AI capabilities. For example, after learning how your infrastructure and applications behave, Dynatrace can automatically detect incidents in your infrastructure and can create tickets so your engineers can take a deeper look into the issue.
Pros
- Root-cause analysis
- Interactive infographic-style reporting
Cons
- Dashboards with limited features and customization options
- Can be expensive
Pricing
There is a 15-day free trial. After that, pricing varies depending on the features you select.
Want to see how Sematext stacks up? Check out our page on Sematext vs Dynatrace. For a broader comparison, read about Dynatrace and its competitors.
7. AppDynamics
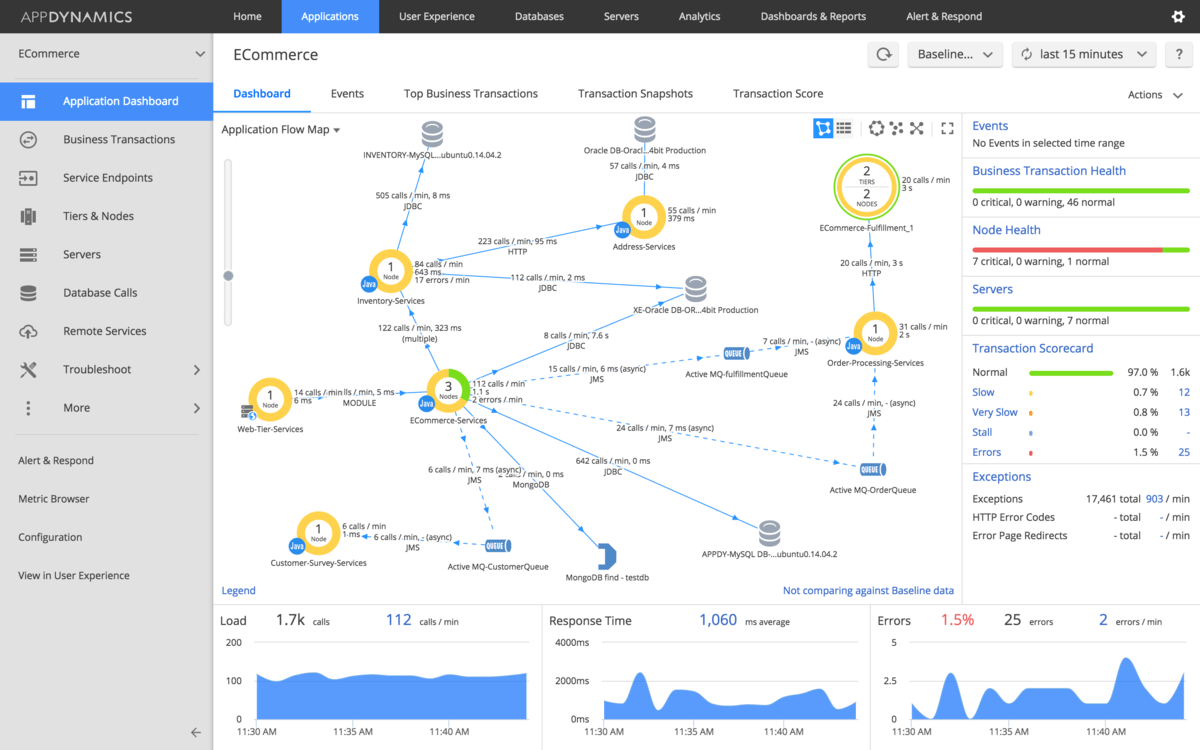
AppDynamics is another solution for monitoring your Apache web servers, collecting most of the data that the mod_status module exposes. Along with Apache metrics, this tool collects resource-related metrics, like memory usage, CPU usage, and more, stitching them all together to give you better insights.
With AppDynamics, you can connect to your Apache HTTP Server remotely to fetch all the metric data you need, without having to install a worker module on the same machine as the server (although that is an option as well). Instead, AppDynamics provides an Apache module that can be installed on the server to collect the data and send it across to the AppDynamics server for analysis.
The Unified Monitoring feature collects data from a variety of monitoring tools and combines it into a single monitoring dashboard, making it easy to identify the root cause of issues impacting real users.
Pros
- Business-transaction monitoring
- Intuitive user interface
Cons
- Can be overwhelming in the beginning
- User-role definition a bit limited
- Aimed at very large enterprises, sales-heavy and expensive
Pricing
There is a 15-day free trial. After that, pricing is $6/month per CPU core for the most basic package, and $60/month or $90/month per CPU core for other plans.
Want to see how Sematext stacks up? Check out our page on Sematext vs AppDynamics.
8. ManageEngine Applications Manager
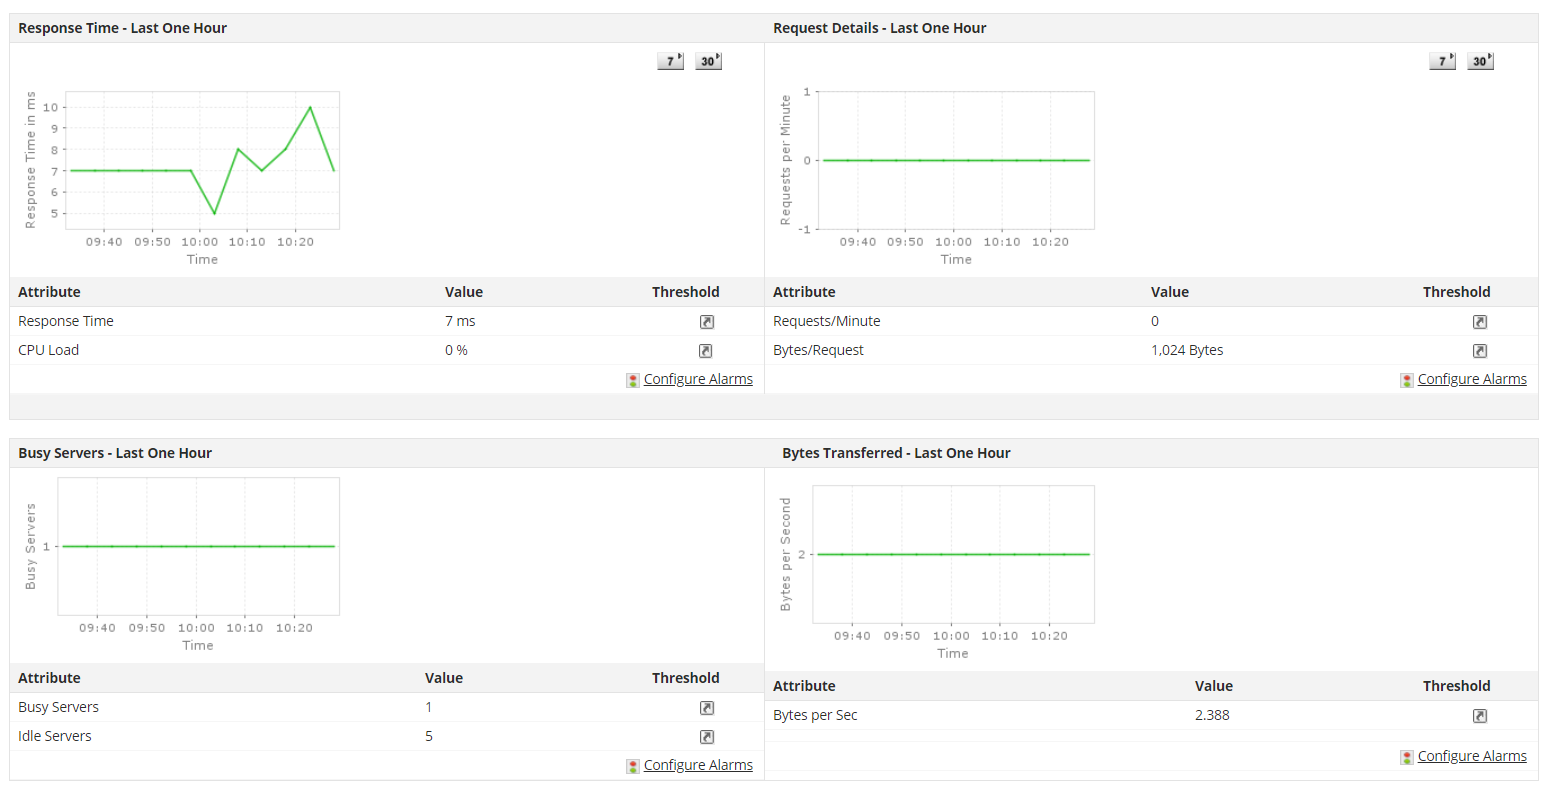
ManageEngine tracks and monitors most Apache web server metrics. It features performance dashboards and highly configurable alerts that make it easier to understand and troubleshoot server performance. You can set up thresholds for various metrics to easily find out when it’s going beyond its expected range.
ManageEngine is a great option if you want to monitor a single instance or small-scale clusters of the Apache HTTP Server, as there is a free version even after the trial period ends. Although the features are limited, it should be enough for basic server monitoring.
Although most of the other monitoring tools listed offer reporting and alerting features, ManageEngine has become the standard for these capabilities, offering a number of integrations for alerting such as email and SMS.
Pros
- Free version beyond the trial period
- Provides wide integrations with RESTful APIs
Cons
- Inconsistent reporting
- Some false positive alerts
Pricing
There is a 30-day trial. After that, the plan is automatically converted into a free edition. You can request a quote for the professional or enterprise editions.
9. Site24x7
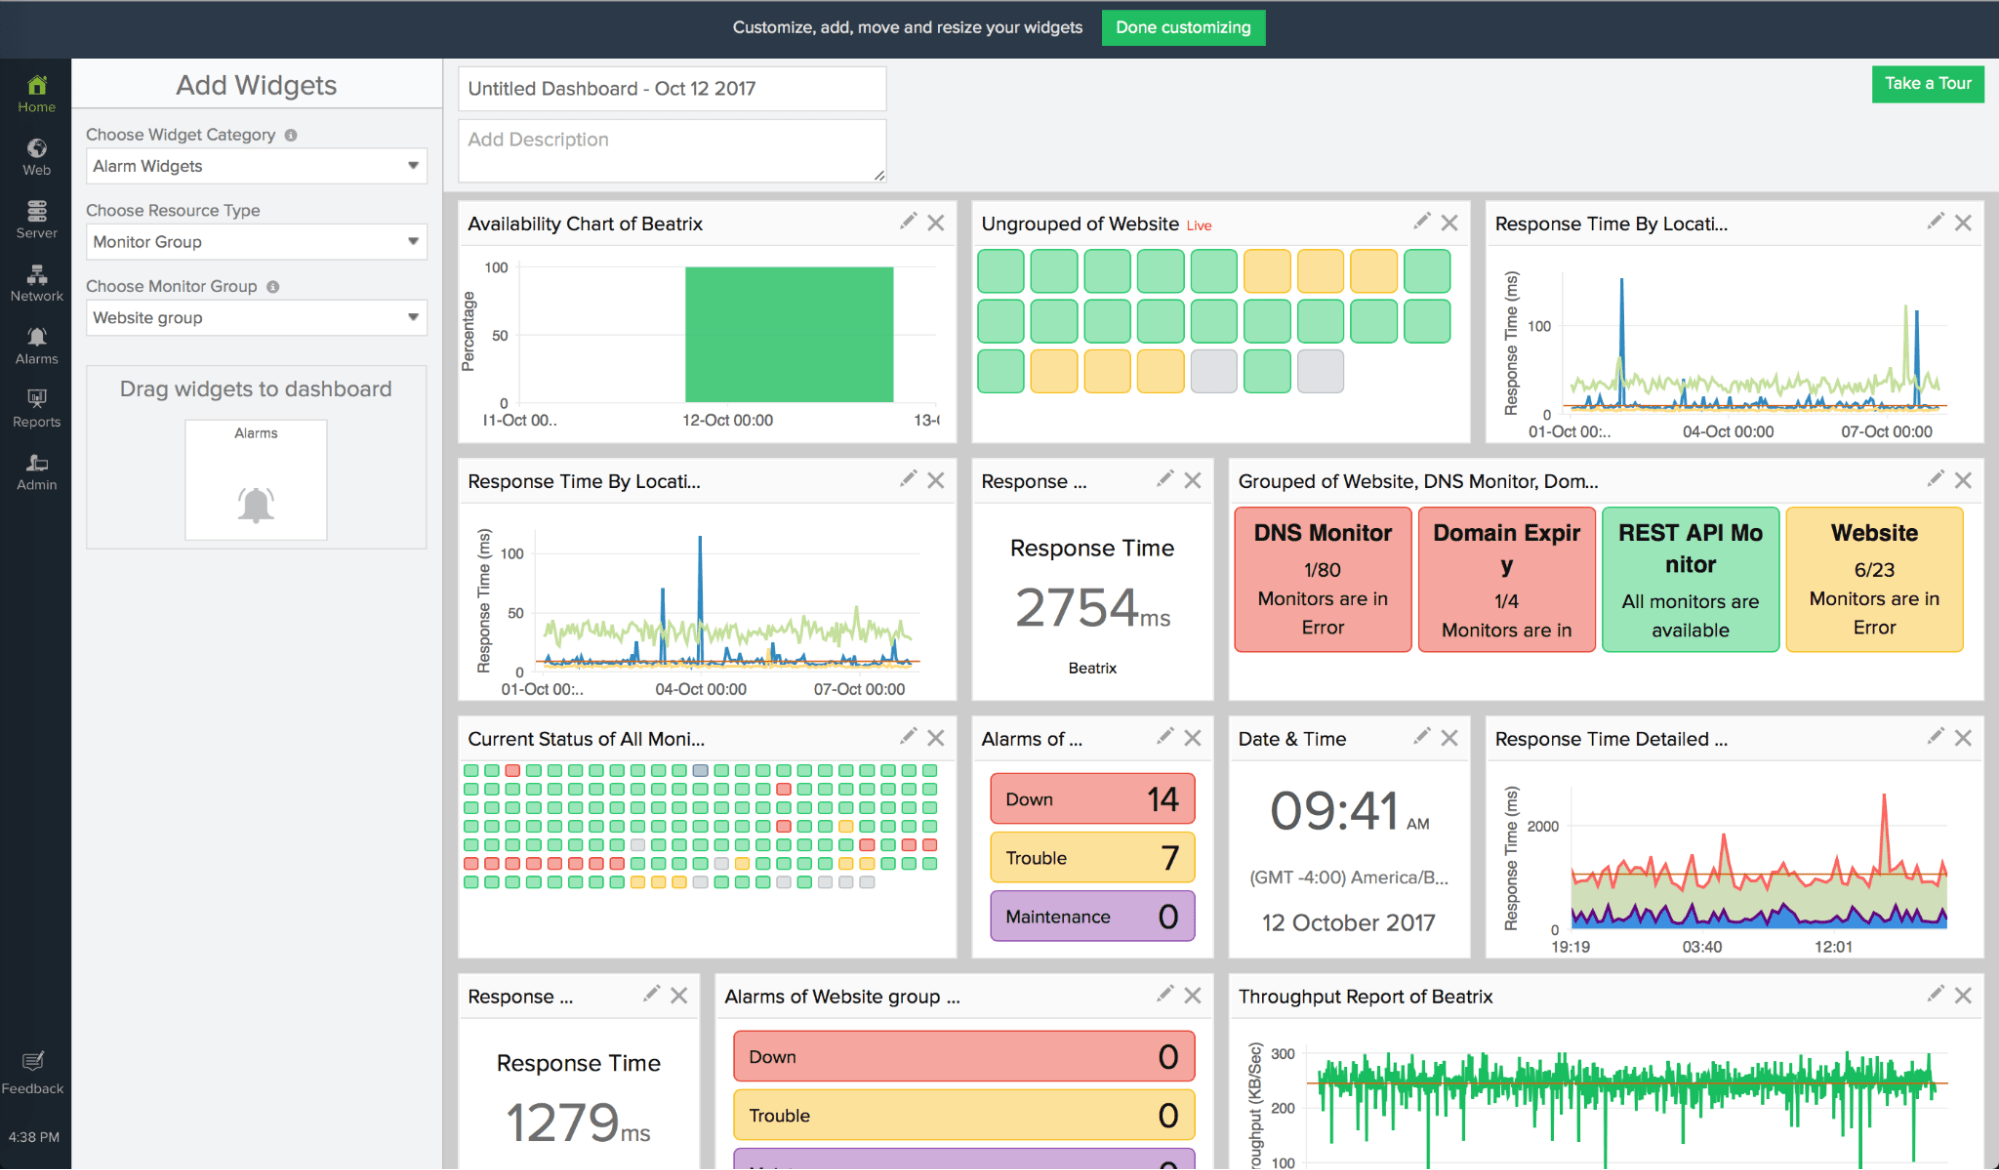
Site24x7 is one of the easiest tools to integrate and use for monitoring Apache web servers. Much like most other monitoring tools, it connects to the server using a module, so you will need to enable the mod_status module on the Apache server. Because Site24x7 uses a Python script to connect to the server, you’ll need to have Python installed as well.
Similar to other Apache monitoring (or httpd server monitoring) tools, Site24x7 can monitor almost all metrics exposed by the status module. Once configured, it pings the server to be monitored at set intervals to collect the latest metrics values. With Site24x7, you can create charts and dashboards that will show you the overall health status of your web server.
Site24x7 can also monitor network devices in your infrastructure, such as routers, switches, etc. This, combined with other monitoring data can provide additional insights into potential bottlenecks.
Pros
- Alerting system with multiple options, including automated phone calls
- Small learning curve
Cons
- Need to open ports to external systems for Site24x7 to collect metrics
- Frequent delays in notifications and false positives
Pricing
There is a 30-day trial period, after which the cost is $9 per month for monitoring 10 servers.
Want to see how Sematext stacks up? Check out our page on Sematext vs Site24x7.
Conclusion
When using Apache to serve a website or web app, it’s crucial to monitor the web server to make sure everything is working as expected. This helps you find and debug performance issues, as well as decide when to scale up and down your servers.
When setting up your monitoring strategy, it’s important to know which key Apache web server metrics can help you maintain the health of your web server. Then, you just need a robust monitoring and alerting tool, such as Sematext’s Apache Monitoring integration, to notify you so you can take care of potential issues.
Sematext offers a free 14-day trial so you can test-drive all of its features. Try it out for yourself!
You might also be interested in:
Author Bio

Sunny Srinidhi
Sunny has been working in the data space for over seven years. He writes microservices to work with data at scale and has experience using a variety of databases, including MySQL, MongoDB, DynamoDB, Couchbase, Amazon Athena, and Apache HBase. He is currently working on a Customer 360 product that is intelligently unifying customer data from multiple sources at scale.