Ubuntu is a Linux distribution based on Debian Linux that’s mostly composed of open-source and free software. Released in three options – servers, desktop computers and Internet of Things devices.
Ubuntu is highly popular, reliable and updated every 6 months, with a long-term support version released every two years. Multiple Ubuntu versions allow users to choose whether to stick with the long-term support version or the recently updated one. But no matter which version you opt for, you need full visibility into the system’s health.
In this article, I will review the top performance monitoring tools for your Ubuntu machine, whether it’s bare metal or virtual. I’ll compare their pros, cons and pricing to help you choose the one suitable for you.
1. Sematext
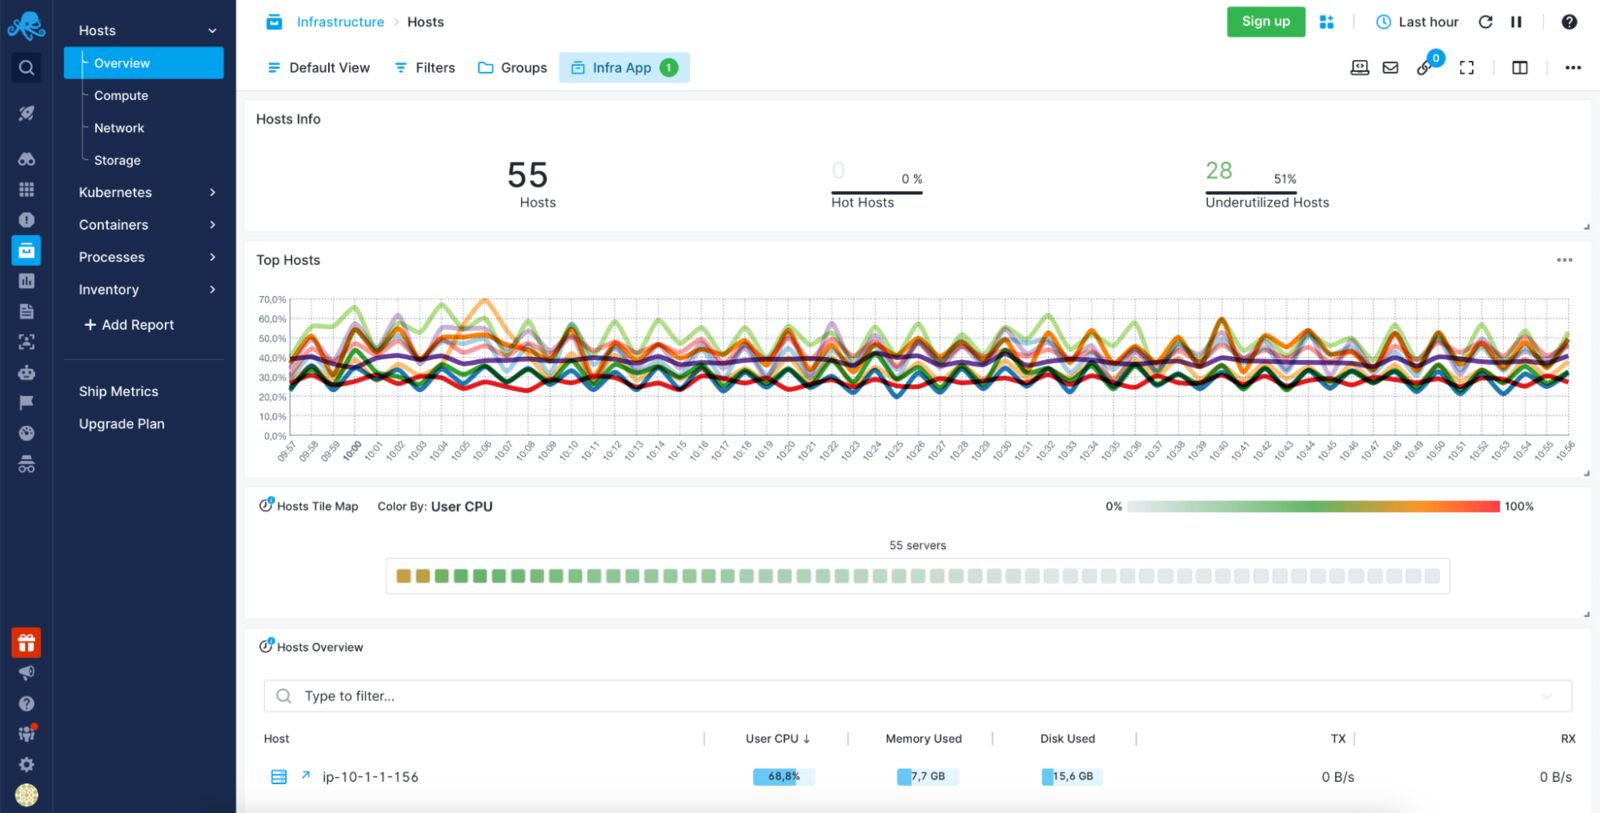
Sematext Monitoring is a full-stack observability tool with Ubuntu monitoring capabilities. Extremely easy to use, it provides the complete overview of your infrastructure including your Ubuntu bare metal servers and virtual machines. It not only provides the metrics related to the operating system itself such as CPU and memory utilization, but allows to look into the top processes and installed packages and compare them across other systems you monitor. On top of that you get the powerful alerting engine with anomaly detection and scheduling allowing you to avoid alerts fatigue and be notified when necessary.
Pros
- Quick and straightforward installation whether you run your Ubuntu on bare metal or virtual machines.
- Processes overview and the per-machine top processes to quickly identify the most resource-hungry processes running on your Ubuntu servers.
- Alerting and anomaly detection on metrics and logs generated by Ubuntu and the applications running on them.
- Inventory functionality for monitoring discrepancies between the packages installed on your servers and keeping.
- Efficient top hosts overview allows you to identify the under-performing hosts for fast and easy troubleshooting.
- Part of the Sematext Cloud suite, it allows easy integration with Sematext Logs for quick correlation between Ubuntu logs and metrics for faster root cause analysis.
Cons
- Limited support for transaction tracing.
- Lack of full-featured profilers.
Pricing
Sematext pricing is straightforward and flexible, depending on your needs. Ubuntu monitoring is metered by the hour, making it suitable for dynamic environments that scale up and down. It starts with the Standard plan at $3.6 per host per month and 7 days of data retention, and goes up to the Pro plan at $5.76 per host per month. You can try Sematext Ubuntu Monitoring for free for 14 days.
For more information on Sematext Monitoring, check out the video below:
2. Nagios
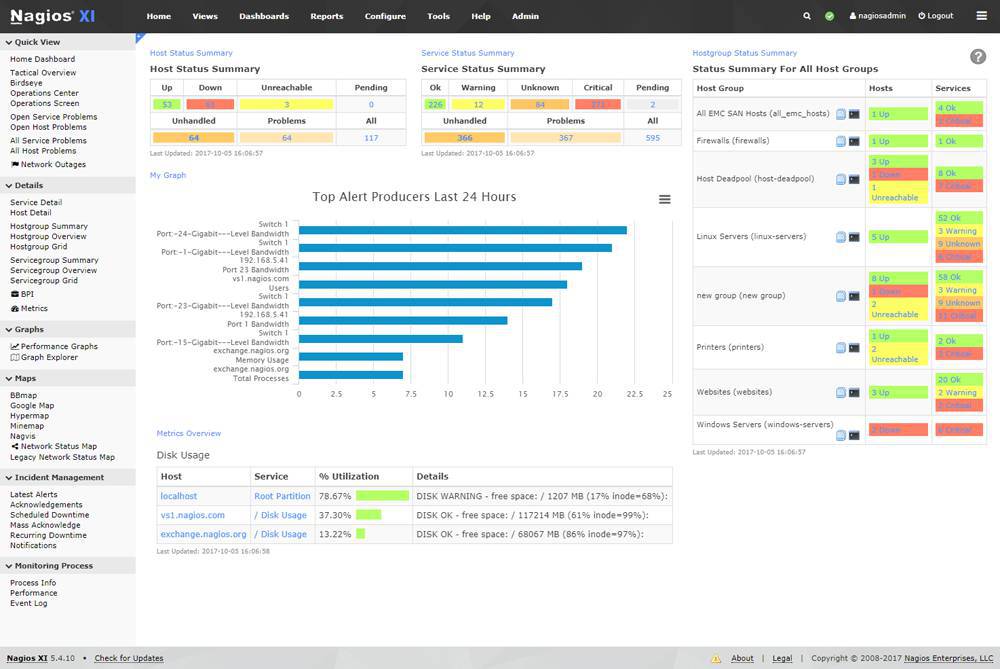
Nagios is one of the most mature and popular monitoring tools available on the market, with support for Ubuntu monitoring. It is a common go-to choice due to its extensive set of plugins available out of the box and the pluggable architecture. It supports alerting and scripting capabilities allowing you to monitor virtually any metric generated by the applications and platforms used in your systems.
Nagios comes in two flavors: Nagios Core, an open-source solution with a limited set of features, but that has garnered a well-established community; and Nagios XI, an enterprise-grade, commercial solution with a broader feature set.
Pros
- One of the most mature monitoring solutions on the market with a user-friendly GNU GPL license.
- Alerts with escalation capabilities inform you about virtually any abnormalities of your Ubuntu system metrics.
- Scripting API allows you to monitor virtually anything, not only Ubuntu.
- Nagios XI includes capacity planning for your Ubuntu machines, powerful data visualization, configuration wizard and infrastructure management.
Cons
- More advanced features are available only in the commercial Nagios XI.
Pricing
Nagios Core is free and open-source. Nagios XI is built on Nagios Core, having more features and two different pricing tiers – Standard, which starts at $1995 per 100 nodes, and Enterprise, which starts at $3495.
3. SolarWinds Server & Application Monitor
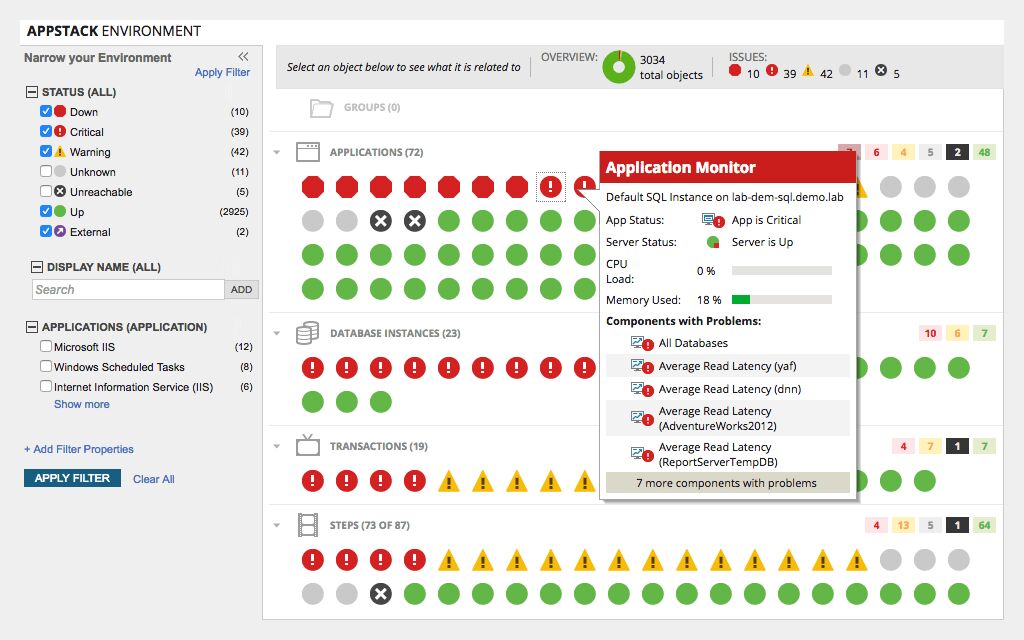
SolarWinds is a full-stack cloud performance monitoring platform available as a SasS, with full support for monitoring of your Ubuntu server infrastructure. It features out-of-the-box and intuitive dashboards where you can visualize and analyze all the key Ubuntu metrics, including CPU, memory, I/O and network-related ones. With SolarWinds, you get real-time monitoring, as well as alerting and reporting for proactive issues detection and resolution.
Pros
- Pre-built dashboards allow you to start monitoring your Ubuntu host immediately.
- Infrastructure visibility that goes beyond the necessary Ubuntu metrics – it also offers support for distributed tracing, live code profiling, exception tracking and root cause summary for your applications running on top of Ubuntu machines.
- Infrastructure dependency mapping to see how the services running on your Ubuntu hosts (and not only) interact with each other.
- Tail-like functionality for logs for quick and efficient logs streaming in a DevOps-friendly way. It supports log encryption, making it easy to centralize the logs from all your Ubuntu machines.
Cons
- Pricing based on packs of hosts.
Pricing
SolarWinds’ pricing depends on the functionalities you’ll be using. For example, the infrastructure monitoring solution for Ubuntu starts at $9.99 per host per month; but you can only buy it in packs of 10 hosts and 100 containers. If you want to monitor the applications running on your Ubuntu hosts, infrastructure and application monitoring cost $24.99 per host per month with the same package approach.
4. Glances
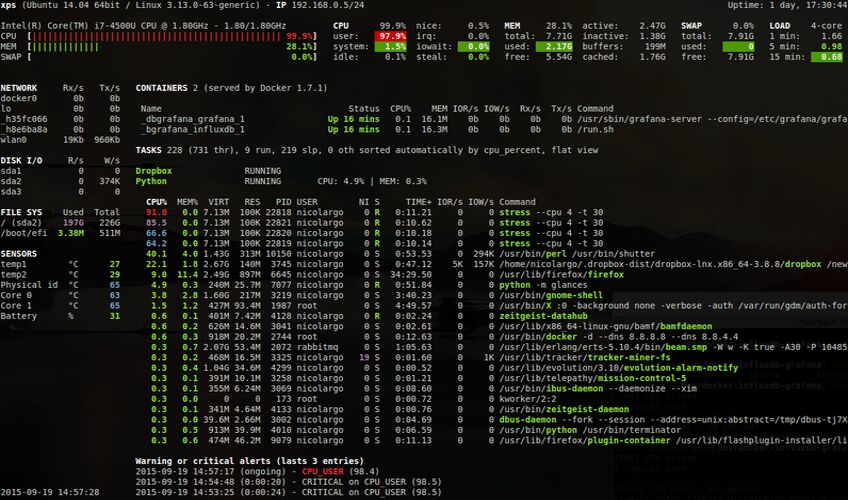
Glances is an open-source, cross-platform observability tool written in Python that allows real-time monitoring of various aspects of your Ubuntu system, including CPU, memory, disk, and network usage. It monitors basic Ubuntu system metrics and less common ones such as component temperatures, voltages, and fan speeds – these can be useful when using bare metal servers. You can view all these metrics in the web interface or a dashboard in the command line.
Pros
- Extremely easy to use.
- Possibility of exporting the metrics into data stores like InfluxDB, OpenTSDB, Cassandra, StatsD, and Elasticsearch, allowing you to use Glances as the source of your Ubuntu metrics.
- Written in Python and cross-platform, meaning that you can use it for more than Ubuntu monitoring.
Cons
- By default, Glances doesn’t provide any mechanism for alerting and notifications.
Pricing
Glances is an open-source and free tool for monitoring Ubuntu servers.
5. Stacer
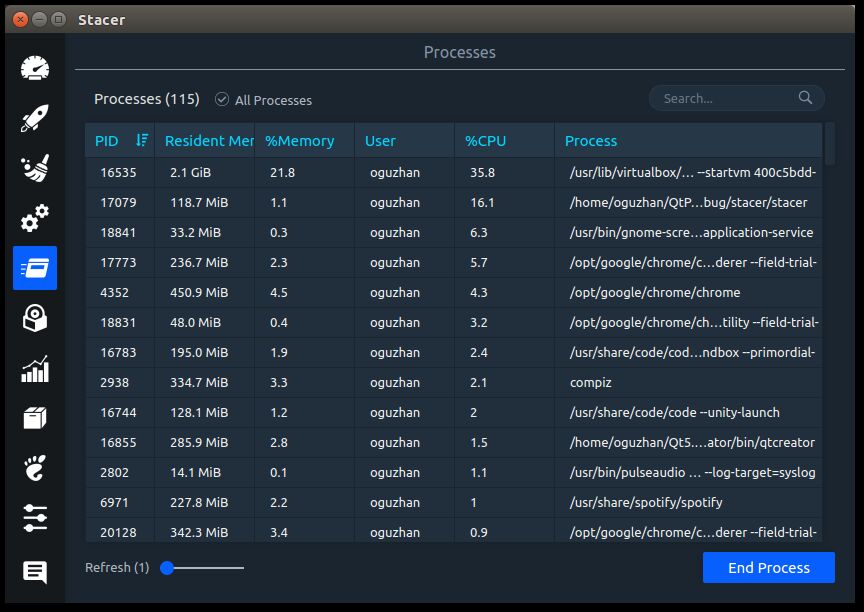
Stacer is an open-source system optimizer and application monitor that enables you to monitor Ubuntu metrics and helps with system management as well. The latter is, in fact, its main functionality. It is a graphical tool that allows you to see and manage startup applications, clean package caches, control running services, remove applications, and monitor processes.
Pros
- Graphically appealing Ubuntu resource monitoring with metrics such as CPU, memory, disk usage, and more.
- Process monitoring enables you to identify the most resource-consuming processes.
- Services manager helps you to understand which services are running and to stop or start them with a single click.
Cons
- Not suitable for server environments due to dependencies that its graphical design might require – these dependencies are often not installed on production servers.
- Lack of notifications and alerting of any kind.
Pricing
Stancer is a free and open-source tool for Ubuntu performance monitoring.
6. GNOME System Monitor
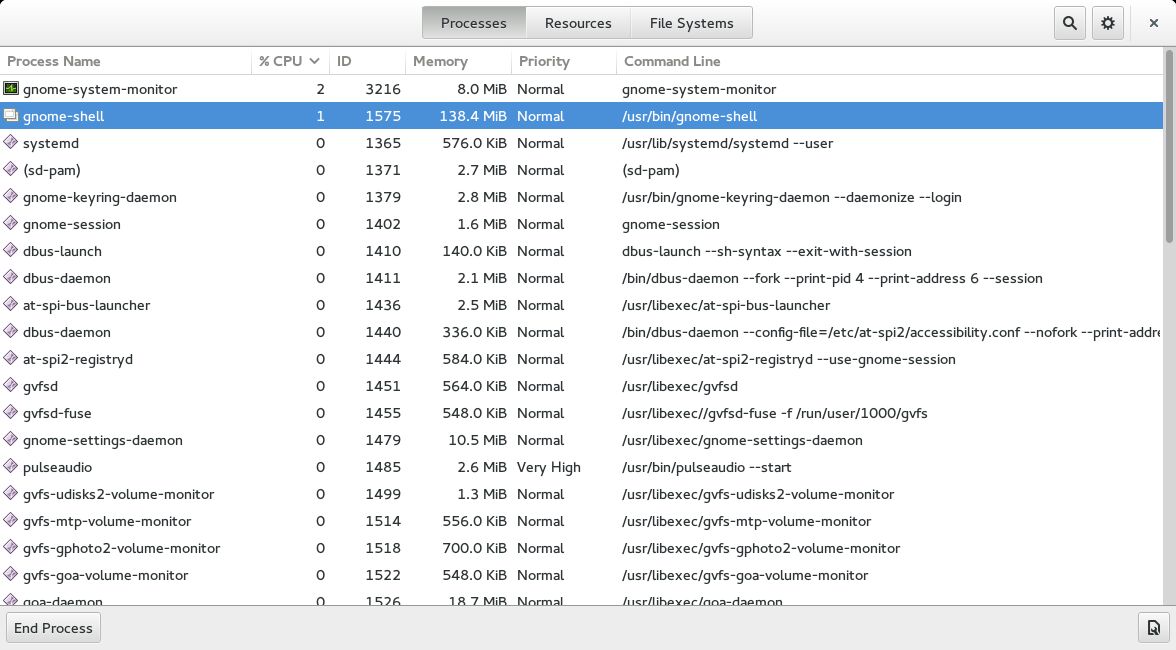
GNOME System Monitor is a system monitor and process viewer with a clean and simple interface, which can be found pre-installed. It allows you to monitor all the necessary Ubuntu system metrics, such as CPU utilization, memory utilization, network usage, and swap along with disk utilization and open files support. With GNOME’s process viewer, you can see the processes and their dependencies; this enables you to quickly identify the most resource-intensive ones and even kill them from the graphical interface.
Pros
- Easy to use, providing the necessary metrics for your Ubuntu operating system.
- Powerful process monitoring with dependencies allowing quick and easy identification of processes consuming the most resources.
Cons
- Lack of alerting and notification mechanism.
- Not suitable for server environments due to dependencies that its graphical design might require – these dependencies are often not installed on production servers.
Pricing
GNOME is an open-source tool that is free to use under the GNU Public License 2.0.
7. AppDynamics
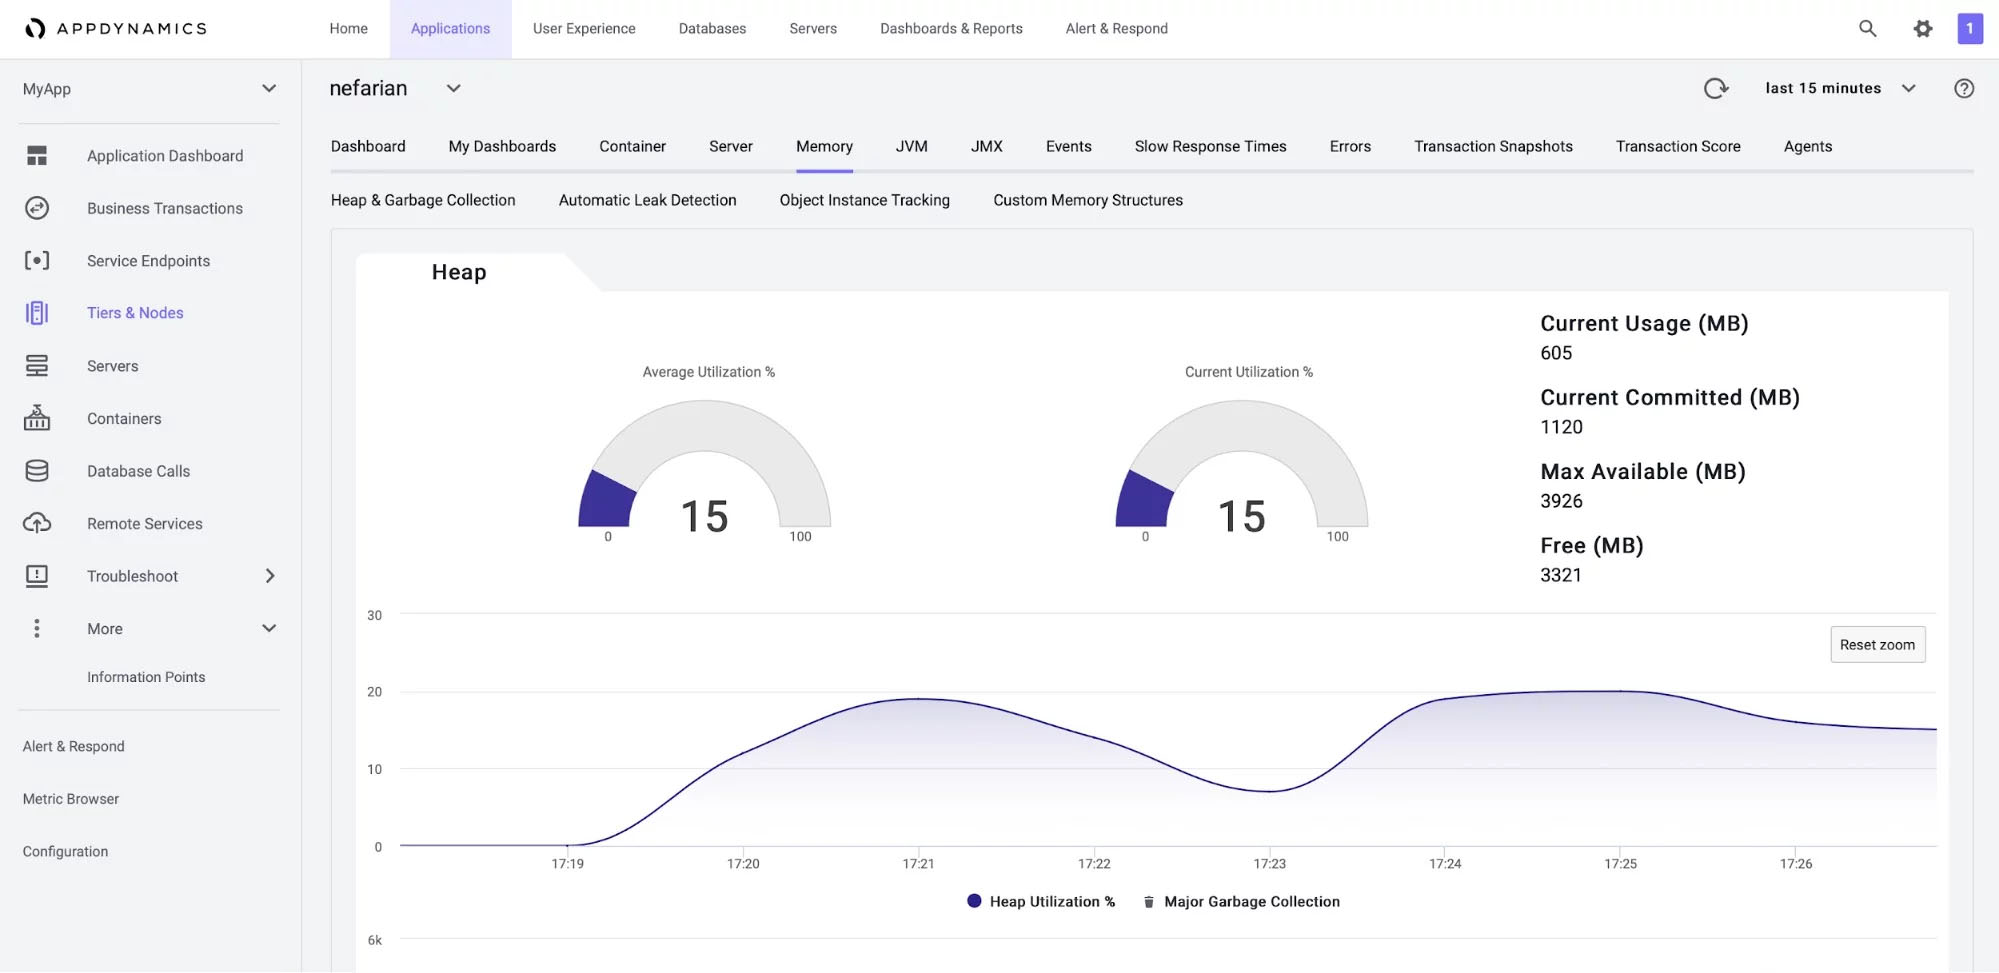
AppDynamics is an observability tool for monitoring your Ubuntu bare metal servers and virtual machines and the applications running on them. Available in both SaaS and on-premise models, the solution is especially aimed at large enterprises. That’s because it provides a wide range of infrastructure and application metrics that you can easily correlate with business-level metrics, to gain unique insights that improve system performance. AppDynamics gives you complete visibility into your environment, from top-level transactions that business executives understand to code-level information useful for DevOps and developers.
Pros
- Ubuntu monitoring with network components and server visibility features, providing information about status, utilization, and flow between elements.
- Alerting with email templating, delivering the necessary information about your Ubuntu-based infrastructure when needed.
- Visibility into connections between the system components, environment elements, endpoint response times, and business transactions.
- Machine Learning based anomaly detection and root cause analysis features enable faster troubleshooting of your Ubuntu machines and the applications running on them.
Cons
- Can be expensive for larger deployments as the pricing depends on CPU Cores.
- Installation of the agent requires manual download and starting of the agent – no one-line installation and setup command.
Pricing
AppDynamics pricing depends on the plan and the monitoring needs. The basic infrastructure monitoring is available for $6/month per machine CPU Core.
Want to see how Sematext stacks up? Check out our page on Sematext vs AppDynamics.
8. Dynatrace
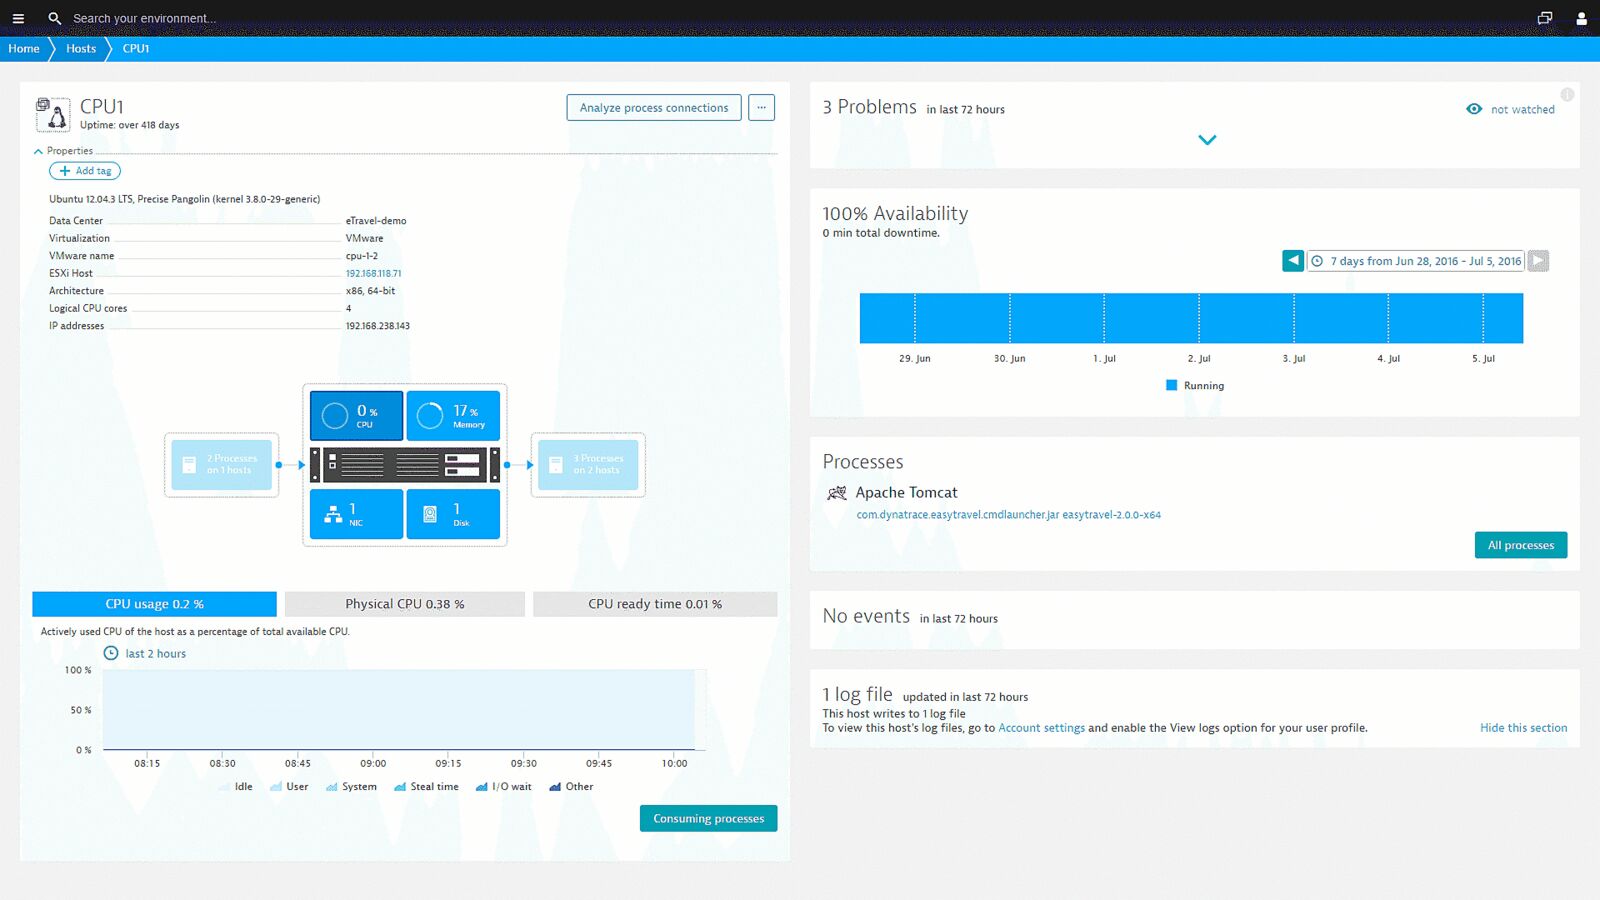
Dynatrace is a full-stack observability solution that offers a user-friendly approach to monitoring your Ubuntu machines. It supports a single running agent that, once installed, can be easily controlled via the Dynatrace UI-making monitoring. Available on-premise and as a SaaS, it will fulfill most of your monitoring needs regarding monitoring the health and performance of your Ubuntu servers and many other components of your infrastructure.
Pros
- Real-time Ubuntu monitoring, enabling you to detect and respond to issues as soon as they appear.
- Diagnostic tools that allow taking memory dumps, exceptions and CPU analysis, top database, and web requests.
- Supports all major cloud providers – Amazon Web Services, Microsoft Azure, and Google Cloud Platform.
- Dedicated problem-solving functionalities to help in quick and efficient detection.
Cons
- Complex set of features that can be overwhelming at the beginning, but the solution tries to do its best to help new users with helpful descriptions and instructions.
- Can be expensive for smaller organizations, as it’s a premium solution.
Pricing
The pricing for Dynatrace’s infrastructure monitoring features depends on your hardware, specifically the memory you use. It starts at $22 per month for 8GB per host when billed annually.
Want to see how Sematext stacks up? Check out our page on Sematext vs Dynatrace. We also wrote about Dynatrace alternatives and how each compares to it.
While the full-stack monitoring solutions and tools are nice, there are other ways to monitor your Ubuntu servers that come free of charge – command-like tools that provide all the data that are critical to ensuring the health and performance of your machines.
There are various pros for the command line tools including:
- Widely available and open-sourced in most cases
- Simple to install and use
- Provide quick view of the Ubuntu metrics for efficient, host-oriented troubleshooting
- Can provide more detailed metrics compared to SaaS solutions that are focused on high-level monitoring
However, there are also downsides, such as:
- Lack of support for alerting and long term monitoring (with exceptions)
- No distributed monitoring, meaning you are looking at a single host metrics
- In most cases lack of support for historical data, which makes them not a go to tool for post-mortem analysis.
Let’s have a look at some of the most popular ones.
9. Htop
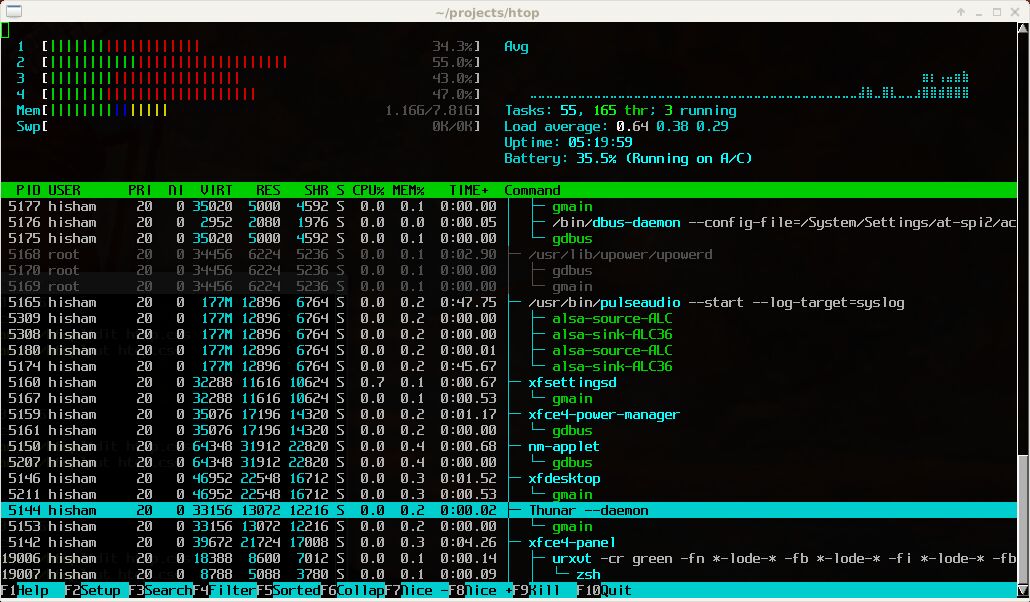
Htop is a cross-platform, command line-based interactive process viewer allowing you to see and navigate the processes running on your Ubuntu machine. It provides small, graphical information about metrics such as CPU core utilization, memory utilization, and swap memory usage. You also get a live view of the number of tasks, the average load, and the uptime of your host. With Htop, you can configure I/O scheduling and CPU affinity for displayed processes. The console can be customized with a dark or light theme to make it more appealing to you.
10. BashTop
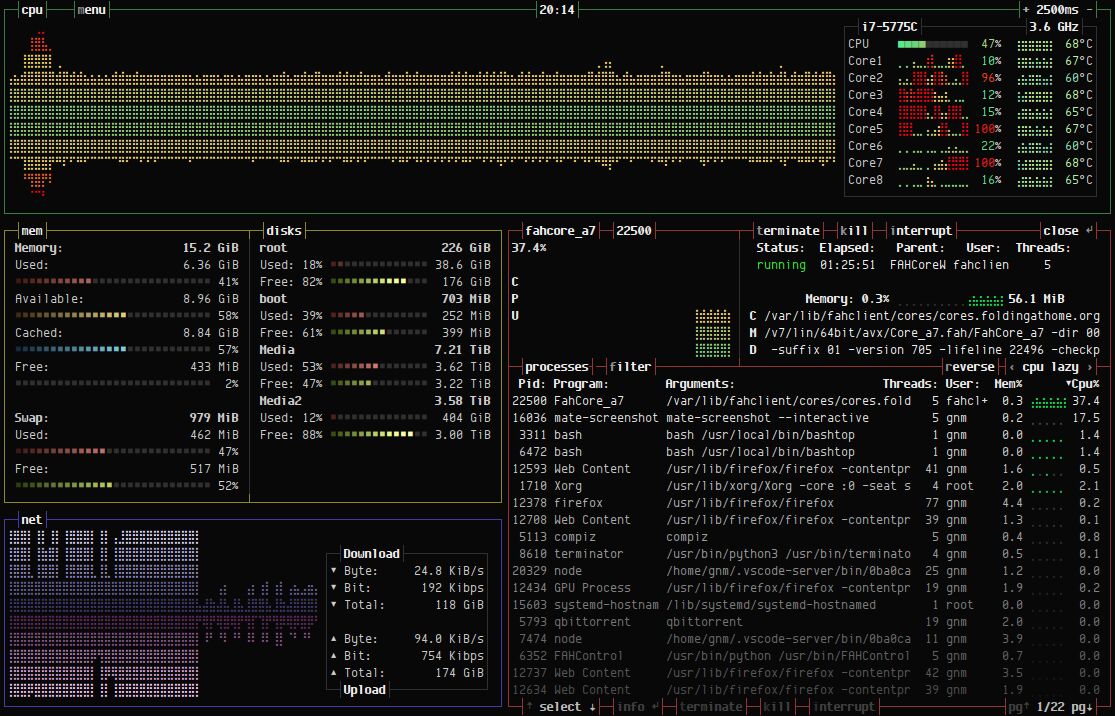
BashTop is a command-line-based system resource monitor with Ubuntu support that can track system metrics such as CPU utilization, memory usage, I/O, network, and processes. It offers detailed monitoring of the processes with easy sorting switching, auto-scaling for network graph usage, and the current speed of the system hard drives. You can easily filter processes to find the ones you are interested in and send signals like SIGTERM, SIGKILL, and SIGINT. In a nutshell, BashTop gives you everything you may want from such a tool. In addition, BashTop supports themes for you to customize to your liking.
11. Vtop
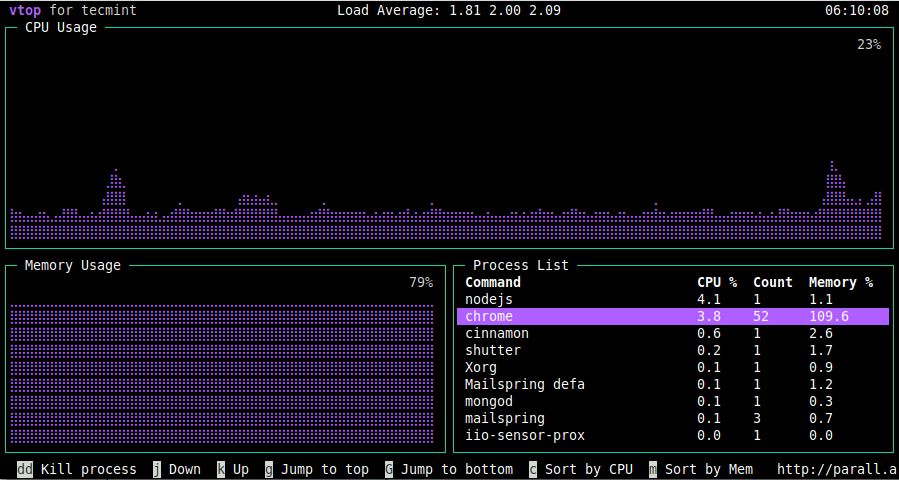
Vtop is an open-source, MIT-licensed graphical activity monitor written in Node.js that supports various platforms, including Ubuntu-based ones. It provides information about system wide CPU and memory usage and a detailed view of the processes running on the server, including their count, CPU, and memory usage. It even supports killing the processes if needed.
Vtop was developed to address the limitations of tools like top in visualizing CPU usage across multi-process applications. By comparison, it visualizes data using Unicode braille characters, a distinct feature rarely found in similar tools.
12. Atop
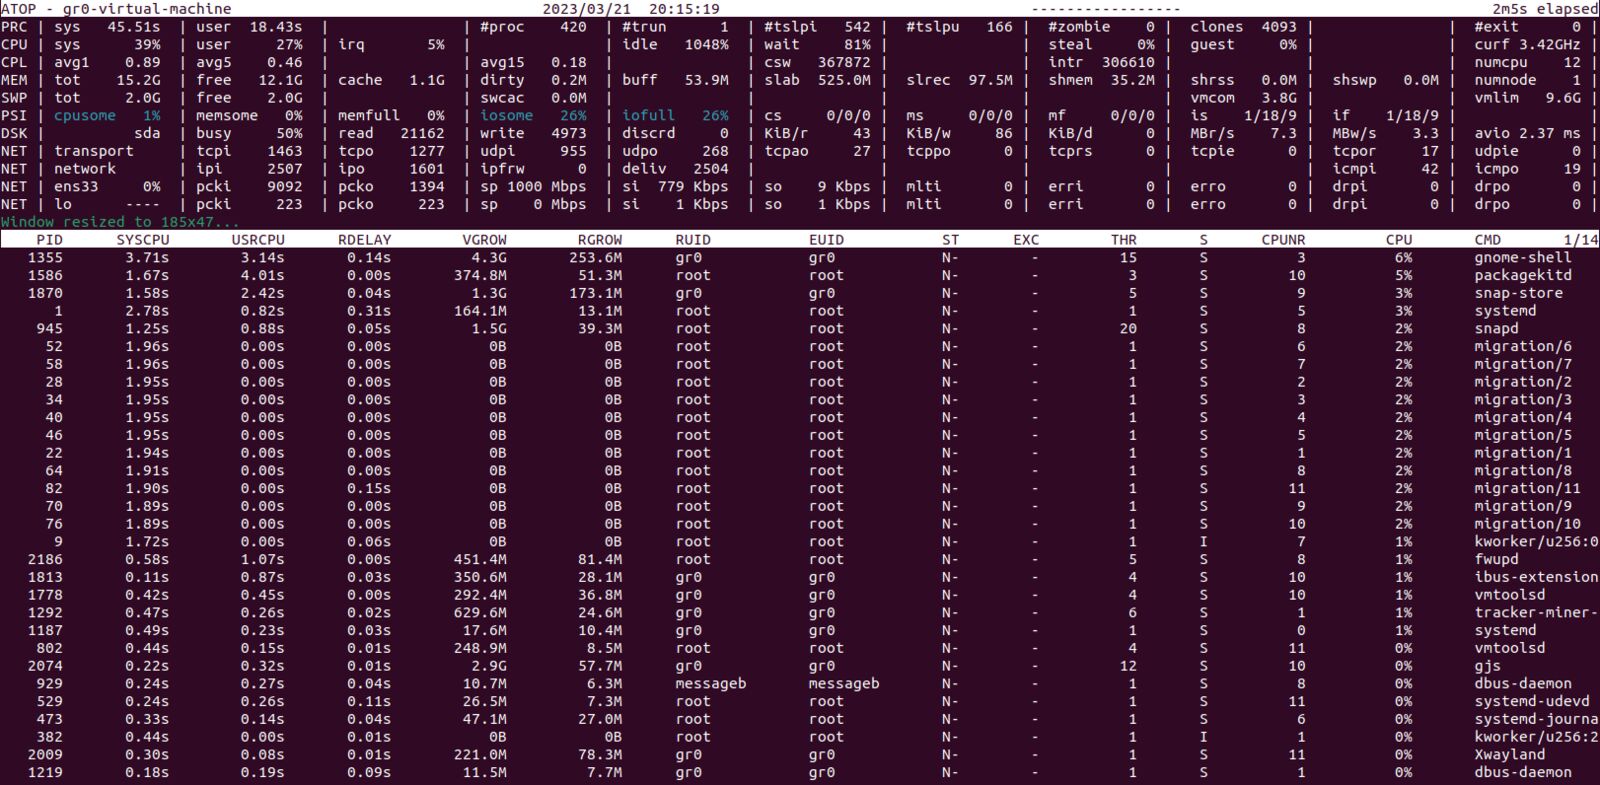
Atop is a command-line-based, full-screen Linux performance monitoring tool supporting Ubuntu. You can use it to monitor the critical system metrics such as CPU, memory, swap, disks, and network layer. It can also report the activity of all the processes running on the machine and also log processes and system metrics for long-term analysis. Most importantly, Atop is capable of pointing out the overloaded system resources. With additional, optional kernel modules, it can provide information per process/thread network activity and about the system’s GPU activity.
13. Gotop
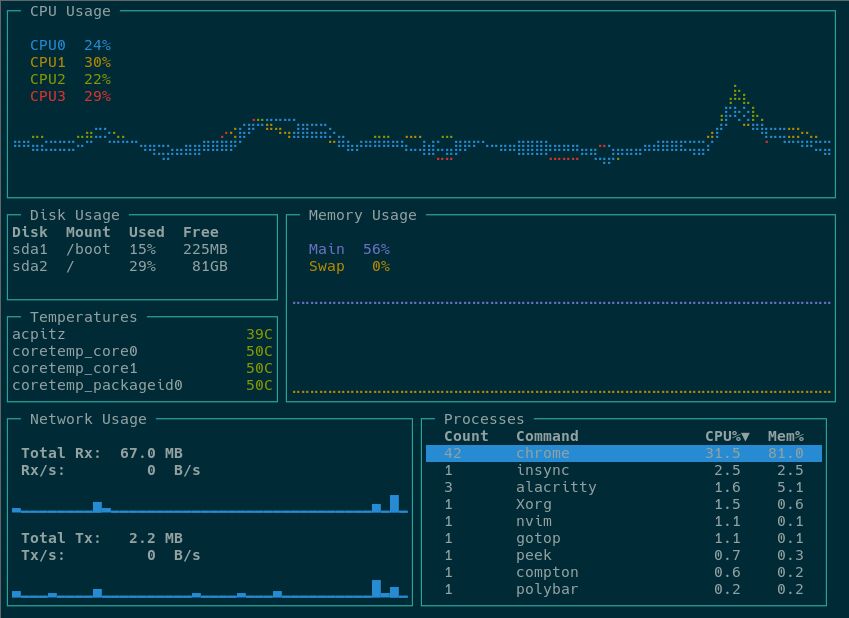
Gotop is a monitoring tool written in Go that supports various operating systems, including Ubuntu. It provides the basic metrics to understand the system’s status, such as CPU, disk, and memory usage, temperatures, and network usage. In addition, you can also view the process data such as per-process CPU and memory utilization.
The nice thing about Gotop is that it can monitor other Gotop instances running on remote machines and provide the information within a single instance. However, to do this, you’ll need to follow additional security steps that are not part of the Gotop itself.
14. Nmon
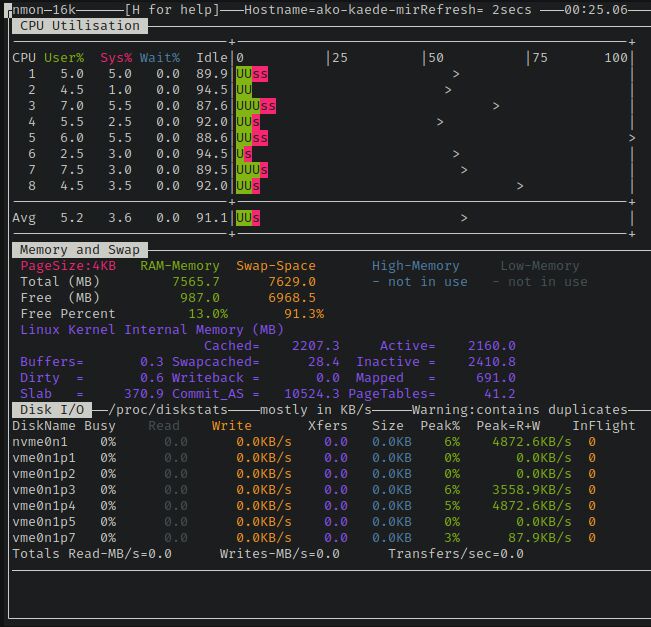
Nmon is a system monitoring tool for AIX and Linux operating systems, including Ubuntu. It provides all the metrics needed to get an overview of the health and performance of your Ubuntu server, including CPU utilization, memory utilization, I/O statistics, swap, and paging. It displays per CPU-related metrics in both numeric and visual styles, enabling you to identify overloaded CPU cores quickly. Nmon can work in two modes – live, on-screen monitoring, or writing the metrics into a CSV file for later analysis and visualization.
Conclusion
The tool that you will choose for monitoring your Ubuntu systems depends on whether you need it for constant and daily analysis or for ad-hoc metrics view.
If it’s the former, you want a solution that monitors more than your operating system. You should look for a full-stack monitoring tool that provides visibility across your entire infrastructure, including your applications, their logs, and dependencies.
For ad hoc monitoring, on the other hand, it’s enough if the tool provides just the metrics you are interested in.
In short, go with the tool that’ll help you easily and quickly detect and diagnose performance bottlenecks and issues specific to your use case. Further, you should consider the best server monitoring tools for the general market, when making your final decision.
With its broad set of features, Sematext Monitoring is a great tool for troubleshooting Ubuntu performance monitoring problems. Start the 14-day free trial and see for yourself.