When it comes to centralizing logs to Elasticsearch, the first log shipper that comes to mind is Logstash. People hear about it even if it’s not clear what it does:
– Bob: I’m looking to aggregate logs
– Alice: you mean… like… Logstash?
When you get into it, you realize centralizing logs often implies a bunch of things, and Logstash isn’t the only log shipper that fits the bill:
- fetching data from a source: a file, a UNIX socket, TCP, UDP…
- processing it: appending a timestamp, parsing unstructured data, adding Geo information based on IP
- shipping it to a destination. In this case, either Sematext Logs or Elasticsearch. Sematext Logs has an Elasticsearch API so shipping logs there is just as simple as shipping to an Elasticsearch instance. Keep in mind, the shipper should ideally be able to buffer and retry log shipping because Elasticsearch can be down or struggling, or the network can be down.
Use Logstash or any Logstash alternative to send logs to Sematext Logs – Hosted ELK as a Service. Get Started
In this post, we’ll describe Logstash and 5 of the best “alternative” log shippers (Logagent, Filebeat, Fluentd, rsyslog and syslog-ng), so you know which fits which use-case depending on their advantages.
If you want to jump right to Sematext Logs and understand how to use them to centralize your logs, then check out this short video below.
Logstash
Logstash is not the oldest shipper of this list (that would be syslog-ng, ironically the only one with “new” in its name), but it’s certainly the best known. That’s because it has lots of plugins: inputs, codecs, filters and outputs. Basically, you can take pretty much any kind of data, enrich it as you wish, then push it to lots of destinations.
Typical use cases: What is Logstash used for?
Logstash is typically used for collecting, parsing, and storing logs for future use as part of a log management solution.
Logstash Advantages
Logstash’s main strongpoint is flexibility, due to the number of plugins.
Also, its clear documentation and straightforward configuration format means it’s used in a variety of use-cases. This leads to a virtuous cycle: you can find online recipes for doing pretty much anything.
Here are a few Logstash recipe examples from us: “5 minute tutorial intro”, “How to reindex data in Elasticsearch”, “How to parse Elasticsearch logs”, “How to rewrite Elasticsearch slowlogs so you can replay them with JMeter”.
Logstash Disadvantages
Logstash’s biggest con or “Achille’s heel” has always been performance and resource consumption (the default heap size is 1GB).
Though performance improved a lot over the years, it’s still a lot slower than the alternatives. We’ve done some benchmarks comparing Logstash to rsyslog and to filebeat and Elasticsearch’s Ingest node.
This can be a problem for high traffic deployments, when Logstash servers would need to be comparable with the Elasticsearch ones. That said, you can delegate the heavy processing to one or more central Logstash boxes, while keeping the logging servers with a simpler – and thus less resource-consuming – configuration. It also helps that Logstash comes with configurable in-memory or on-disk buffers:
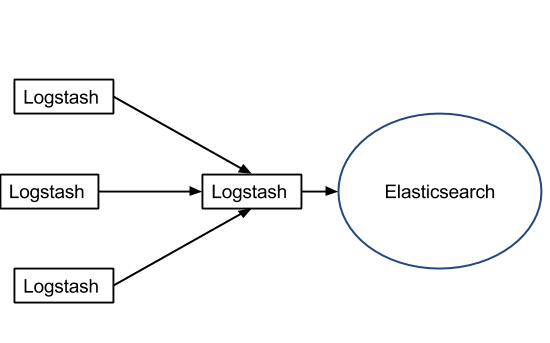
Because of the flexibility and abundance of recipes, Logstash is a great tool for prototyping, especially for more complex parsing.
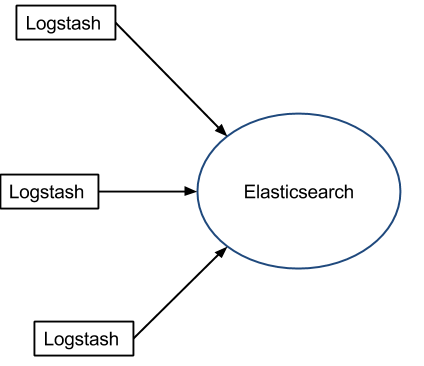
If you have big servers, you might as well install Logstash on each. You won’t need much buffering if you’re tailing files, because the file itself can act as a buffer (i.e. Logstash remembers where it left off):
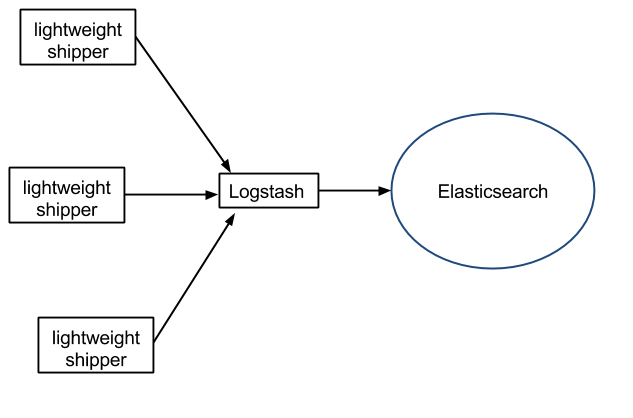
If you have small servers, installing Logstash on each is a no go, so you’ll need a lightweight log shipper on them, that could push data to Elasticsearch through one (or more) central Logstash servers:
As your logging project moves forward, you may or may not need to change your log shipper because of performance/cost.
When choosing whether Logstash performs well enough, it’s important to have a good estimation of throughput needs – which would predict how much you’d spend on Logstash hardware.

Log Management & Analytics – A Quick Guide to Logging Basics
Looking to replace Splunk or a similar commercial solution with Elasticsearch, Logstash, and Kibana (aka, “ELK stack” or “Elastic stack”) or an alternative logging stack? In this eBook, you’ll find useful how-to instructions, screenshots, code, info about structured logging with rsyslog and Elasticsearch, and more. Download yours.
Logstash vs Logagent
This is our log shipper that was born out of the need to make it easy for someone who didn’t use a log shipper before to send logs to Sematext Logs (our log management software that exposes the Elasticsearch API). And because Sematext Logs exposes the Elasticsearch API, Logagent can be just as easily used to push data to your own Elasticsearch cluster.
Logagent Advantages
The main one is ease of use: if Logstash is easy (actually, you still need a bit of learning if you never used it, that’s natural), Logagent really gets you started in a minute. It tails everything in /var/log out of the box, parses various logging formats out of the box (Elasticsearch, Solr, MongoDB, Apache HTTPD…).
It can mask sensitive data like PII, date of birth, credit card numbers, etc. It will also do GeoIP enriching based on IPs (e.g. for access logs) and update the GeoIP database automatically. It’s also light and fast, you’ll be able to put it on most logging boxes (unless you have very small ones, like appliances).
Like Logstash, Logagent has input, filter and output plugins. Persistent buffers are also available, and it can write to and read from Kafka.
Logagent Disadvantages
Logagent is still young, although is developing and maturing quickly. It has some interesting functionality (e.g. it accepts Heroku or Cloud Foundry logs), but it is not yet as flexible as Logstash.
To summarize the main differences between Logstash and Logagent are that Logstash is more mature and more out-of-the-box functionality, while Logagent is lighter and easier to use.
Logagent Typical use-cases
Logagent is a good choice of a shipper that can do everything (tail, parse, buffer) that you can install on each logging server. Especially if you want to get started quickly.
Logagent can easily parse and ship Docker containers logs. It works with Docker Swarm, Docker Datacenter, Docker Cloud, as well as Amazon EC2, Google Container Engine, Kubernetes, Mesos, RancherOS, and CoreOS, so for Docker log shipping, this is the tool to use.
Sematext Logs also offers a preconfigured, hosted Logagent, at no additional cost. This is useful if you want to ship logs from journald, if you want to centralize GitHub events, or if you’re using a PaaS such as Cloud Foundry or Heroku.
Logstash vs Filebeat
As part of the Beats “family”, Filebeat is a lightweight log shipper that came to life precisely to address the weakness of Logstash: Filebeat was made to be that lightweight log shipper that pushes to Logstash, Kafka or Elasticsearch.
So the main differences between Logstash and Filebeat are that Logstash has more functionality, while Filebeat takes less resources. The same goes when you compare Logstash vs Beats in general: while Logstash has a lot of inputs, there are specialized beats (most notably MetricBeat) that do the job of collecting data with very little CPU and RAM.
Filebeat Advantages
Filebeat is just a tiny binary with no dependencies. It takes very little resources and, though it’s young, I find it quite reliable – mainly because it’s simple and there are few things that can go wrong. That said, you have lots of knobs regarding what it can do. For example, how aggressive it should be in searching for new files to tail and when to close file handles when a file didn’t get changes for a while.
To help you get started, Filebeat comes with modules for specific log types. For example, the Apache module will point Filebeat to default access.log and error.log paths, configure Elasticsearch’s Ingest node to parse them, configure Elasticsearch’s mappings and settings as well as deploy Kibana dashboards for analyzing things like response time and response code breakdown.
Filebeat Disadvantages
Filebeat’s scope is very limited, so you’ll have a problem to solve somewhere else. For example, if you use Logstash down the pipeline, you have about the same performance issue. Because of this, Filebeat’s scope is growing. Initially it could only send logs to Logstash and Elasticsearch, but now it can send to Kafka and Redis. Filebeat can also do some filtering: it can drop events or append metadata to them.
Filebeat Typical use-cases
Filebeat is great for solving a specific problem: you log to files, and you want to either:
- ship directly to Elasticsearch. This works if you want to just “grep” them or if you log in JSON (Filebeat can parse JSON). Or, if you want to use Elasticsearch’s Ingest for parsing and enriching (assuming the performance and functionality of Ingest fits your needs)
- put them in Kafka/Redis, so another shipper (e.g. Logstash, or a custom Kafka consumer) can do the enriching and shipping. This assumes that the chosen shipper fits your functionality and performance needs
- ship to Logstash. Like the above, except you’re relying on Logstash to buffer instead of Kafka/Redis. Simpler, but less flexible and fault tolerant
Filebeat to Elasticsearch’s Ingest
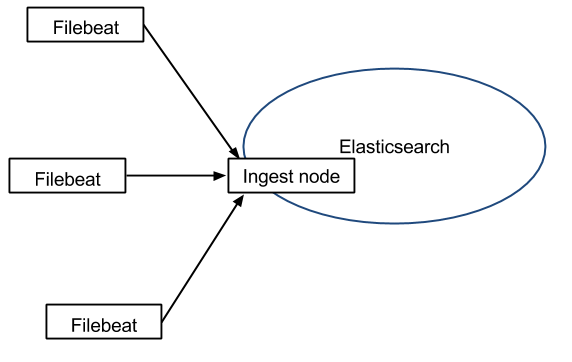
Elasticsearch comes with its own parsing capabilities (like Logstash’s filters) called Ingest. This means you can push directly from Filebeat to Elasticsearch, and have Elasticsearch do both parsing and storing.
You shouldn’t need a buffer when tailing files because, just as Logstash, Filebeat remembers where it left off:
Filebeat to Kafka
If you need buffering (e.g. because you don’t want to fill up the file system on logging servers), you can use a central Logstash for that.
However, Logstash’s queue doesn’t have built-in sharding or replication. For larger deployments, you’d typically use Kafka as a queue instead, because Filebeat can talk to Kafka as well:
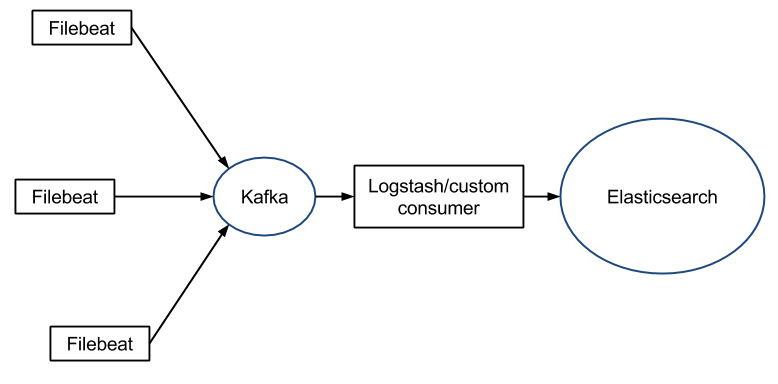
Top 5 Logstash Alternatives: https://t.co/pJ6SlE7DW2 #filebeat @fluentd @rsyslog #syslogng #logagent pic.twitter.com/di0crzj2aY
— Sematext Group, Inc. (@sematext) September 13, 2016
To summarize the differences between Logstash and Filebeat:
| Logstash | Filebeat | |
| Resource usage | heavy | light |
| Input options | many | fewer: files, TCP/UDP (including syslog), Kafka, etc |
| Output options | many | fewer: Logstash, Elasticsearch, Kafka, etc |
| Buffering | disk, memory | disk (beta), memory |
Logstash vs rsyslog
The default syslog daemon on most Linux distros, rsyslog can do so much more than just picking Linux logs from the syslog socket and writing to /var/log/messages. It can tail files, parse them, buffer (on disk and in memory) and ship to a number of destinations, including Elasticsearch.
You can find more info on how to use rsyslog for processing Apache and system logs here.
Rsyslog Advantages
rsyslog is the fastest shipper that we tested so far.
If you use it as a simple router/shipper, any decent machine will be limited by network bandwidth, but it really shines when you want to parse multiple rules. Its grammar-based parsing module (mmnormalize) works at constant speed no matter the number of rules (we tested this claim). This means that with 20-30 rules, like you have when parsing Cisco logs, it will outperform the regex-based parsers like grok by at least a factor of 100.
It’s also one of the lightest parsers you can find, depending on the configured memory buffers.
Rsyslog Disadvantages
rsyslog requires more work to get the configuration right (you can find some sample configuration snippets here on our blog) and this is made more difficult by two things:
- documentation is hard to navigate, especially for somebody new to the terminology
- versions up to 5.x had a different configuration format (expanded from the syslogd config format, which it still supports). Newer versions can still work with the old format, but most newer features (like the Elasticsearch output, Kafka input and output) only work with the new configuration format
Though rsyslog tends to be reliable once you get to a stable configuration, you’re likely to find some interesting bugs along the way. Automatic testing constantly improves in rsyslog, but it’s not yet as good as something like Logstash or Filebeat.
To summarize, the main difference between Logstash and rsyslog is that Logstash is easier to use while rsyslog lighter.
Rsyslog Typical use-cases
rsyslog fits well in scenarios where you either need something very light yet capable (an appliance, a small VM, collecting syslog from within a Docker container). If you need to do processing in another shipper (e.g. Logstash) you can forward JSON over TCP for example, or connect them via a Kafka/Redis buffer.
rsyslog also works well when you need that ultimate performance. Especially if you have multiple parsing rules. Then it makes sense to invest time in getting that configuration working.
To summarize the differences between Logstash and rsyslog:
| Logstash | rsyslog | |
| Resource usage | heavy | light |
| Inputs | many | fewer: files, all syslog flavors, Kafka |
| Filters | many | fewer: GeoIP, anonymizing, etc. Though events can be manipulated through variables and templates |
| Outputs | many | many (Elasticsearch, Kafka, SQL..) though still fewer than Logstash |
| Regex parsing | grok | grok (less mature) |
| Grammar-based parsing | dissect (less mature) | liblognorm (powerful, fast) |
| Multiple processing pipelines | yes | yes |
| Exposes internal metrics | yes, pull (HTTP API) | yes, push (input module) |
| Queues | memory, disk | memory, disk, hybrid. Outputs can have their own queues |
| Variables | event-specific (metadata) | event-specific and global |
Logstash vs syslog-ng
You can think of syslog-ng as an alternative to rsyslog (though historically it was actually the other way around). It’s also a modular syslog daemon, that can do much more than just syslog. It has disk buffers and Elasticsearch output support. Equipped with a grammar-based parser (PatternDB), it has all you probably need to be a good log shipper to Elasticsearch.
Syslog-ng Advantages
Like rsyslog, it’s a light log shipper and it also performs well. Probably not 100% as well as rsyslog because it has a simpler architecture, but we’ve seen 570K logs/s processed on a single host many years ago.
Unlike rsyslog, it features a clear, consistent configuration format and has nice documentation. Packaging support for various distros is also very good. It’s also the only log shipper here that can run correlations across multiple log messages (assuming they are all in the buffer).
Syslog-ng Disadvantages
The main reason why distros switched to rsyslog was syslog-ng Premium Edition, which used to be much more feature-rich than the Open Source Edition which was somewhat restricted back then. We’re concentrating on the Open Source Edition here, all these log shippers are open source.
Things have changed in the meantime, for example disk buffers, which used to be a PE feature, landed in OSE. Still, some features, like the reliable delivery protocol (with application-level acknowledgements) have not made it to OSE yet.
Syslog-ng Typical use-cases
Similarly to rsyslog, you’d probably want to deploy syslog-ng on boxes where resources are tight, yet you do want to perform potentially complex processing.
As with rsyslog, there’s a Kafka output that allows you to use Kafka as a central queue and potentially do more processing in Logstash or a custom consumer:
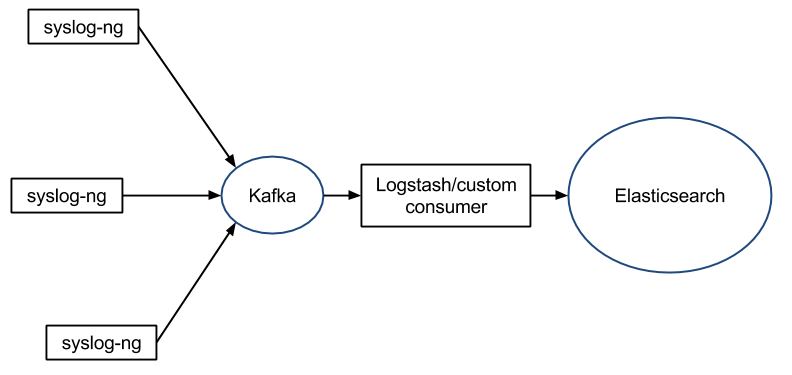
The difference is, syslog-ng has an easier, more polished feel than rsyslog, but likely not that ultimate performance: for example, only outputs are buffered, so processing is done before buffering – meaning that a processing spike would put pressure up the logging stream.
Logstash vs Fluentd
Fluentd was built on the idea of logging in JSON wherever possible (which is a practice we totally agree with!) so that log shippers down the line don’t have to guess which substring is which field of which type.
As a result, there are logging libraries for virtually every language, meaning you can easily plug in your custom applications to your logging pipeline.
Fluentd Advantages
Like most Logstash plugins, Fluentd plugins are in Ruby and very easy to write. So there are lots of them, pretty much any source and destination has a plugin (with varying degrees of maturity, of course). This, coupled with the “fluent libraries” means you can easily hook almost anything to anything using Fluentd. Also, Fluentd is now a CNCF project, so the Kubernetes integration is very good.
Fluentd Disadvantages
Because in most cases you’ll get structured data through Fluentd, it’s not made to have the flexibility of other shippers on this list (Filebeat excluded). You can still parse unstructured via regular expressions and filter them using tags, for example, but you don’t get features such as local variables or full-blown conditionals.
Also, while performance is fine for most use-cases, it’s not in on the top of this list: buffers exist only for outputs (like in syslog-ng), single-threaded core and the Ruby GIL for plugins means ultimate performance on big boxes is limited, but resource consumption is acceptable for most use-cases.
For small/embedded devices, you might want to look at Fluent Bit, which is to Fluentd similar to how Filebeat is for Logstash. Except that Fluent Bit is single-threaded, so throughput will be limited.
Fluentd Typical use-cases
Fluentd is a good fit when you have diverse or exotic sources and destinations for your logs, because of the number of plugins.
Also, if most of the sources are custom applications, you may find it easier to work with fluent libraries than coupling a logging library with a log shipper. Especially if your applications are written in multiple languages – meaning you’d use multiple logging libraries, which may behave differently.
To summarize the differences between Logstash and Fluentd:
| Logstash | Fluentd | |
| Resource usage | high | low |
| Variables | yes | no |
| Inputs | many | many |
| Outputs | many | many |
| Queue | memory, disk. For filters and outputs | Memory, disk. For outputs |
| Libraries | nothing specific | many |
Don’t forget to download your Quick Guide to Logging Basics
Some honorable alternatives mentions
There are some technologies that are definitely worth mentioning in this conversation.
Without trying to be exhaustive, we’ll try to address the most important ones.
Logstash vs Apache Flume
Apache Flume’s architecture is different than that of most shippers described here. You have sources (inputs), channels (buffers) and sinks (outputs). Processing, such as parsing unstructured data, would be done preferably in outputs, to avoid pipeline backpressure.
The most interesting output is based on Morphlines, which can do processing like Logstash’s grok, but also send data to the likes of Solr and Elasticsearch. Unfortunately, the Morphlines Elasticsearch plugin didn’t get much attention since its initial contribution (by our colleague Paweł, many years ago).
Logstash vs Splunk
Splunk isn’t a log shipper, it’s a commercial logging solution, so it doesn’t compare directly to Logstash.
To compare Logstash with Splunk, you’ll need to add at least Elasticsearch and Kibana in the mix, so you can have the complete ELK stack. Alternatively, you can point Logstash to Sematext Logs.
That said, there are two main differences between Splunk and ELK: one is that ELK is open-source, and the other is that Splunk tends to do a lot of query-time parsing. By contrast, in ELK you’d typically parse logs with Logstash to make them structured, and index them in Elasticsearch.
In short, compared to Splunk, ELK trades disk space and write performance for query performance. Which, for large datasets, is a good trade-off.
If you want to read more about Splunk’s features and how it can help with log management, read our review of the best log analysis tools.
Want to see how Sematext stacks up? Check out our page on Sematext vs Splunk.
Logstash vs Graylog
Graylog is another complete logging solution, an open-source alternative to Splunk.
It uses Elasticsearch as its storage backend. Its graylog-server component aims to do what Logstash does and more: everything goes through graylog-server, from authentication to queries. graylog-server also has pipeline definitions and buffering parameters, like Logstash and other log shippers mentioned here. Graylog is nice because you have a complete logging solution, but it’s going to be harder to customize than an ELK stack.
If you’re interested in learning more bout Graylog and how it compares to yet other similar solutions, check out our article on the best log management tools.
Conclusion: How does Logstash compare to these alternatives?
First of all, the conclusion is that you’re awesome for reading all the way to this point. If you did that, you get the nuances of an “it depends on your use-case” kind of answer.
All these shippers have their pros and cons, and ultimately it’s down to your specifications (and in practice, also to your personal preferences) to choose the one that works best for you.
Avoid the hassle and costs of managing the Elastic Stack on your own servers by sending logs to Sematext Logs – Hosted ELK as a Service. Get started!
If you need help deciding, integrating, or really any help with logging don’t be afraid to reach out – we offer Logging Consulting.