Every developer’s worst nightmare is digging through a huge log file, trying to pinpoint problems. The troubleshooting most likely won’t stop there. They’ll have to follow the trail to multiple other log files and possibly on other servers. The log files may even be in different formats. This may go on until one loses themselves completely. Log aggregation is what you need to stop this seemingly never-ending cycle.
In this post, we will cover everything you need to know about log aggregation, from how it works to the best tools available today that can help ensure the health of your system.
Definition: What Is Log Aggregation?
Log aggregation is the process of collecting and standardizing log events from various sources across your IT infrastructure for faster log analysis. By using log shippers, the logs are stored in a central location, which is why the process is also called log centralization.
Log events have fields and can be used to group, filter, and search through your logs in the log management software. Typical default fields usually include timestamp, source, status, severity, host, origin, message, and any other information one needs to be able to analyze, monitor, and search through log events.
All log events sent to the log management tool get indexed in a document database, Elasticsearch or Solr being the most popular. The logs are stored and archived, making it easier to search and analyze your data. Having all logs in one place and access to them via one single user interface without the hassle of connecting to machines and running grep is why log management is so powerful and makes developers’ lives so much easier.
Why Is Log Aggregation Important: Main Advantages
Log aggregation is one of the early stages in the log management process, having the following advantages:
Logs are aggregated in a centralized location
Whatever business you may be in, your software applications and infrastructure generate logs documenting the activity of who did what on said systems. However, it wouldn’t be easy for developers to deal with copious amounts of data to pinpoint the root of the problem whenever one occurs. It would be like looking for a needle in a haystack – painfully time-, money- and nerve-consuming, not to mention error-prone and not scalable.
Enter log aggregation, which brings your logs together to a central location.
Text files become meaningful data
Log files contain data that you can extract, organize, and then query to turn into valuable information you can use to improve your business operations.
However, these are not simple text files that you can do a quick search on. Log aggregation does the parsing for you, turning the raw information from your log files into structured data.
Working with meaningful log messages and structured log formats is only one of the logging best practices we recommend you follow for easier troubleshooting, making log aggregation a critical step in the logging and monitoring process.
Better real-time monitoring
When you aggregate your logs, you get to search within a single location containing all the structured, organized, and meaningful data instead of going tailing each log file to do real-time monitoring.
In other words, you get real-time access to a live stream of activity, enabling you to troubleshoot and identify trends and patterns to prevent errors from happening.
Sophisticated search capabilities
Given that you now have a set of meaningful data, not just text, you can also get smarter and more refined with your queries.
During log aggregation, your code is treated as data. It is indexed and organized in a conceptual schema, allowing you to do fast semantic searches based on the nature of the data.
How to Aggregate Your Logs
There are multiple ways you can set up a log aggregation strategy:
File replication
A simple and straightforward option is to copy your log files to a central location using simple tools such as rsync and cron. However, although it does bring together all of your logs, this option is not the same as an aggregation but more of a “co-location.” Furthermore, since you need to follow a cron schedule, in the long term, file replication is not a good solution as you don’t get real-time access to your log data.
Syslog, rsyslog, or syslog-ng
The second approach is to use syslog since you probably have already installed it on your system or the two syslog implementations, rsyslog or syslog-ng. They allow processes to send log entries to them that they’ll then redirect to a central location.
You need to set up a central syslog daemon on your network and the clients’. The client logging daemons will forward these messages to the daemons.
Syslog is also a simple method to aggregate your logs since you have already installed it, and you only have to configure it. The catch is to make sure the central syslog server is available and figure out how to scale it.
If you want to learn more about syslog and its implementations and see them in action, you might also be interested in:
- Recipe: rsyslog + Redis + Logstash
- Recipe: rsyslog + Elasticsearch + Kibana
- Recipe: How to Integrate rsyslog with Kafka and Logstash
- Recipe: Apache Logs + rsyslog (parsing) + Elasticsearch
- Structured Logging with rsyslog and Elasticsearch
- Centralized Logging with rsyslog eBook
Log Aggregators
Syslog, rsyslog, and syslog-ng work great, but log aggregation tools work even better and with fewer limitations. They have extra features that make log collecting better and more efficient. Most of these tools are general-purpose log management solutions that also include logging as a functionality.
They are, of course, different but rely on a similar architecture, involving logging clients and/or agents on each host that forward messages to collectors, which further forward them to a central location. Unlike syslog options, with tools, this collection tier is horizontally scalable to grow as the data volume increases over time.
Best Log Aggregation Tools Comparison
Should you be ready to start logging your data, we’ve done the legwork for you and reviewed some of the best log aggregation software available today.
1. Sematext Logs
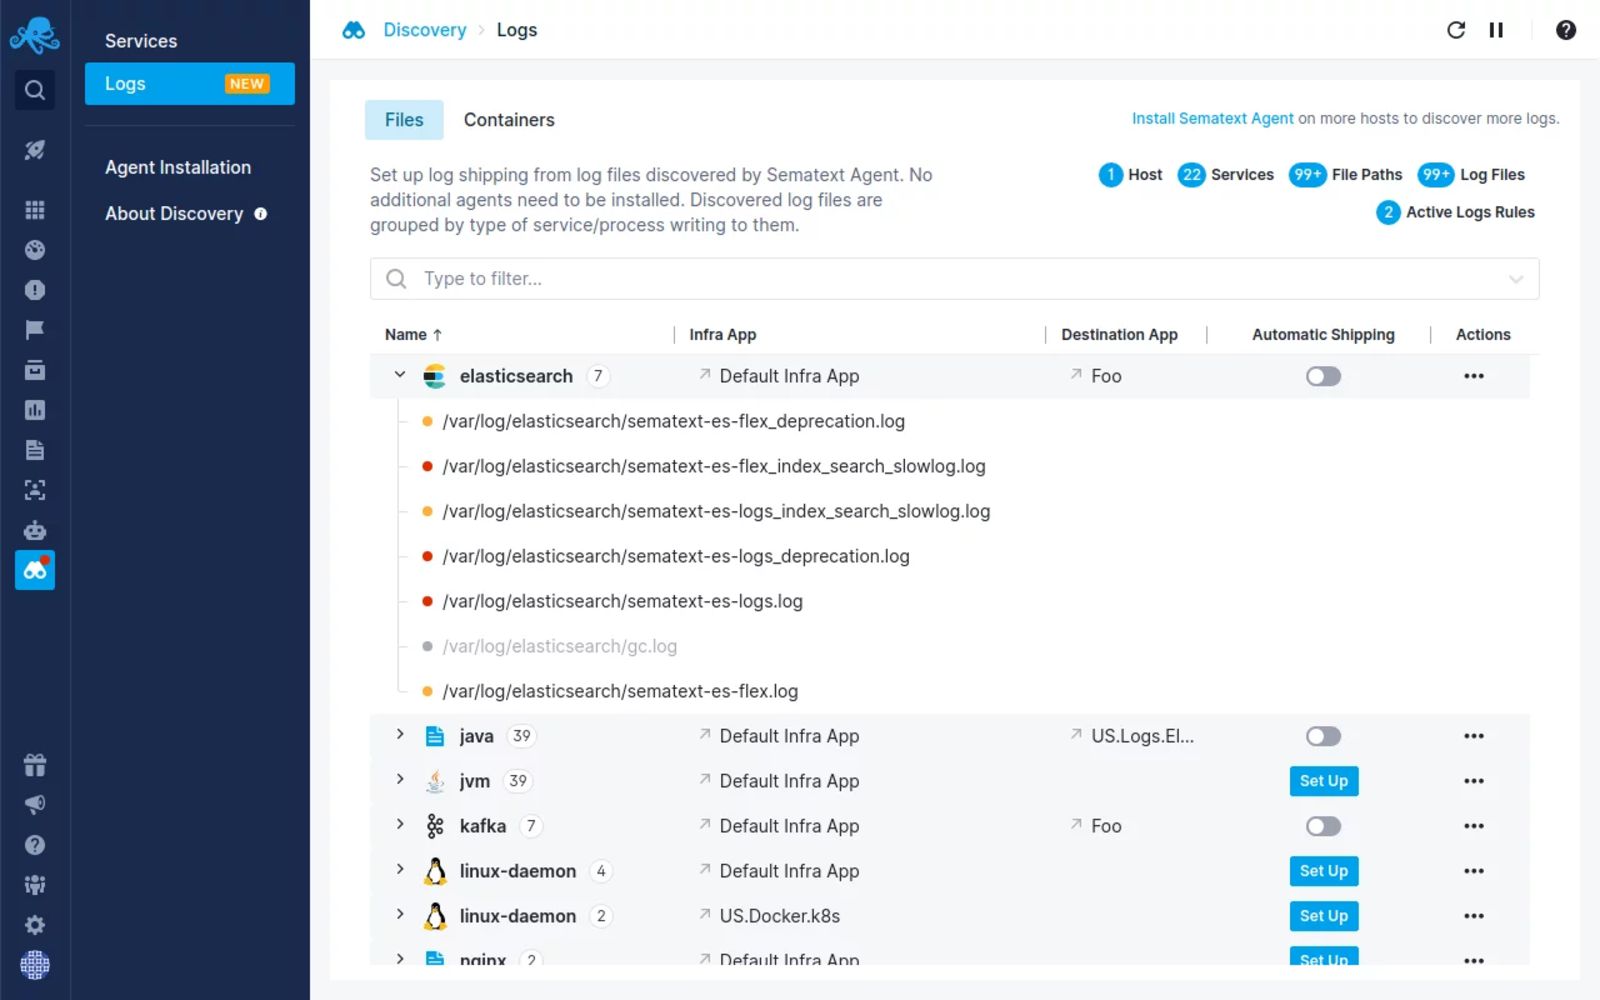
Sematext Logs is a hassle-free log aggregation and analysis tool that allows you to correlate logs with events and metrics, live-tail logs, add alerts to logs, and use Google-like syntax for filtering. Sematext’s auto-discovery of logs and services lets you automatically start forwarding and monitoring logs from both log files and containers directly through the user interface.
This log aggregator is compatible with a wide range of logging frameworks, allowing you to bring all your log events to one central location as they happen. You get a real-time view of your logs to pinpoint anomalies as they are logged.
With Sematext Logs, you get more powerful searching and filtering capabilities to do full-text searching. You also get something called log context. When you search for log events and pinpoint the one you wanted to find, you still see all log events that occurred before it and after that particular log event.
Pros:
- Fully hosted – you can get all of the flexibility of the Elastic stack without having to manage your own cluster and more
- Ease of integration with the rest of the Sematext Cloud offering like Experience, Synthetics, and Infrastructure Monitoring, giving you a full observability solution in a single tool
- Accepts data from various sources that can ship data in Elasticsearch compatible format (think Logstash, Beats, Fluentd, etc.) or via the syslog protocol
- Provides an agent with pre-configured parsing for integrating with common log formats, like Apache, Nginx, or Java garbage collector
- Once shipped, the data can be manipulated via user-friendly Logs Pipelines that enable further data processing – such as numerical data extraction, field masking, and much more.
Cons:
- No support for unstructured text – you can only send JSON formatted log events, use syslog to send data, or the provided agent supporting a limited set of common formats.
- You can’t mix Kibana and Sematext native UI widgets in a single dashboard – it is one or the other.
Pricing: Sematext Logs starts with a Basic plan allowing up to 500MB/day worth of logs and 7 days of data retention for free. The Standard plan starts with $50/month and includes 1GB/day and 7 days retention, which translates to around $0.1/GB of received data and $1.56/GB of stored data, but with a limited set of features. The fully-featured Pro plan has Logs Pipelines, Log Archiving, and more, starting with around $60/month for 1GB/day of data and 7 retention translating to $0.1/GB of received data and $1.90/GB of stored data.
2. SolarWinds Papertrail
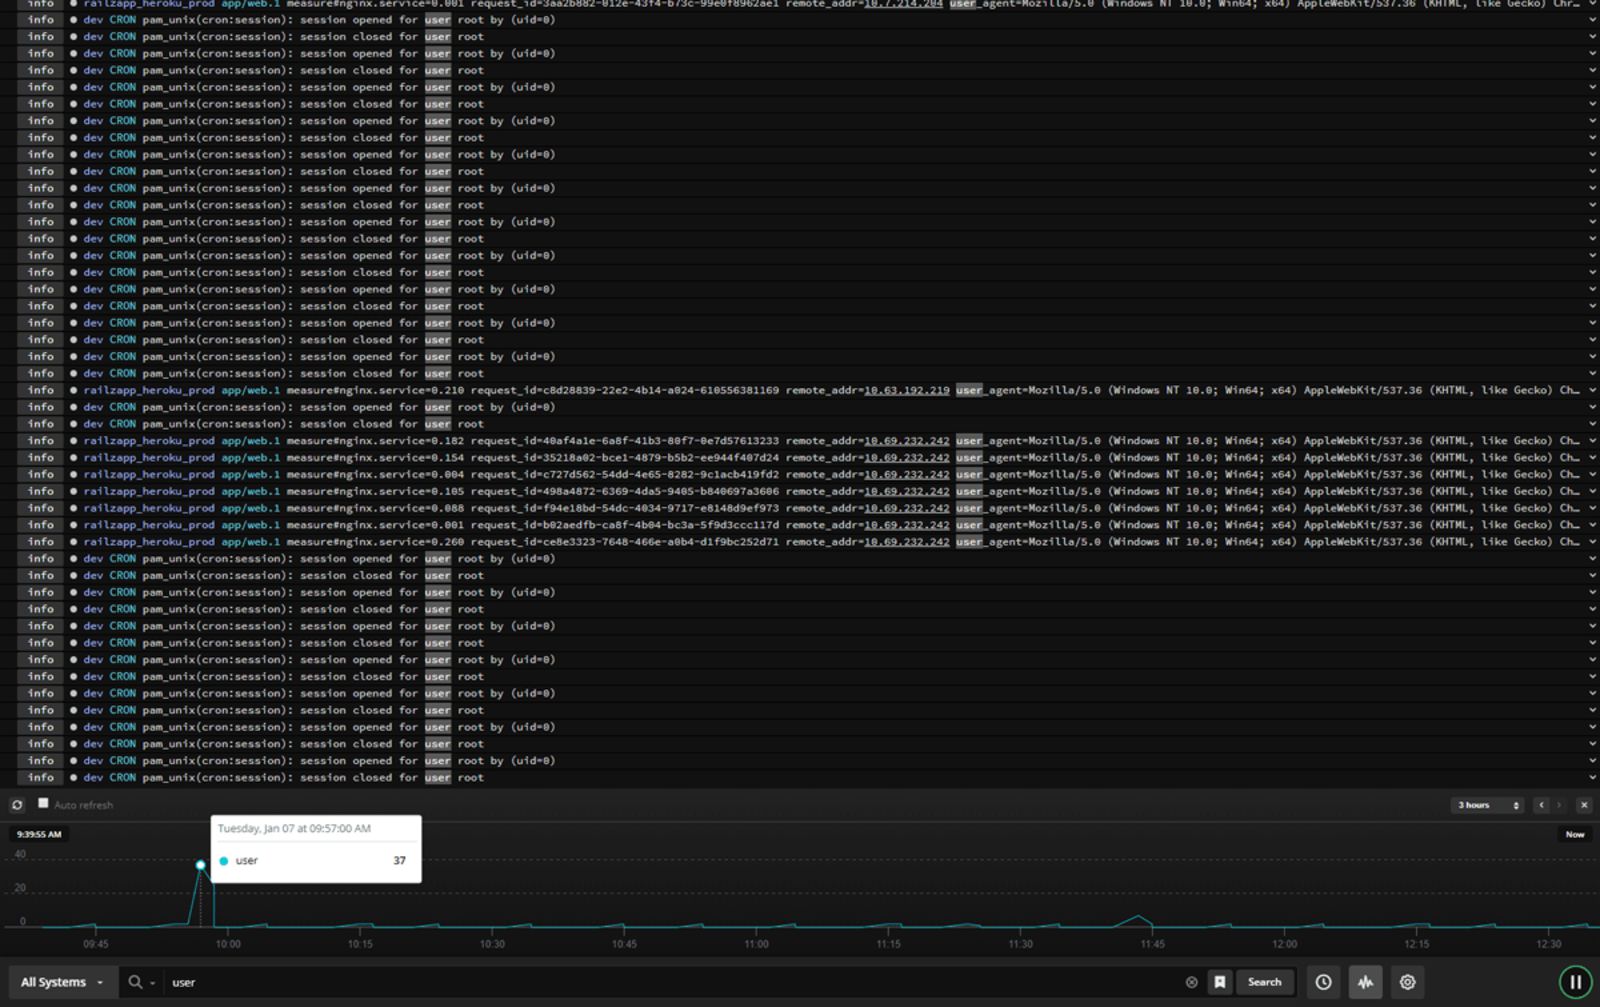
SolarWinds Papertrail is a cloud-hosted log aggregation and management software with great features for efficient log analysis. It allows you to search and analyze any type of log file, text log file, or data coming via the syslog protocol in real-time. .
Easy to use, Papertrail features a live tail search to help detect issues faster and trace back the chain of events to help with root cause analysis in real time. Filter log events by source, date or time, severity level, facility, or message contents to focus on the most meaningful data. You can then chart or graph them using third-party integrations to spot trends and patterns quickly.
Pros:
- Simple and user-friendly interface that mimics the console experience
- Built-in archiving of the data
- Data ingestion is calculated monthly, which makes the service spike-friendly
- Quick and easy setup
Cons:
- No rich visualization support
- Overage limited to 200% of the plan
- Higher volume plans become expensive compared to other services
Pricing: The pricing starts as low as $0 for 2 days worth of searchable data and 7 days archive with 50MB/month of data (with 16GB free as a first-month bonus). The paid plans start with $7 for 1GB/month of data with the data being searchable for 1 week and being archived for a year. The most expensive non-custom plan that we can see is $230 for 25GB/month of data available for two weeks for searching and an archive of one year.
Want to see how Sematext stacks up? Check out our page on Sematext vs Papertrail.
3. Splunk
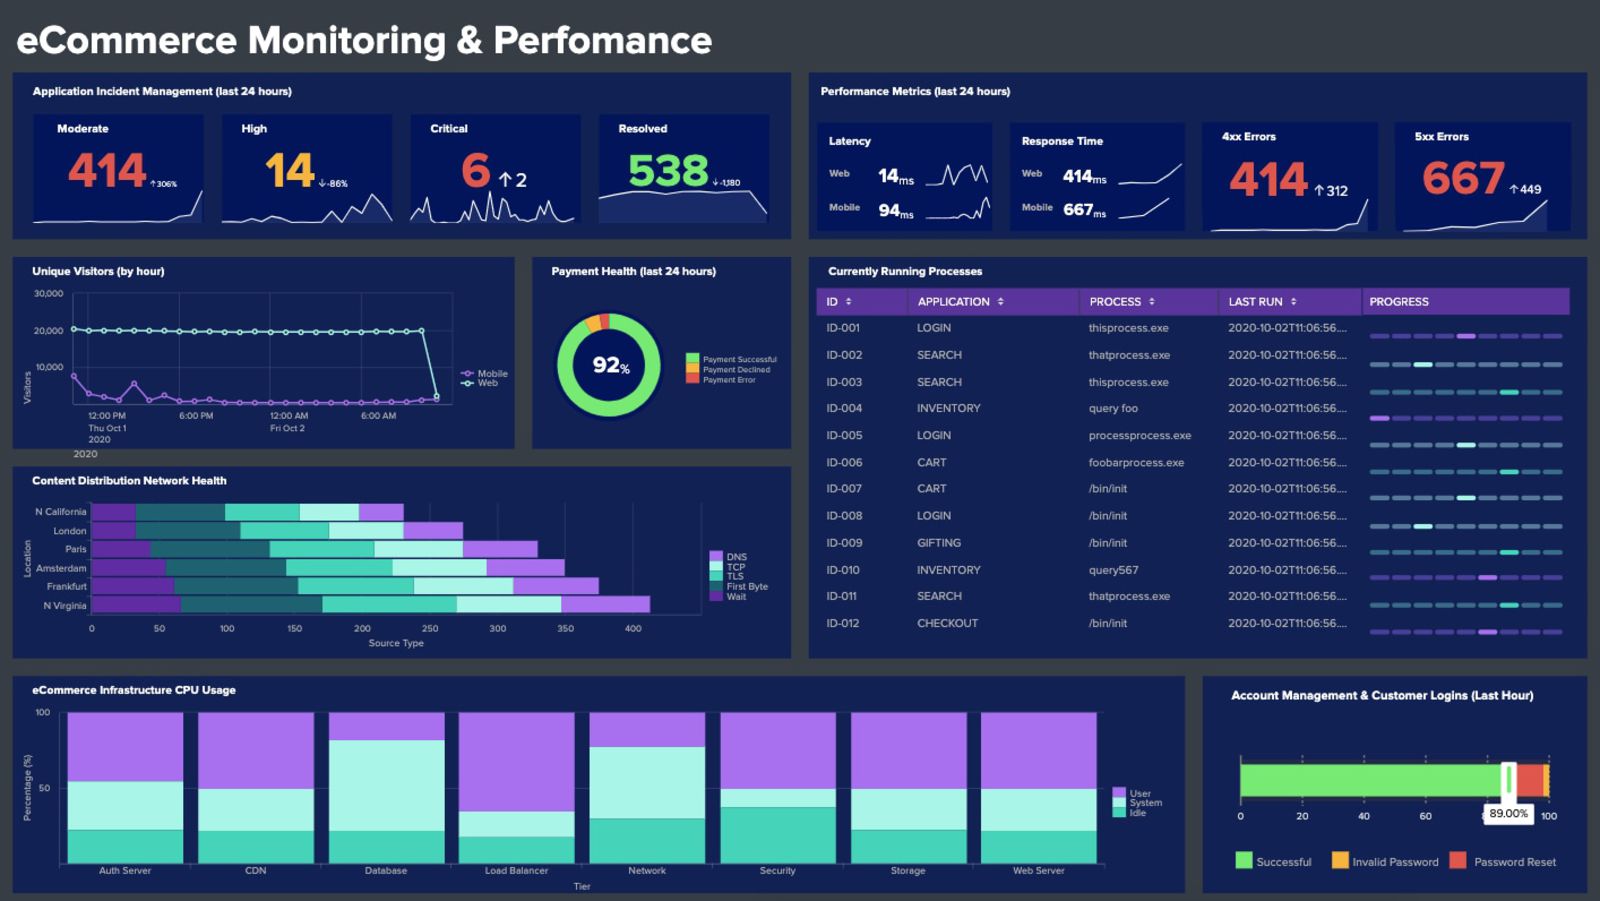
Splunk is one of the veteran log management tools that handles log aggregation, log search and analysis, visualization, and reporting. Being one of the first log analysis solutions on the market, it collects, stores, indexes, correlates, visualizes, analyzes, and reports on any type of machine-generated data, whether structured or unstructured. It can even handle more sophisticated application logs like the multi-line ones describing application exceptions.
Splunk supports both real-time log analysis and search on the historical log data giving you full observability into your logs. It allows you to set up real-time alerts that send automatic trigger notifications through email or RSS. You can also create custom reports and dashboards to better view your data and detect and solve security issues faster.
Pros:
- Powerful query language enables rich analytics
- Search-time field extraction allows working on the unparsed data
- Feature-rich and very mature
- Allows for both logs and metrics, giving you the possibility to gain insight from various perspectives
Cons:
- Expensive
- Less efficient for metrics
Pricing: Pricing is available upon requests, with information that the pricing is based on data ingestion and information that the Splunk Observability Solutions that unify metrics, traces, and logs start at $65 per host/month.
Want to see how Sematext stacks up? Check out our page on Sematext vs Splunk.
4. Sumo Logic
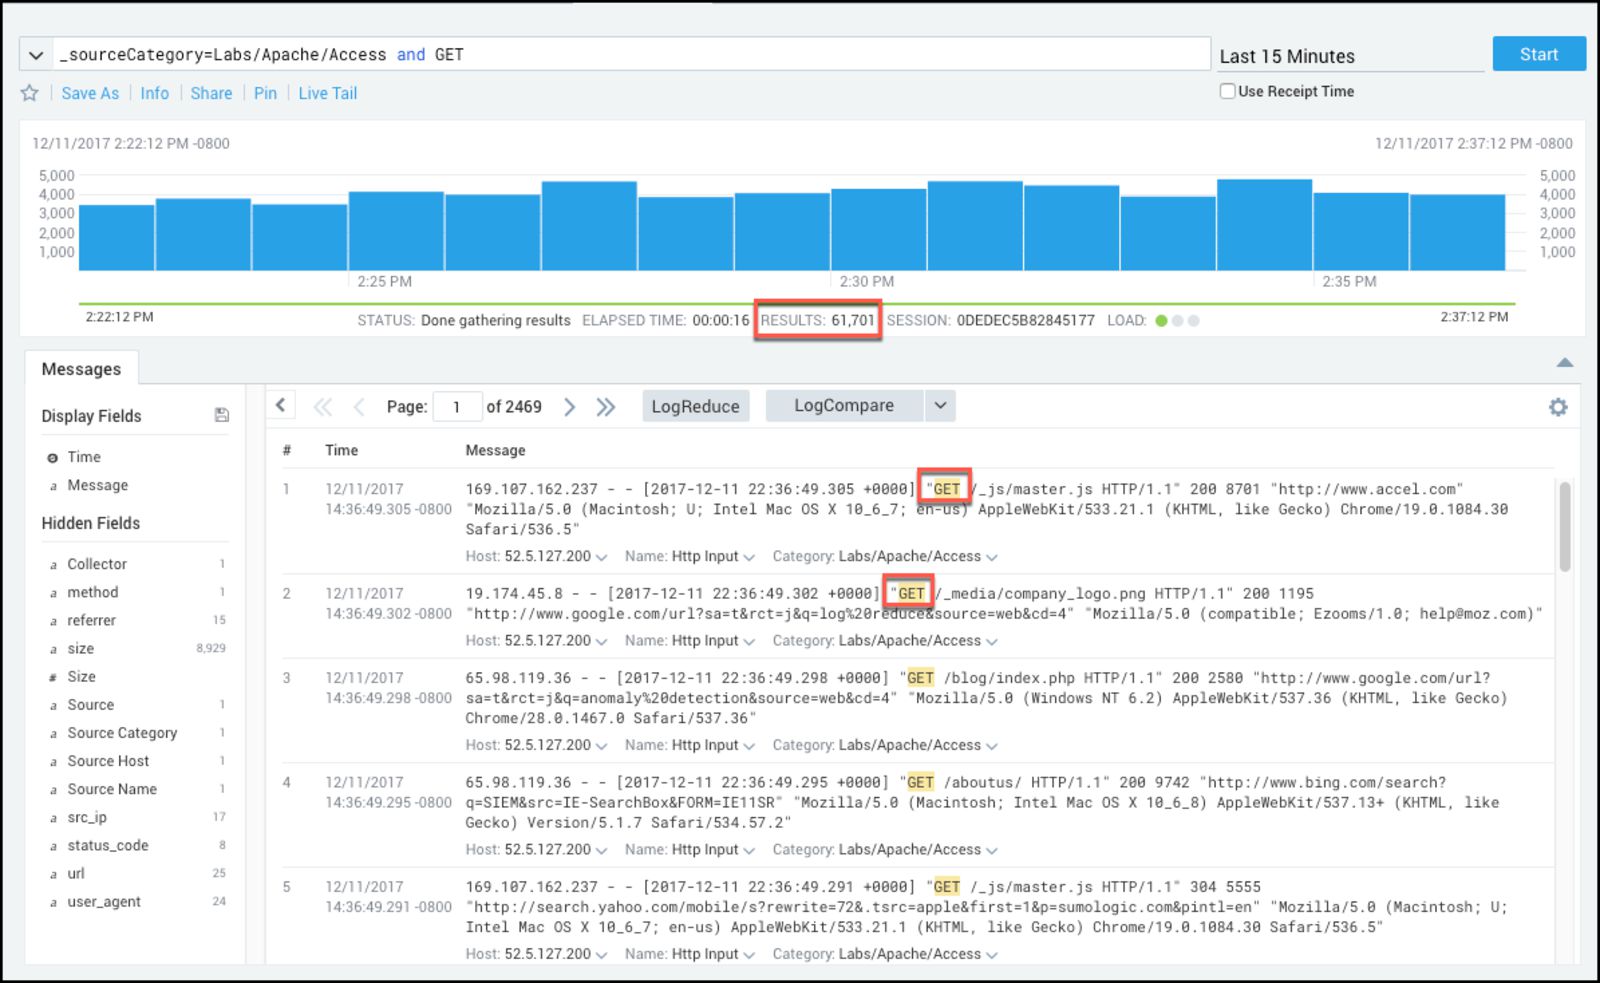
Sumo Logic is a unified logs and metrics platform that can provide real-time insights into applications and systems. Besides log aggregation, it features advanced analytics to help understand data by using indexing and filtering. Machine learning and predictive algorithms enable you to process over 100 petabytes of data per day, while its user-friendly dashboard allows you to identify patterns and trends faster.
Pros:
- Power query language
- Automatic log patterns detection
- Centralized agents with easy setup
- Rich visualization support
Cons:
- Not available on-premises, which disqualifies the solution for some companies
- No overage support
Pricing: Pricing is based on features and data ingestion. You can start with a free plan with limited features and up to 500MB daily data ingestion. The paid plans start with the Essential, which has log analytics, real-time alerting, and live and historical data dashboarding that will cost you around $93/GB (an estimated cost based on annual commitment and 30 days data retention). The Enterprise Security plan includes log analytics, SIEM and global intelligence solutions, and 24×7 enterprise P1 support and starts at $653/5GB based on 30 days retention and 2 years commitment.
5. Loggly
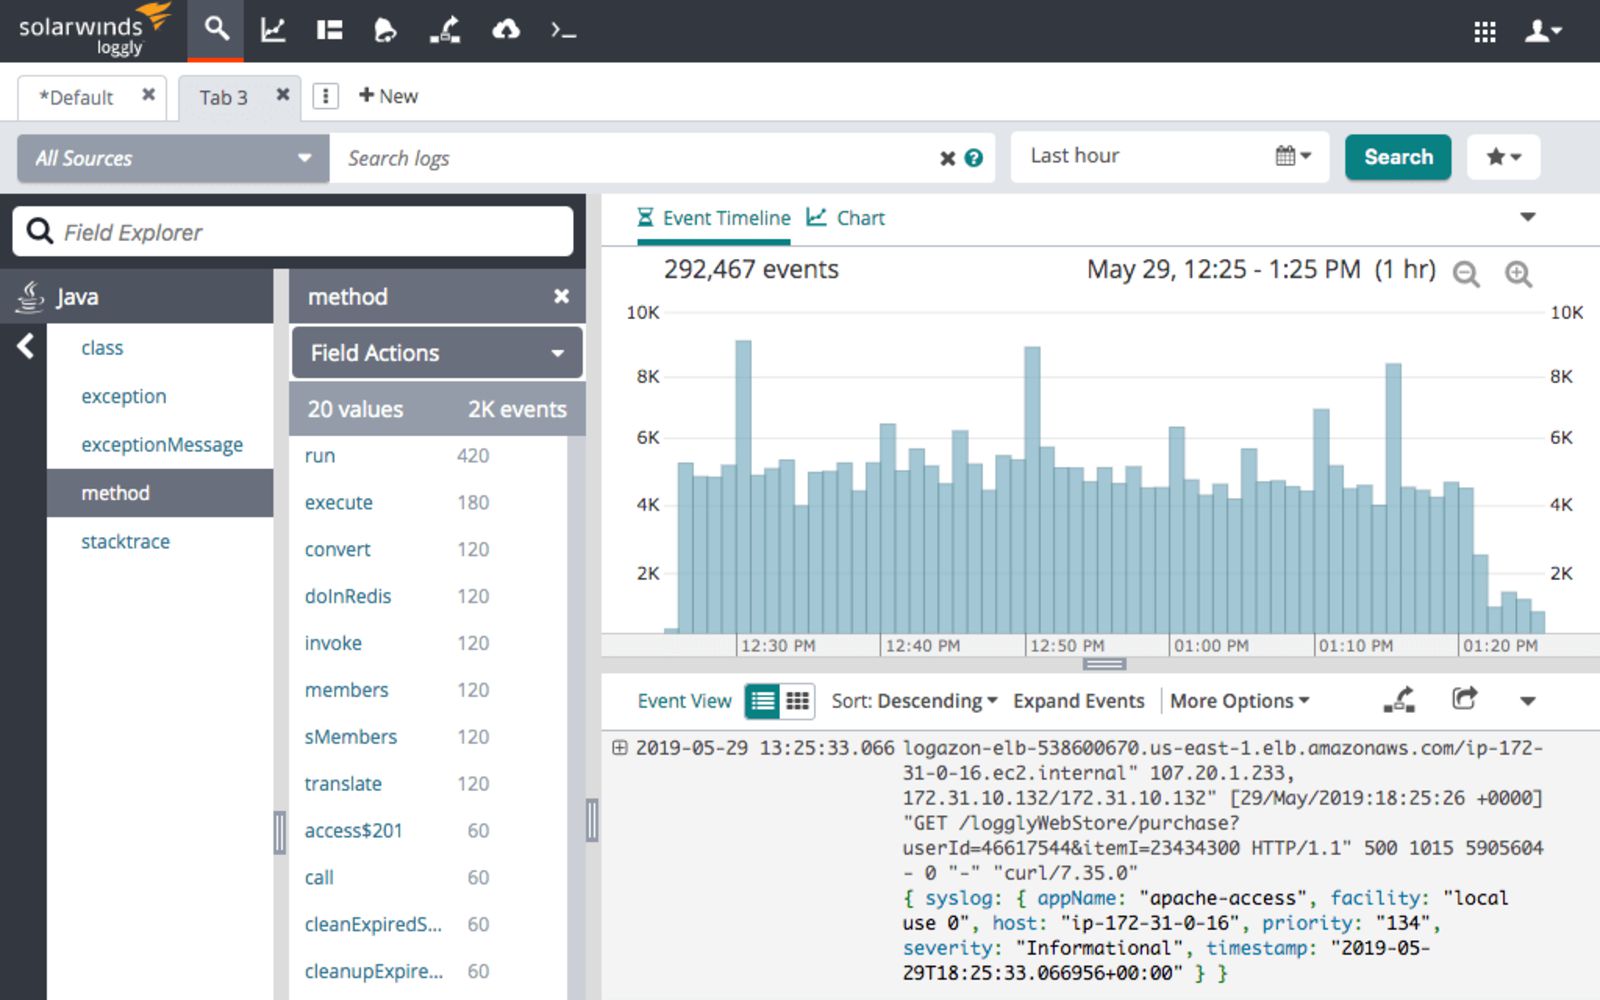
Loggly is a cloud-based log aggregation and management service that allows you to access and analyze all of your log data fast and simple while giving you real-time insights into how to improve your code. It enables you to use well-established and known protocols such as HTTP or Syslog to collect data from various sources – both server and client-side.
The dynamic field explorer gives a real-time overview of your logs categorized by structure or customized view. The powerful full-text search capabilities allow searching on individual fields and various data types. Loggly features an interactive, ready-to-use dashboard that provides performance indicators and metrics. That way, you can spot trends and performance issues and compare data across a given timeline.
Pros:
- Server-side logs parsing
- Agent-free logs collection
- Support for popular log shippers
- Parsing support for common log formats
- Query time field extraction
Cons:
- Some features, like API access, only available in higher plans
- Restrictive overage rules
Pricing: Loggly pricing starts with a free tier that includes 200MB/day of data ingestion with 7 days retention and includes basic functionality lacking alerting and customized dashboards. The paid plan starts with $79/month billed annually for 1GB/day of data ingestion and 15 days retention and has customized dashboards and email alerting. The Enterprise version starts at $279/month billed annually and includes all the features of the earlier plans, webhooks, custom daily data volume and retention of 15 to 90 days.
Want to see how Sematext stacks up? Check out our page on Sematext vs Loggly.
6. Elastic Stack
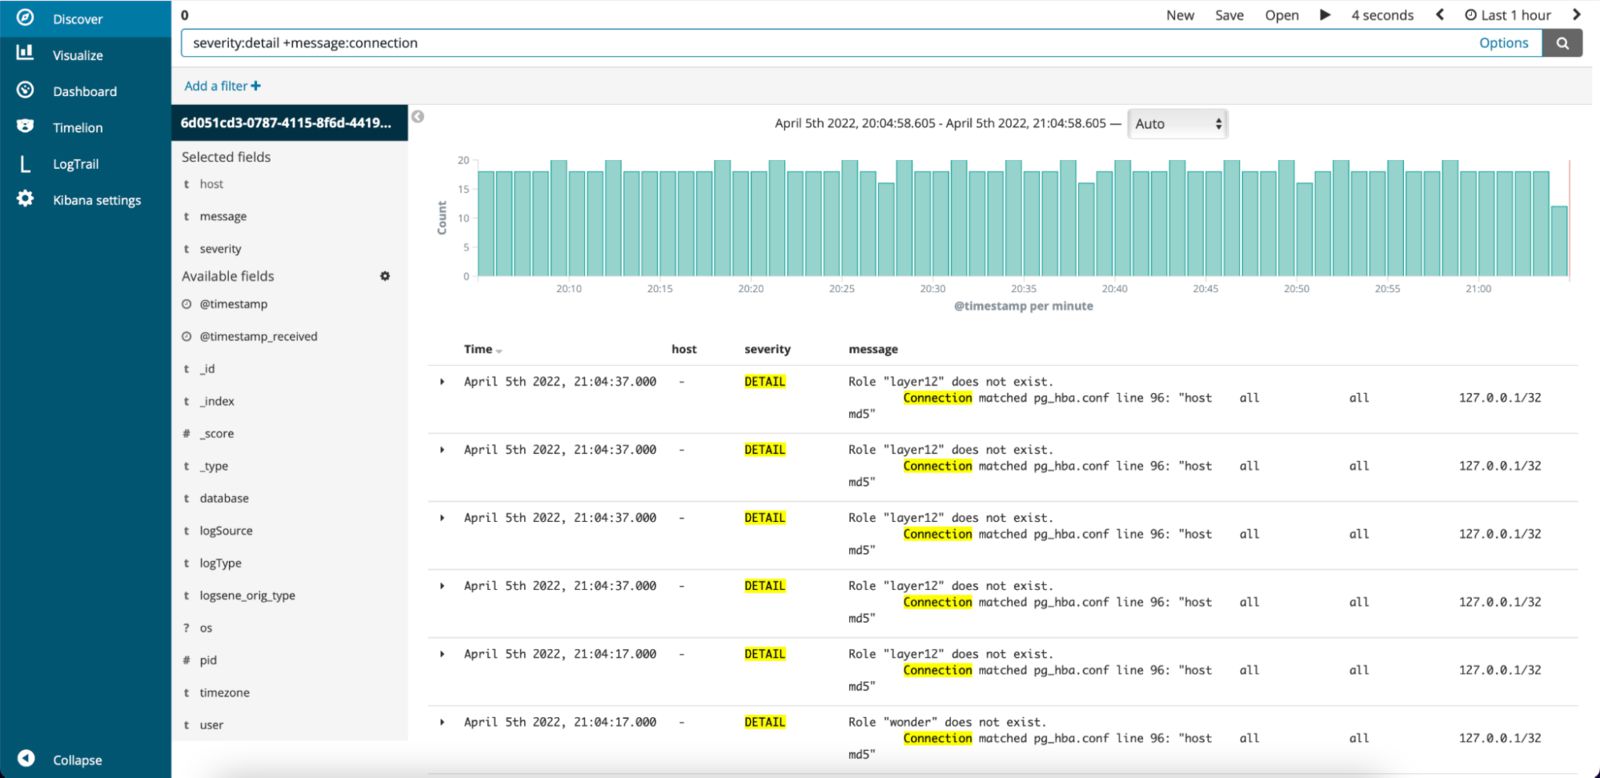
The Elastic Stack is one of the most known and widely adopted set of tools. Initially known as the ELK – Elasticsearch, Logstash, and Kibana – consecutively the search and analytics engine, the log processing and shipping tool, and the virtualization layer. This toolset changed how organizations approach log aggregation, processing, and analytics. While it had only three pieces initially, the Elastic Stack is way more nowadays than what we’ve mentioned.
The solution allows you to aggregate and analyze logs, slice and dice them, build APM solutions, threat detection, prevention, and response with XDR, SIEM, and endpoint security. All are available from a single vendor with the possibility to install and run it in your own environment or using one of the providers.
Pros:
- Possible to setup and configure according to needs
- Fast searches, because of indexed data
- Scalable
- Mature and configurable log shippers
- Rich visualizations
Cons:
- May be challenging to maintain at a larger scale
- Limited features of the Basic version
Pricing: The Basic version of Elastic Stack is free, but it is self-managed, so you need to consider what comes with it – maintenance. It also doesn’t have all the features available – especially the enterprise-grade one, which starts with the Gold subscription.
Suppose you are into the managed services and would like to go for the managed Elastic Stack. In that case, you have that option on Google Cloud, Amazon Web Services, and Microsoft Azure, and Elastic provides a very nice Elasticsearch Service pricing calculator where you can choose the whole infrastructure for your Elastic Stack. It is very nice but requires some knowledge about the stack itself to select all the needed nodes properly. It is not a subscribe-and-forget kind of service.
7. Graylog
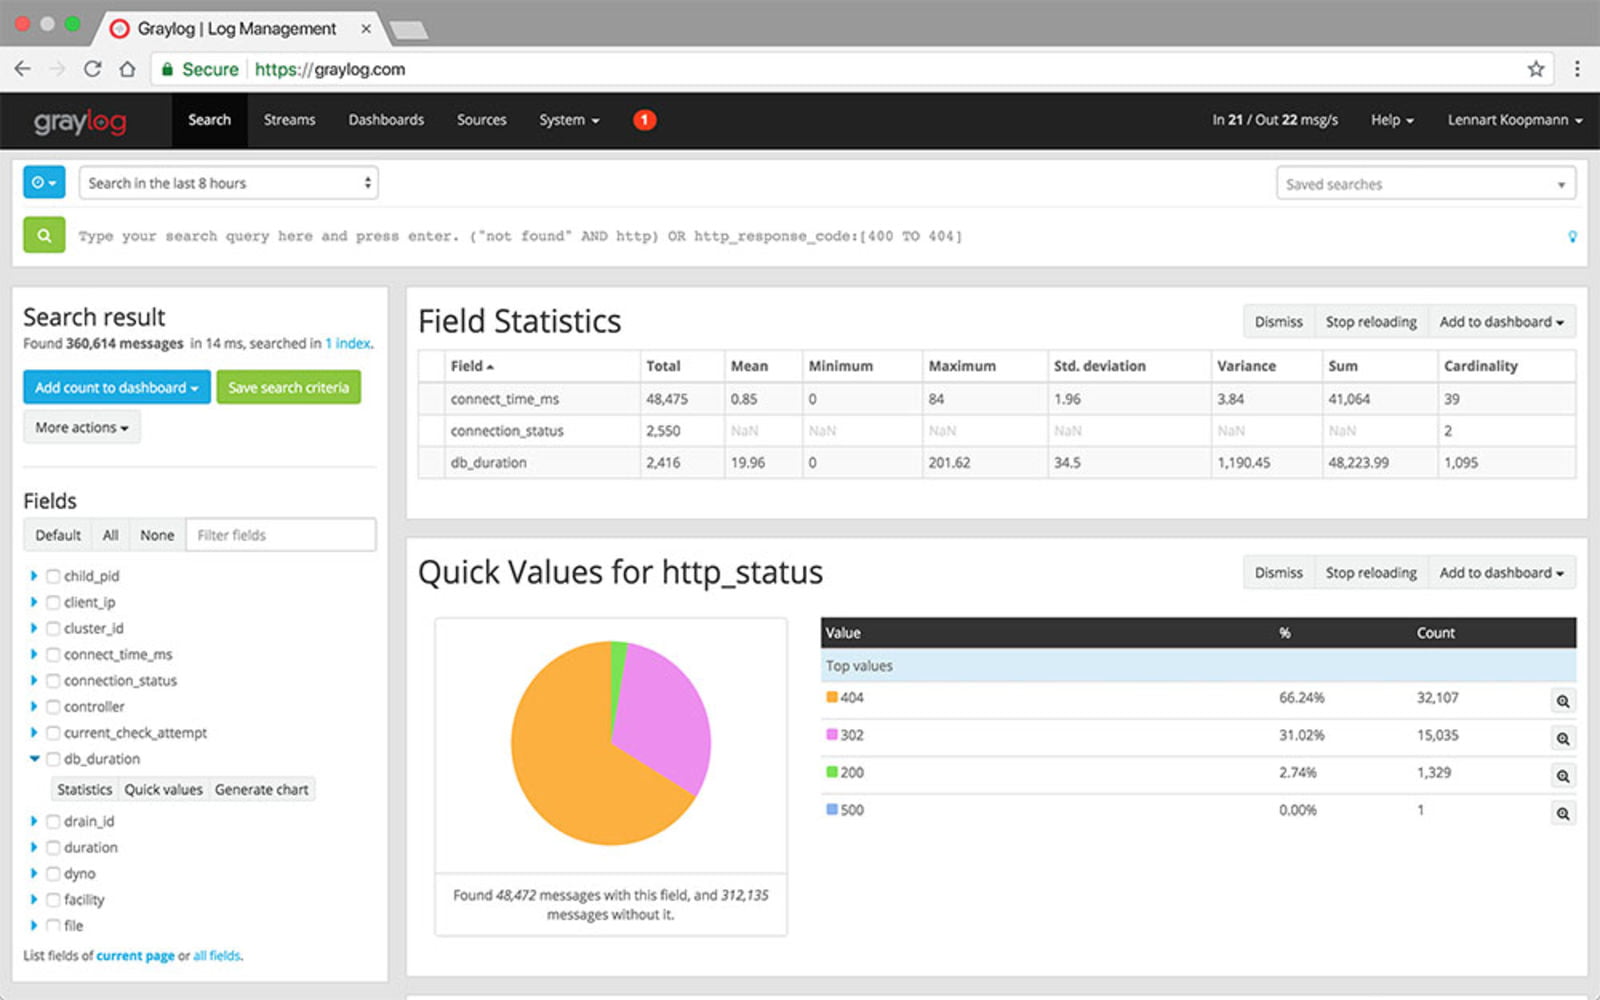
Graylog is a free and open-source log aggregation and analysis tool that stores your logs in Elasticsearch that you can then search and analyze via their UI. It’s among one of the favorite system administrators tools due to its scalability, user-friendly interface, and functionality.
Graylog features customizable dashboards that allow you to choose how you want to visualize your log events and which sources you want to view the data from. It enables you to search and analyze terabytes of data instantly. With Graylog, you get powerful drill-down analysis and charts that make it easy to detect performance issues and understand their root cause and identify trends over time.
You can set up alerts and triggers to monitor data failures or detect potential security risks. Graylog has built-in fault tolerance that can run multi-threaded searches so you can analyze several potential threads together. This log analyzer also helps your organization follow compliance rules.
Pros:
- Powerful, feature-rich, and mature
- Scalable storage and ingestion pipeline
- Configurable parsing
- Pluggable
Cons:
- More advanced and enterprise-level features not available in the open-source version
Pricing: Graylog is available in four versions. The Graylog Open is available for free as a self-managed solution. Graylog Enterprise is the Graylog Open on steroids, enriched with different features, including the enterprise-level ones. The Graylog Small Business version comes with the same features, but it is limited to 2GB/day of ingestion. However, it is free as well. The Graylog Cloud is the managed service offering the same functionality as the Enterprise version but without the maintenance burden. The pricing for the Enterprise and Cloud versions is available on request.
8. Logz.io
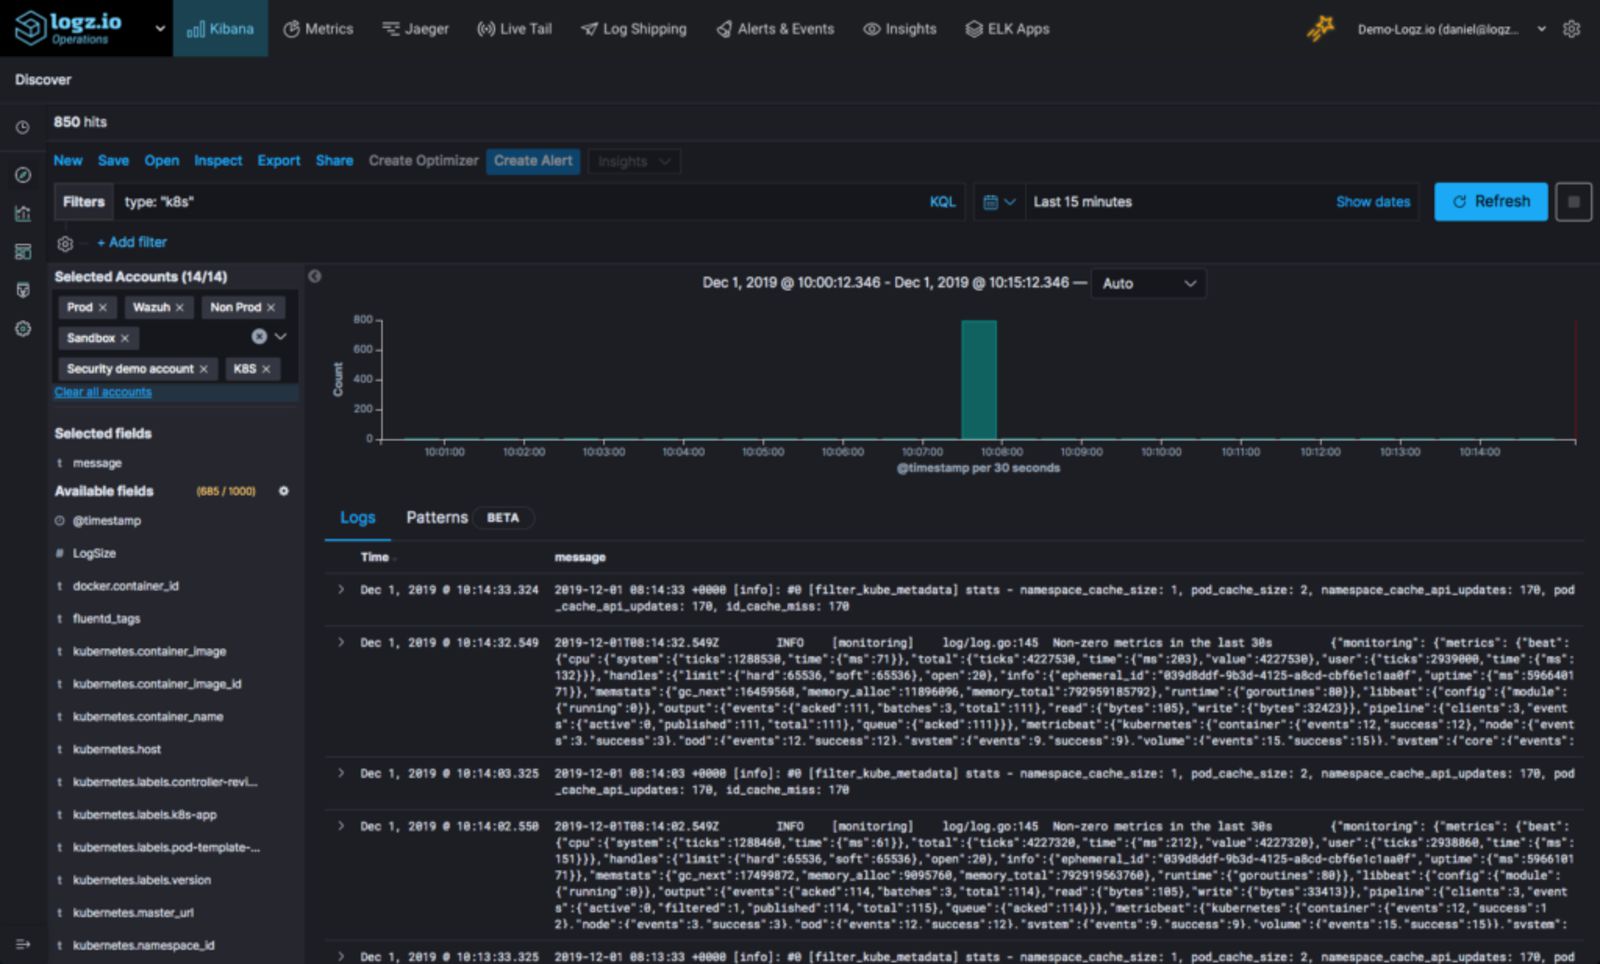
Logz.io is a cloud-based log aggregation and analysis software built on top of Elastic Stack and Grafana, thus ensuring easy scalability, high availability, and security with a highly flexible real-time analytics engine for your log events.
With logz.io, you can search through massive amounts of data in real time and filter results by server, application, or any custom parameter you find valuable to get to the bottom of the problem. It uses machine learning and predictive analytics to detect and solve issues faster. Other features include alerting, log parsing, integrations, user control, and audit trail.
Pros:
- Fully hosted solution working with Elasticsearch compatible log shippers such as Logstash
- Pre-built dashboards
- Common log formats parsing available out of the box
- All in one solution – logs, metrics, traces, and SIEM in one place
Cons:
- Lack of on-premise version
Pricing: The pricing starts with the Community version, a free-of-charge service allowing up to 1GB of daily data ingestion and a data retention of 1 day. It includes up to 10 alerts and automatic parsing, which is awesome and may be enough for small projects. The Pro plan starts with $0.92/GB of ingested data billed annually with 7 days retention. However, it lacks some of the enterprise-level functionalities such as PCI compliance available with the Enterprise plan. The Enterprise plan pricing is not available on the website.
To analyze logs, we need to deliver them to the solution of our choice. Different tools and vendors provide different ways of delivering and accepting the data. Some tools require you to ship the data via Syslog compatible protocol or ship it directly via the HTTP protocol in the text format. Others allow you to ship the data using one of the Elasticsearch compatible log shippers. Finally, there are vendors like Sematext that provide an easy-to-use agent to deliver the log events without the hassle of configuring a log shipper and allow you to use a log shipper of your choice.
Because of different approaches, let’s look at two popular log shipping tools available.
9. Fluentd
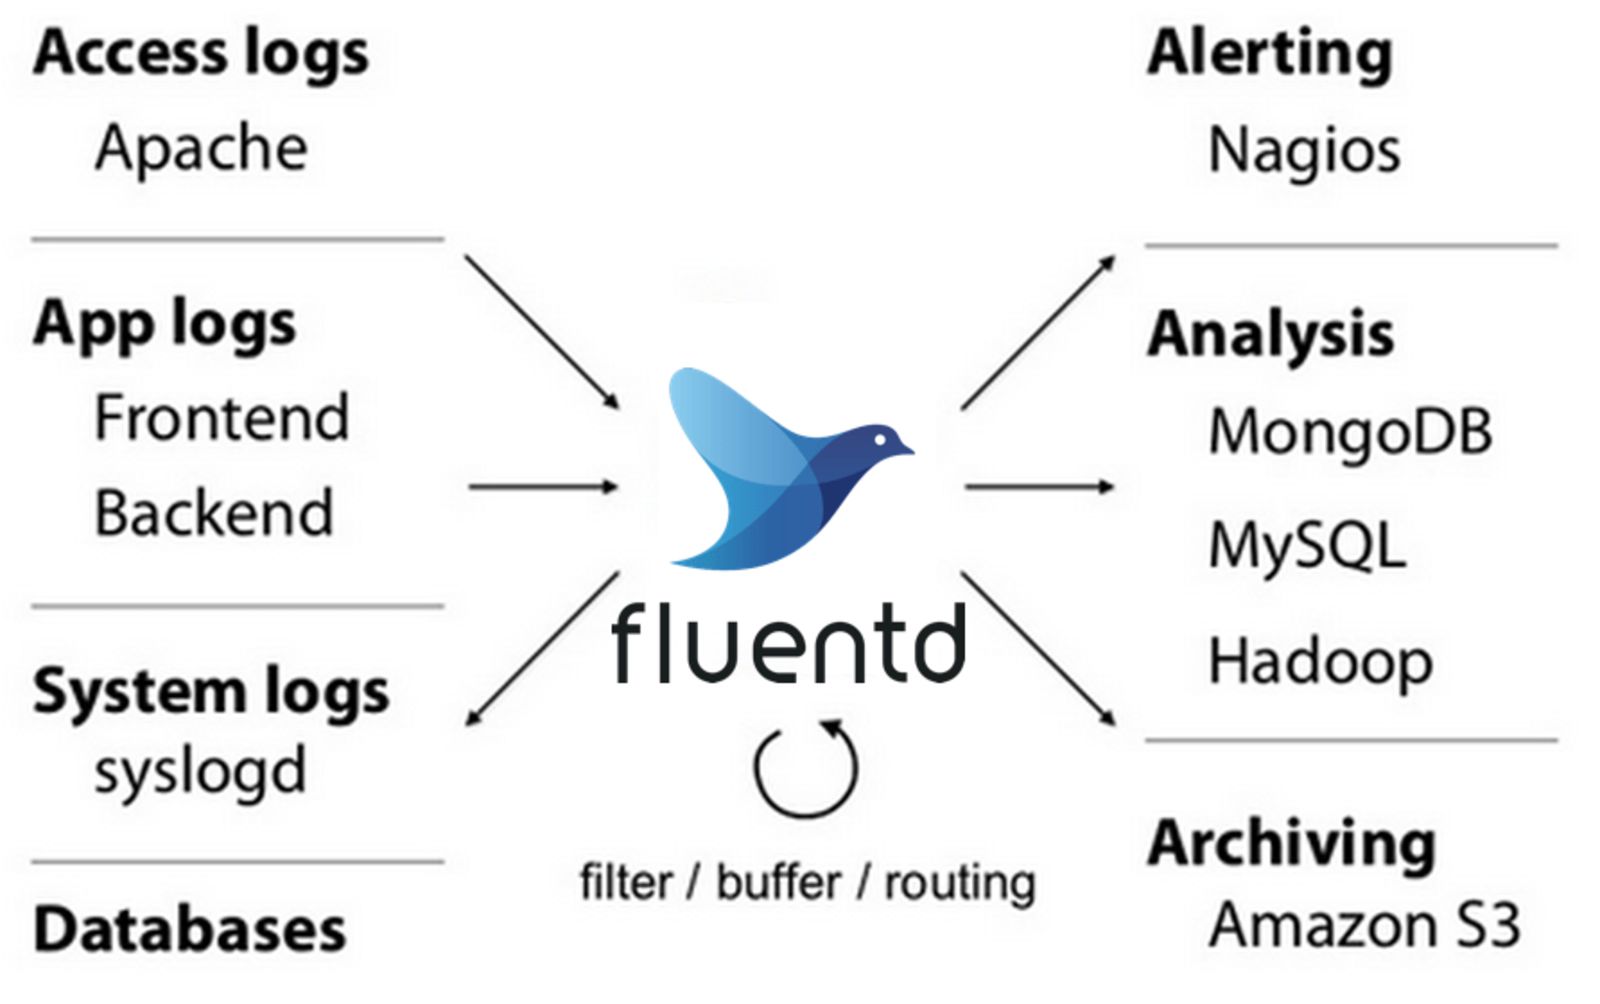
Fluentd is an open-source data collector allowing you to unify the data collection and consumption throughout the organization. It is a feasible log aggregation tool that manages log data from different sources. However, it doesn’t feature a storage tier but allows you to configure the destination. With its pluggable architecture and rich community, you can connect various data sources with multiple destinations and use Fluentd as the log shipper to deliver your precious logs to the log aggregation solution of your choice.
Pros:
- Open sourced and widely adopted with active community
- Minimum resource required to run
- Pluggable architecture with lots of sources and destinations supported
- Built with reliability in mind and battle-tested
Cons:
- Requires learning, as with most open-source solutions
- Don’t expect it to be a one-click installation
Pricing: Fluentd is open-sourced and free of charge. There is no pricing associated with it apart from the cost of learning it and setting it up.
10. Logstash

The second log collector in the article comes from the creators of the Elasticsearch search engine. Logstash is an open-source log aggregator that enables you to ship, parse, and index logs from different sources. It is a server side data processing tool providing pipeline functionalities to read data from various sources, transform them and send them to the destination of your choice. However, keep in mind that the recent versions of Logstash may not be able to send the data to the SaaS vendor of your choice.
Pros:
- Easy configuration and extensive documentation
- Developed and maintained by the company behind Elasticsearch
- Lots of out of the box integrations
Cons:
- May require a vast amount of resources
Pricing: Logstash doesn’t have a price associated with it, and parts of it are licensed under the Apache 2.0 license, while the other parts are available under the Elastic license.
Check out our article about the best cloud logging services if you are interested in other solutions with log aggregations functionalities.
How to Choose the Right Log Aggregation Service for You?
Choosing the right log aggregation service is not easy and may require a long-term commitment. Once you ship the logs, in most cases, you want to have a view into historical data, and exporting the data from different services may be time-consuming, hard, or both. That’s why you should choose wisely and think your decision through.
While each user will have its requirements, we think there are a few points most should consider. Here are the most important ones:
- Check if the log aggregator supports all the necessary functionalities and dashboarding capabilities that you need. It doesn’t matter if you can ship your logs and search through them when in fact, you need to see a summarized view of the numerical data derived from your logs.
- Processing the shipped log data is one of the functionalities you may not need initially, but you will sooner or later. This is about Apache logs – you may want to extract the response codes and draw that on a graph to see the percentage of your customer requests that are handled properly.
- Logs are not the only source of observability data. You also have metrics and traces to consider. If you need those, check if the log aggregation software allows metrics and can connect them via visualizations on dashboards.
- Handling lots of log events manually is not what you want to do daily and you need automation. Verify the tool for functionalities like alerting, anomaly detection and chat ops integration. These will allow you to set up meaningful alerts to be delivered to the destination of your choice.
- The data you send is yours and you should remember that. Check if the log aggregation service allows you to retrieve the data in some form – via the API, third-party storage-like and so on. At one point, you may want to switch to a different vendor and retrieve historical data. Keep that in mind if that is important to you.
- Privacy is also not something you should forget about or ignore. If you, as the company, are legally obligated by laws like GDPR or CCPA, check or ask the provider if they support all the necessary functionalities. Data locality laws may also force you, so you may need to choose the tool that provides its services and keeps the data in the same region as your company.
Conclusion
Log aggregation is a core part of log management. Companies are constantly creating more complex infrastructures containing a multitude of software and applications, making them inherently more susceptible to bugs and errors.
Working with hundreds of log files on hundreds of servers makes it nearly impossible to detect anomalies and solve them before they reach the end user. By aggregating logs, you save time and money and gain better insights into your consumers’ behavior. You definitely shouldn’t delay in looking for a log aggregation tool.
If you want a solution that requires minimum involvement on your part, you should try a hosted “logging as a service” provider such as Sematext Logs. These solutions are responsible for maintaining and setting up any infrastructure you may need, as well as managing the collection, storage, and access to log data. You only need to configure your syslog daemons or agents and trust the rest to these providers.
Try Sematext Logs! Sign up for the 14-day free trial and see how easy it can be to aggregate and analyze your logs!
You might also be interested in: