Evolving MySQL operations requires understanding how MySQL works. A good monitoring tool alerts on issues before they impact end users and helps reduce the MTTR of incidents when they do occur. But choosing a database monitoring solution can be tough due to the vast number of solutions available, each with their own pros and cons.
In this blog post I’ll review some of the best MySQL monitoring tools available that can help measure and improve database performance.
Why Monitor MySQL Database Performance
If your customer base is growing or you’re experiencing frequent performance issues with your MySQL deployment, you need a database monitoring tool.
[product_banner type=”cloud-monitoring”]End-to-end, unified observability for all your environments[/product_banner]
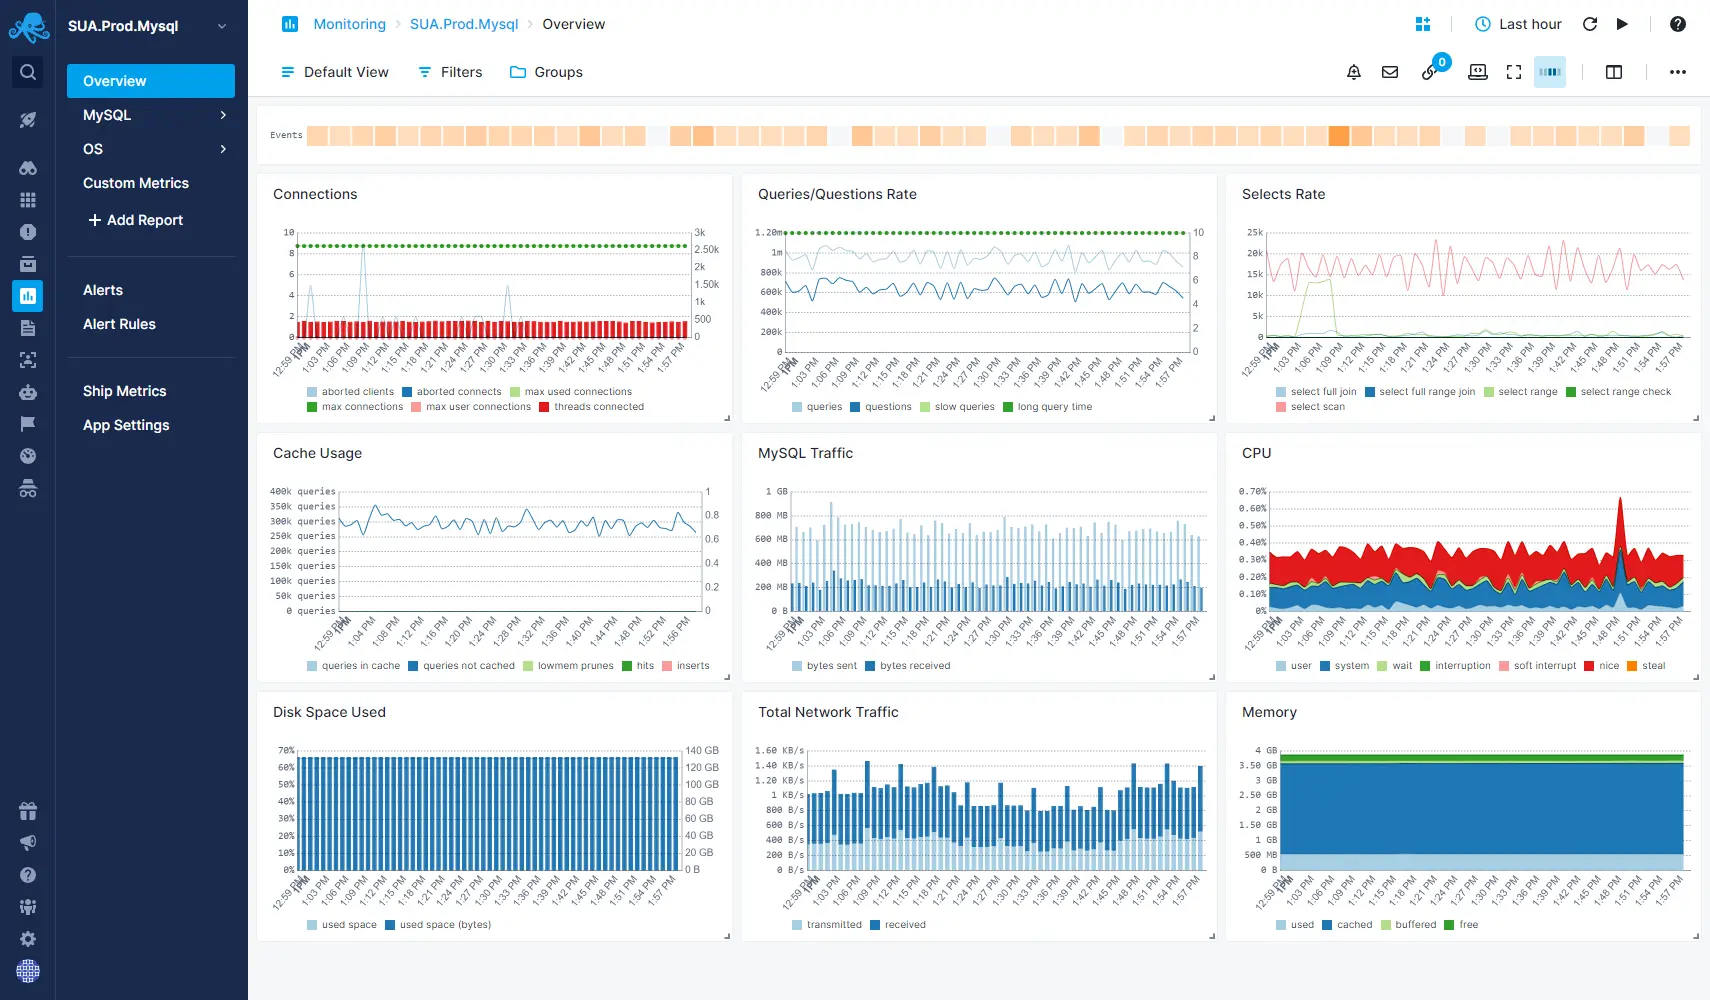
MySQL Monitoring with Sematext
It’s an inexpensive solution that delivers companies great ROI. Not only do metrics allow you to determine whether your MySQL database is healthy, they also help prevent performance issues.
MySQL monitoring tools achieve this through low-level system metrics that offer an overview of your deployment. A good monitoring tool will also send alerts when metrics deviate from a steady state so that you can quickly intervene and avoid potential outages or other customer-impacting issues.
This is particularly important with MySQL. Since databases are often the center of most systems, MySQL frequently ends up being a bottleneck for other services. For example, your services may be leaking database connections. In such cases, MySQL charts help pinpoint the cause by revealing when the issue appeared.
On many occasions, the service my team and I were working on began throwing 5XX response codes. When monitoring is available though, it’s easy to determine if the issue originates in the database. If the database was unhealthy, my team knew that was where we needed to focus our efforts. If, on the other hand, the database was healthy, we knew to look elsewhere. No matter the cause, having monitoring tools at our disposal significantly cuts down on MTTR and getting the system back to a healthy state.
Now that we’ve covered why monitoring MySQL performance is so important, let’s explore how it actually works.
How Monitoring Works
MySQL monitoring tools make regular requests to retrieve MySQL performance statistics. Each response contains information about the MySQL system. This information is then translated into metrics and submitted to a monitoring solution, which allows you to visualize and set up alerts whenever they deviate from their normal state.
Such monitoring solutions gather metrics from the MySQL Performance Schema which contains metadata about a MySQL instance—everything from queries and errors to low-level storage metrics. Since the performance schema is the source of metrics for most tools, the majority of these tools offer very similar visibility. It’s the features, experience, and UI that differentiate them from one another.
You should never overlook the UX and alerting capabilities of your tool. It doesn’t matter how featureful the tool is; if the user experience is painful, adoption will be an uphill battle. I’ve worked with at least six different figure-monitoring tools in the past that had the potential to enable incredible visibility. But the UX was so bad, I ended up abandoning every single one of them.
It’s also important to keep in mind that any monitoring tool you use will require you to create a MySQL user with sufficient permissions to query the system stats. After a user has been set up, most solutions will require an agent to be configured with the credentials.
Next, let’s take a look at MySQL monitoring capabilities.
MySQL Monitoring Capabilities
Monitoring your MySQL database allows you to build a picture of system performance. The following categories of statistics are all essential for determining whether your MySQL is healthy:
- Errors: Rollbacks and aborted connections.
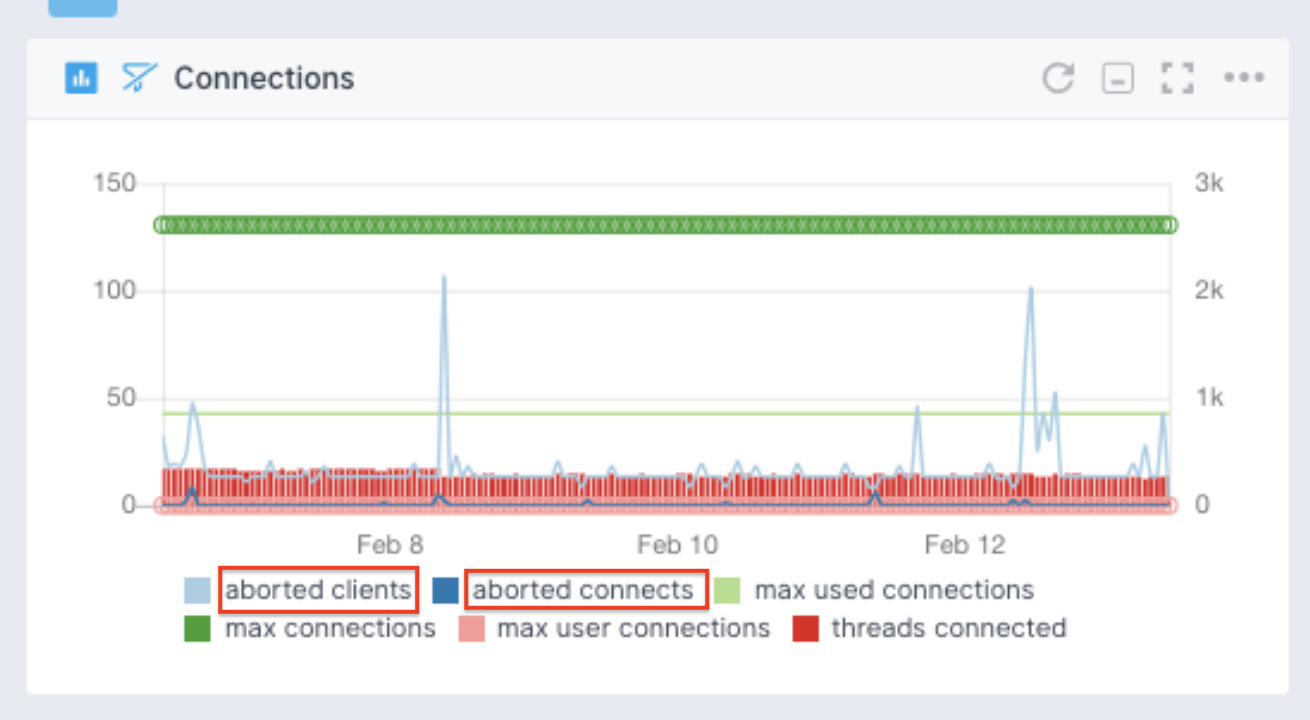
Sematext MySQL monitoring dashboard
- Latency: The duration of queries and operations. How long do queries take on average? Are queries getting slower?
- Sources of latency & slow queries: Table scans/non-indexed lookups.

Figure 3: MySQL monitoring in Sematext
- Resource saturation: Max connections, disk full, replica lag, I/O time, buffer capacity, and cache exhaustion.
- Replication lag: Occurs when follower nodes are unable to keep up with the leaders’ state.
- Max connections: Take action when MySQL connection exhaustion is detected.

MySQL Monitoring in Sematext
- Disk health (swapping): Monitored at the system level. Helps correlate MySQL system metrics to the underlying system resources.
Database Capacity Planning
You can use MySQL metrics to inform optimal database sizing. Capacity planning requires you to choose how much memory, CPU, and disk to provide MySQL. Choosing too small a size increases your chances of overloading MySQL and negatively impacting your end users; choose too large a size, and you’ll end up forking out money for an underutilized instance.
Sizing is therefore a spectrum between:
- Underutilization: Paying for resources that you’re not using.
- Overutilization: MySQL is constantly saturated, affecting end users.
When working on systems, if I see a database deployment that’s overprovisioned, with real data at my disposal, it’s easy to make the case to reduce the instance size and save my company money as a result. Database monitoring thus democratizes data and enables your engineers to make informed decisions.
Monitoring During Incidents
You’ll inevitably have issues that will affect your MySQL database. During an incident, monitoring allows you to learn what has deviated from the previous stable state in order to ensure quick resolution. This, of course, is essential for mitigating the damage and customer impact.
Google’s Four Golden Signals monitoring methodology includes:
- Throughput: How much work is a system doing?
- Results: What’s the result of the work (error vs. success)?
- Latency: How long is the work taking?
- Saturation: Does the system have enough capacity to service the workload?
During an incident, you need to be able to answer these four questions. Each of the MySQL monitoring tools covered below provides the metrics necessary for incident responders to answer them. Lacking metrics during an incident is like flying blind. That’s why the very first thing I do when working with new systems is introduce monitoring.
Top 6 Tools to Monitor MySQL Databases
Now that you know how monitoring works and what metrics to track, the next step is figuring out which solution is right for you. To help you decide, I tested and compared the most popular MySQL monitoring tools. Below are my top-ranked tools:
1. Sematext MySQL Monitoring
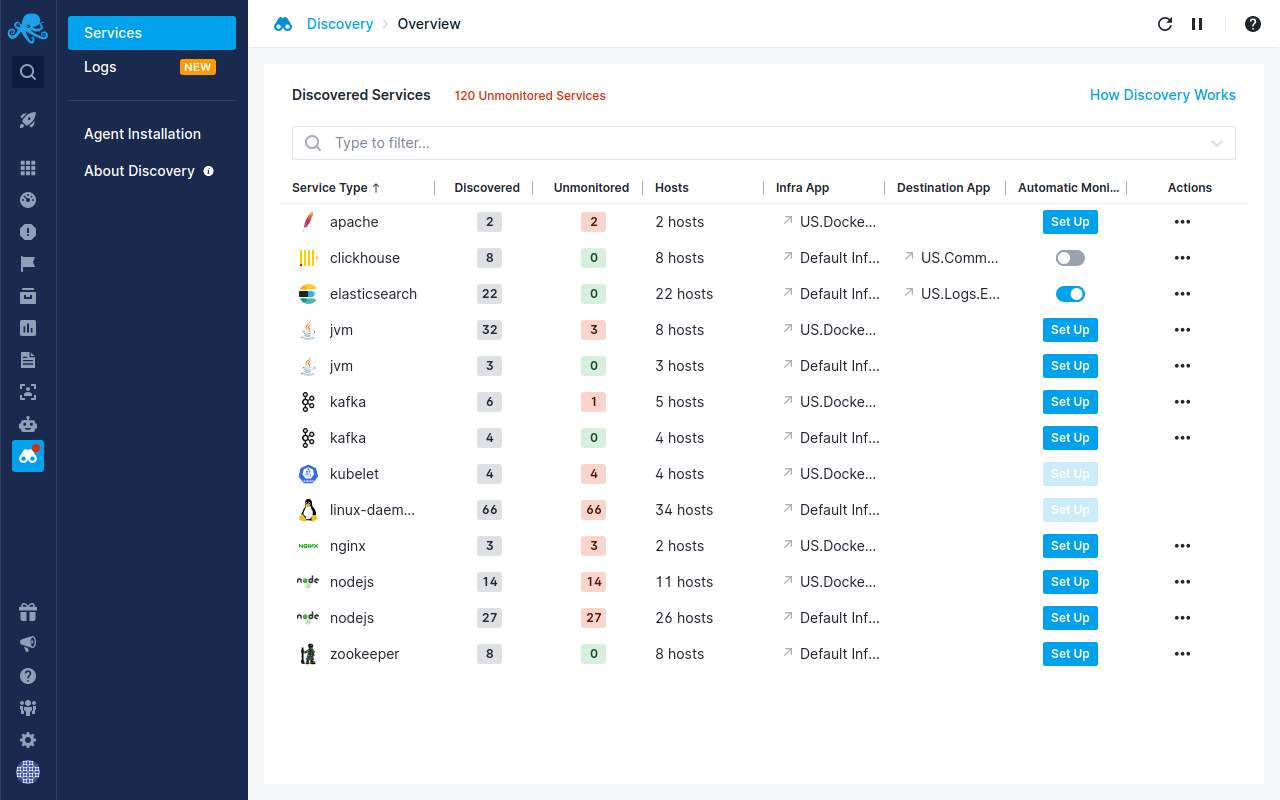
Sematext is a full-stack observability solution MySQL monitoring capabilities. You can use it not only for MySQL performance metrics, but also MySQL logs, while also offering infrastructure monitoring tools for 100+ Sematext monitoring integrations.
Sematext features service auto-discovery, enabling you to automatically start monitoring your MySQL instances directly through the user interface.
In addition to out-of-the-box MySQL performance dashboards, collecting any MySQL metrics that are not included by default is easy. You simply add it to these open-source agent YAML files and you’re all set. The monitoring agent source code is open source, too.
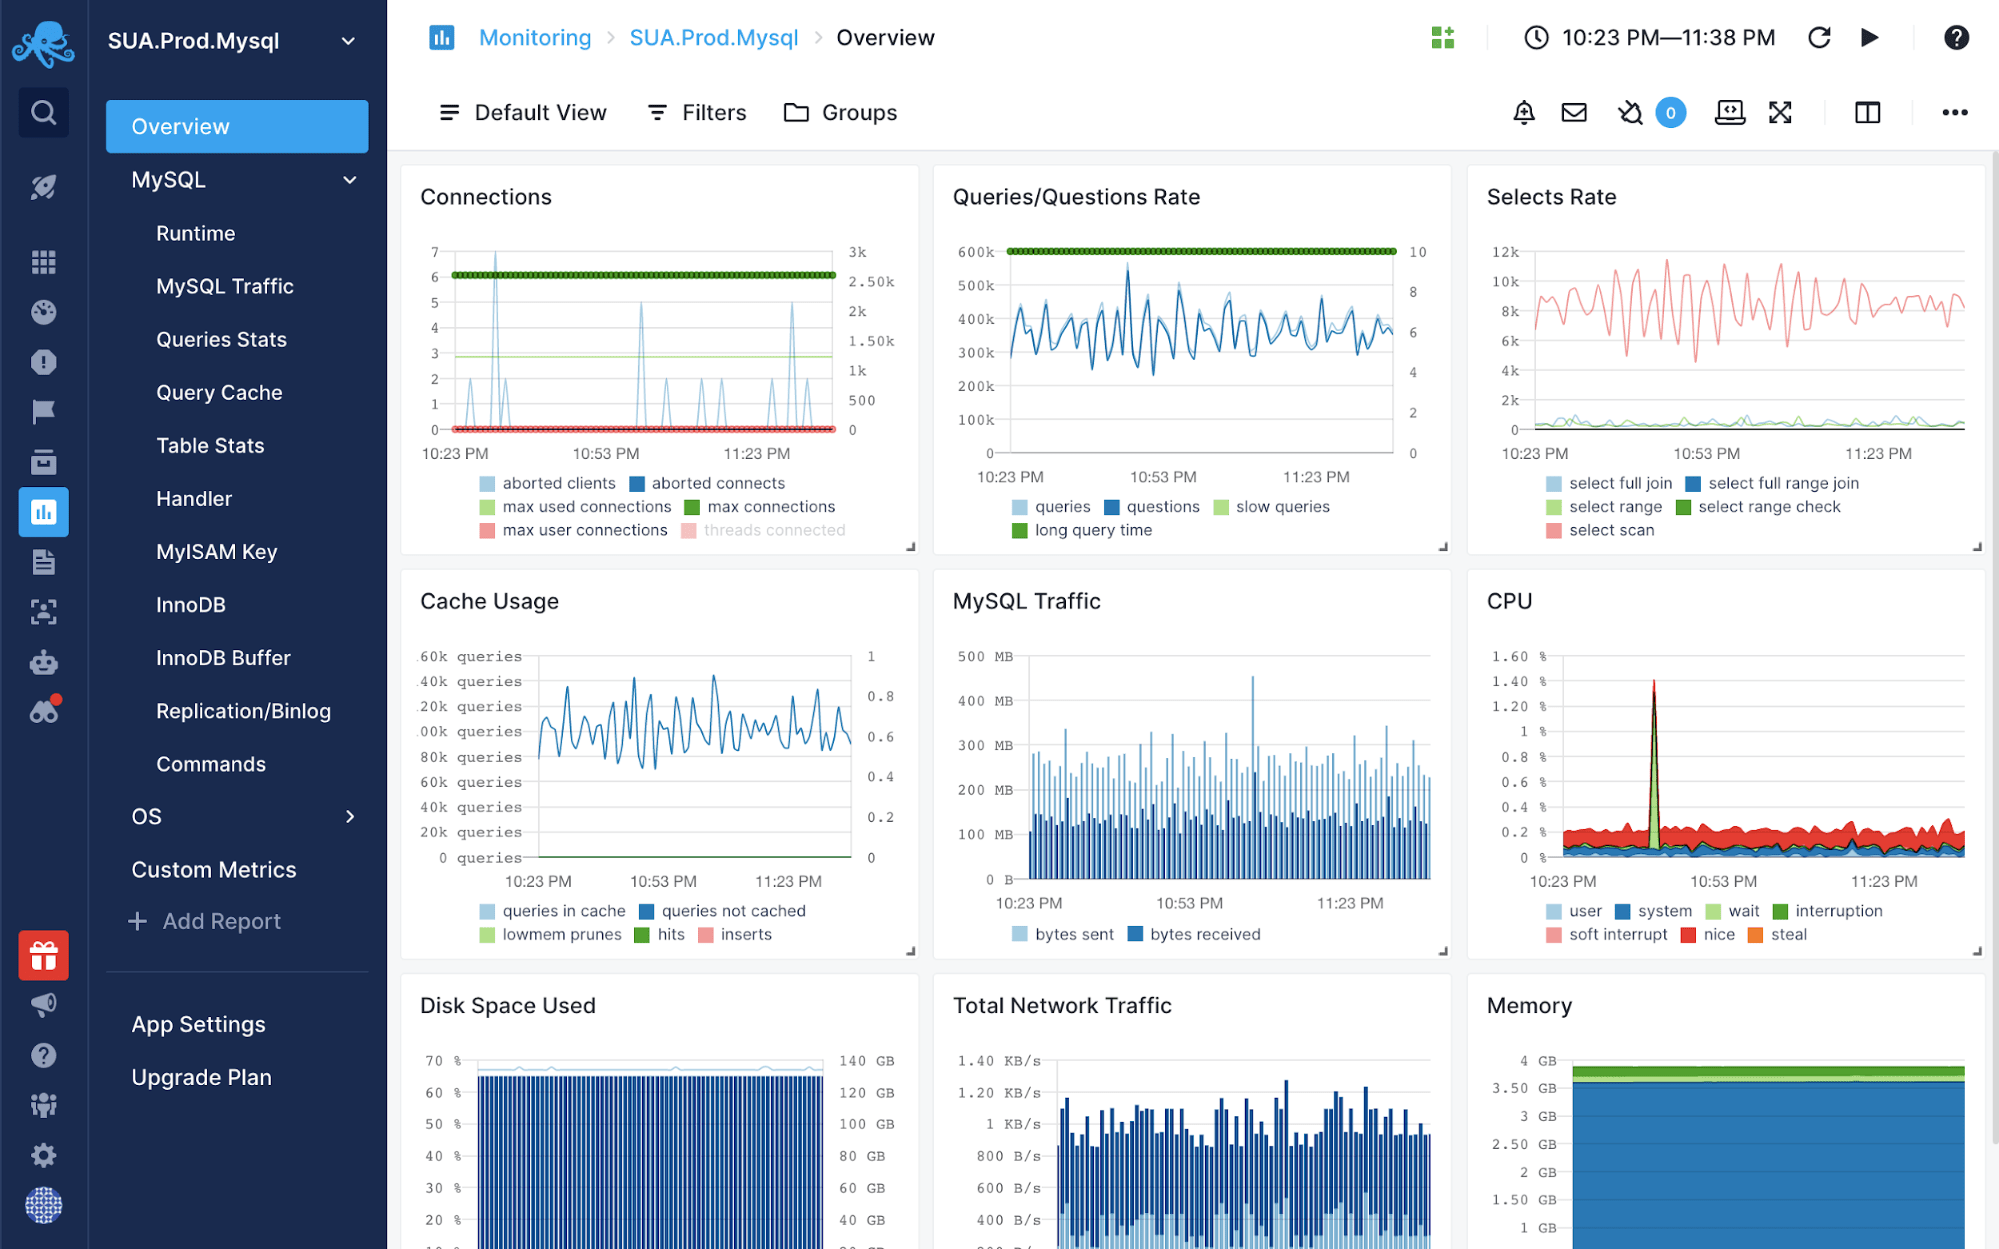
Sematext MySQL Monitoring tool (Source: sematext.com)
Monitoring Capabilities
- Nearly 200 MySQL performance metrics out of the box along with a number of system metrics.
Pros
- Easy to set up.
- Available as both SaaS (nothing to manage) or an on-premises solution.
- Part of a full-stack monitoring platform, so easy to correlate MySQL performance with metrics, events, and logs from other parts of the infrastructure and application stack.
- Numerous out-of-the-box dashboards and charts, as well as alert rules.
Cons
- Only the agent is open sourced.
- No annual pricing as of this writing, though bundling discounts are available.
Pricing
Priced at $10.08 a month per MySQL server/instance.
2. Percona Monitoring and Management Tool (PMM)
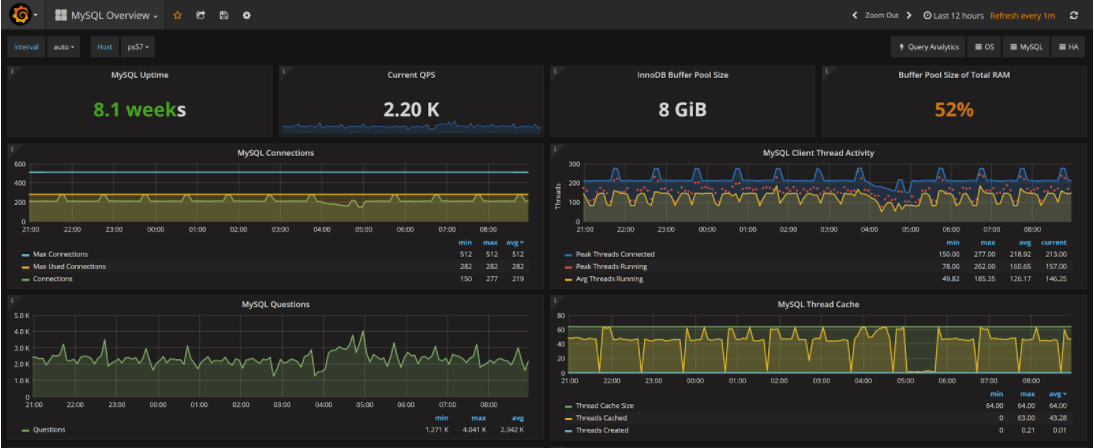
The Percona Monitoring and Management tool (Source: Percona.com)
PMM is an open-source monitoring toolkit built on the Prometheus ecosystem. It provides out-of-the-box dashboards to help you understand your MySQL system performance. PMM leverages Prometheus through the MySQLD Exporter tool (covered later) to extract MySQL metrics. Mysqld_exporter requires access to query your MySQL instances.
Monitoring Capabilities
- Slow queries
- Errors
- Replication lag
- Max connections
- Disk health (swapping)
Pros
- Easy to use and set up
- Comprehensive help guide
- Out-of-the-box monitoring dashboards (unlike solutions providing only raw metrics or a single pre-made dashboard).
Cons
- Requires running your own infrastructure, resulting in more overhead than SaaS solutions.
- Additional maintenance (people, time, expertise) required also increases costs.
- Alerts are not natively built-in. That requires you to run another Prometheus component called Alertmanager.
Pricing
PMM is a free and open-source toolkit. The cost of running the connectors falls on you and your team.
3. VividCortex MySQL Analyzer
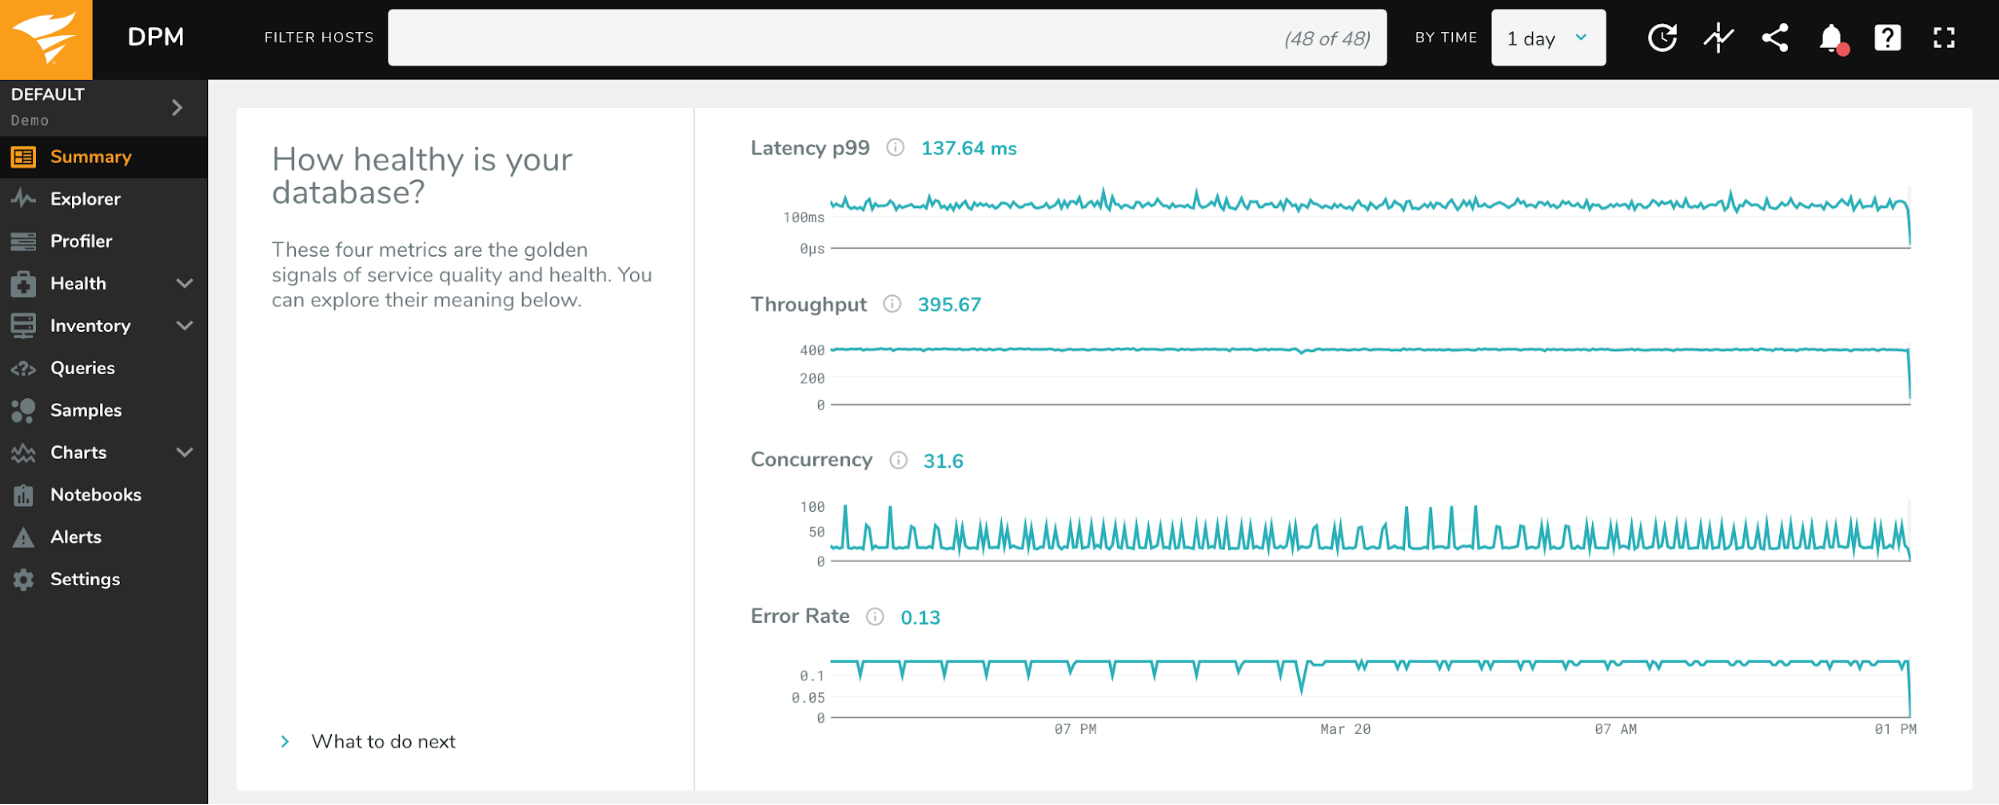
VividCortex MySQL Analyzer (Source: VividCortex)
VividCortex is a monitoring SaaS that collects metrics using an agent. The agent, which requires access to MySQL performance statistics tables, ships those metrics directly to VividCortex.
VividCortex guides you on which metrics you should monitor. Like PMM, VividCortex provides out-of-the-box dashboards to identify performance issues with your MySQL deployments. But it takes this a step further by emitting “events” around important monitoring states. For example, if you’re getting closer to the maximum number of allowed MySQL connections, it will emit an event. This approach removes ambiguity around which metrics are important to monitor.
Monitoring Capabilities
- Errors
- Latency
- Slow queries
- Replication health
- Max connections
- Disk health (swapping)
Pros
- Simple agent-based installation eliminates the need for hosting metric infrastructure.
- Easy to set up.
Cons
- No public price listing; must contact a sales agent for a quote.
- Acquired in December 2019 by SolarWinds, which hasn’t shown much innovation with its previous acquisitions (e.g., Loggly).
Pricing
The pricing information is not public and is available only upon request.
4. MySQL Enterprise Monitor
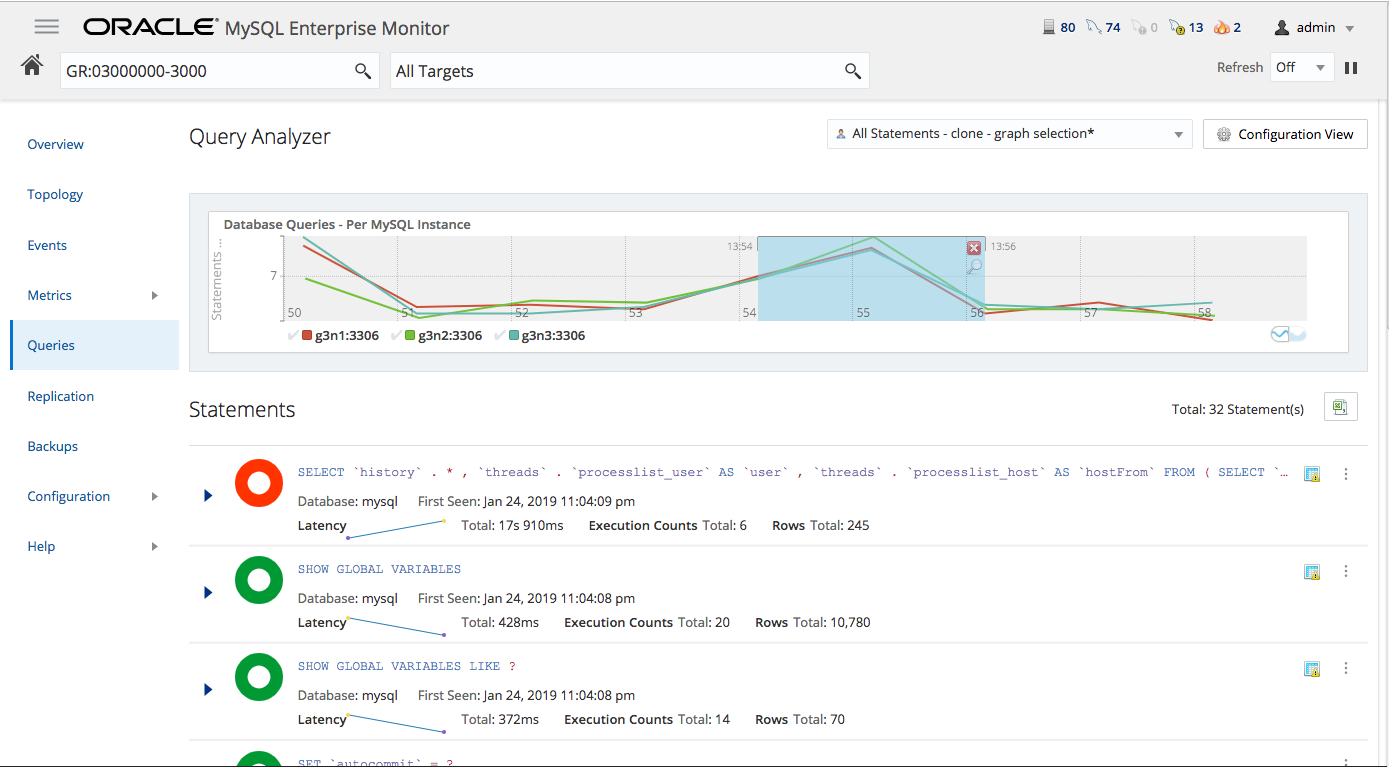
MySQL Enterprise Monitor query analysis (Source: MySQL Enterprise Monitor)
MySQL Enterprise Monitor (MEM) is Oracle’s officially supported MySQL monitoring tool. Like the other solutions mentioned here, MEM relies heavily on the MySQL Performance Schema for retrieving metrics.
Monitoring Capabilities
- Errors
- Latency
- Slow queries
- Replication health
- Max connections
- Disk health (swapping)
Pros
- Allows you to dig in to individual queries.
Cons
- Expensive, despite being the official Oracle monitoring solution.
- Not a managed service.
- Documentation is lacking and not up to date.
Pricing
At $5,000 a year per server, MEM is certainly one of the more expensive monitoring tools out there. In addition, it’s only available through MySQL support subscriptions, and you must purchase full support to access it.
5. Datadog MySQL
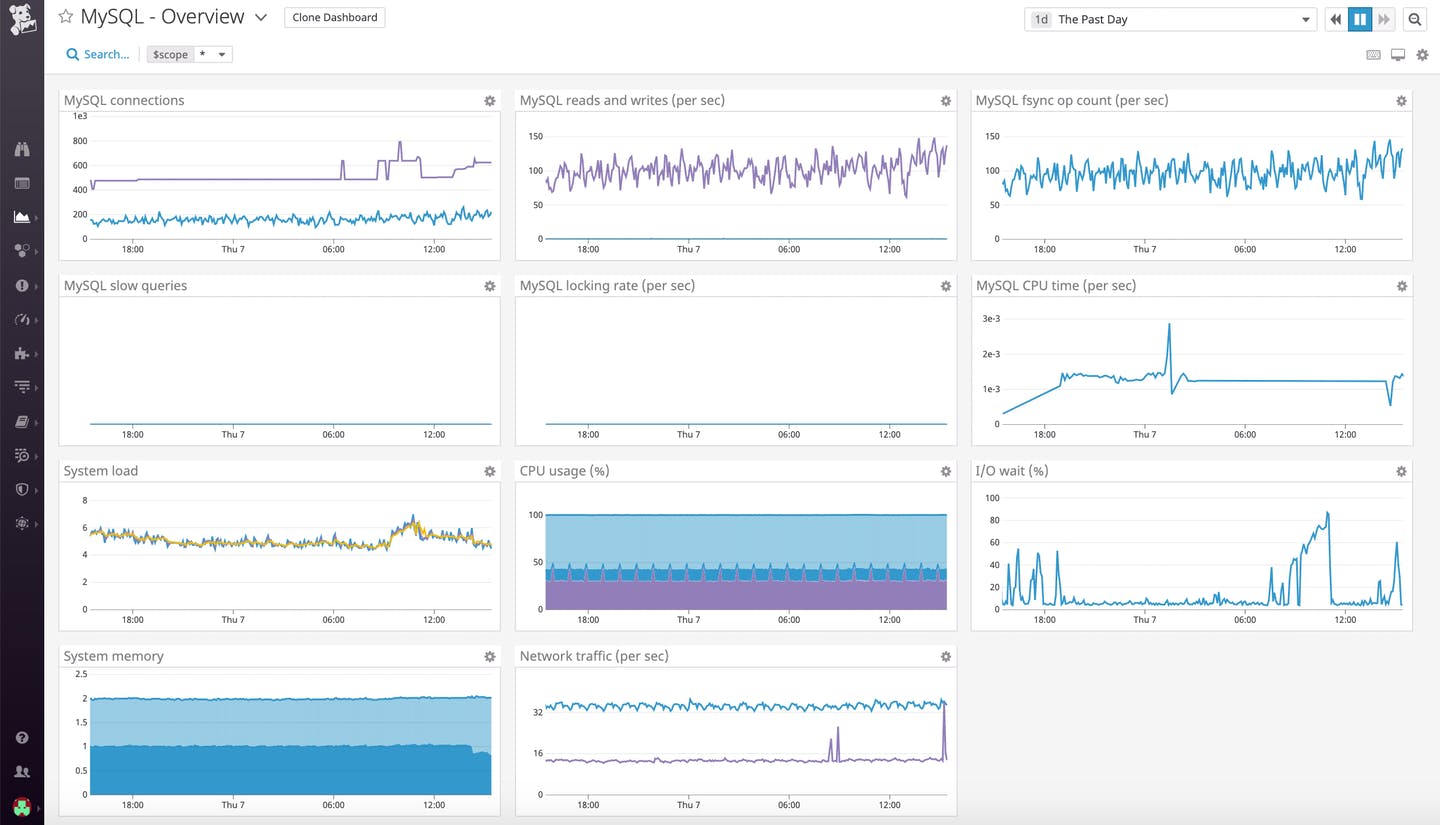
Datadog MySQL dashboard (Source: Datadog)
Datadog is a cloud-based monitoring solution that’s available in several modules, MySQL monitoring being part of their APM service. Their MySQL integration agent polls your MySQL Performance Schema and emits the metrics, which are then generated and displayed in the Datadog dashboards.
Monitoring Capabilities
- MySQL down
- Latency
- Errors
- Replication health
- Max connections
- Disk health (swapping)
Pros
- Hosted SaaS.
- Correlate MySQL performance metrics with other service metrics.
- Alerting capabilities.
Cons
- Limited documentation available.
- Limited number of out-of-the-box MySQL dashboards.
- Mainly end user’s responsibility to monitor MySQL.
Pricing
Datadog comes in at $18 per month per MySQL instance.
Want to see how Sematext stacks up? Check out our page on Sematext vs Datadog.
6. Prometheus and MySQLD Exporter
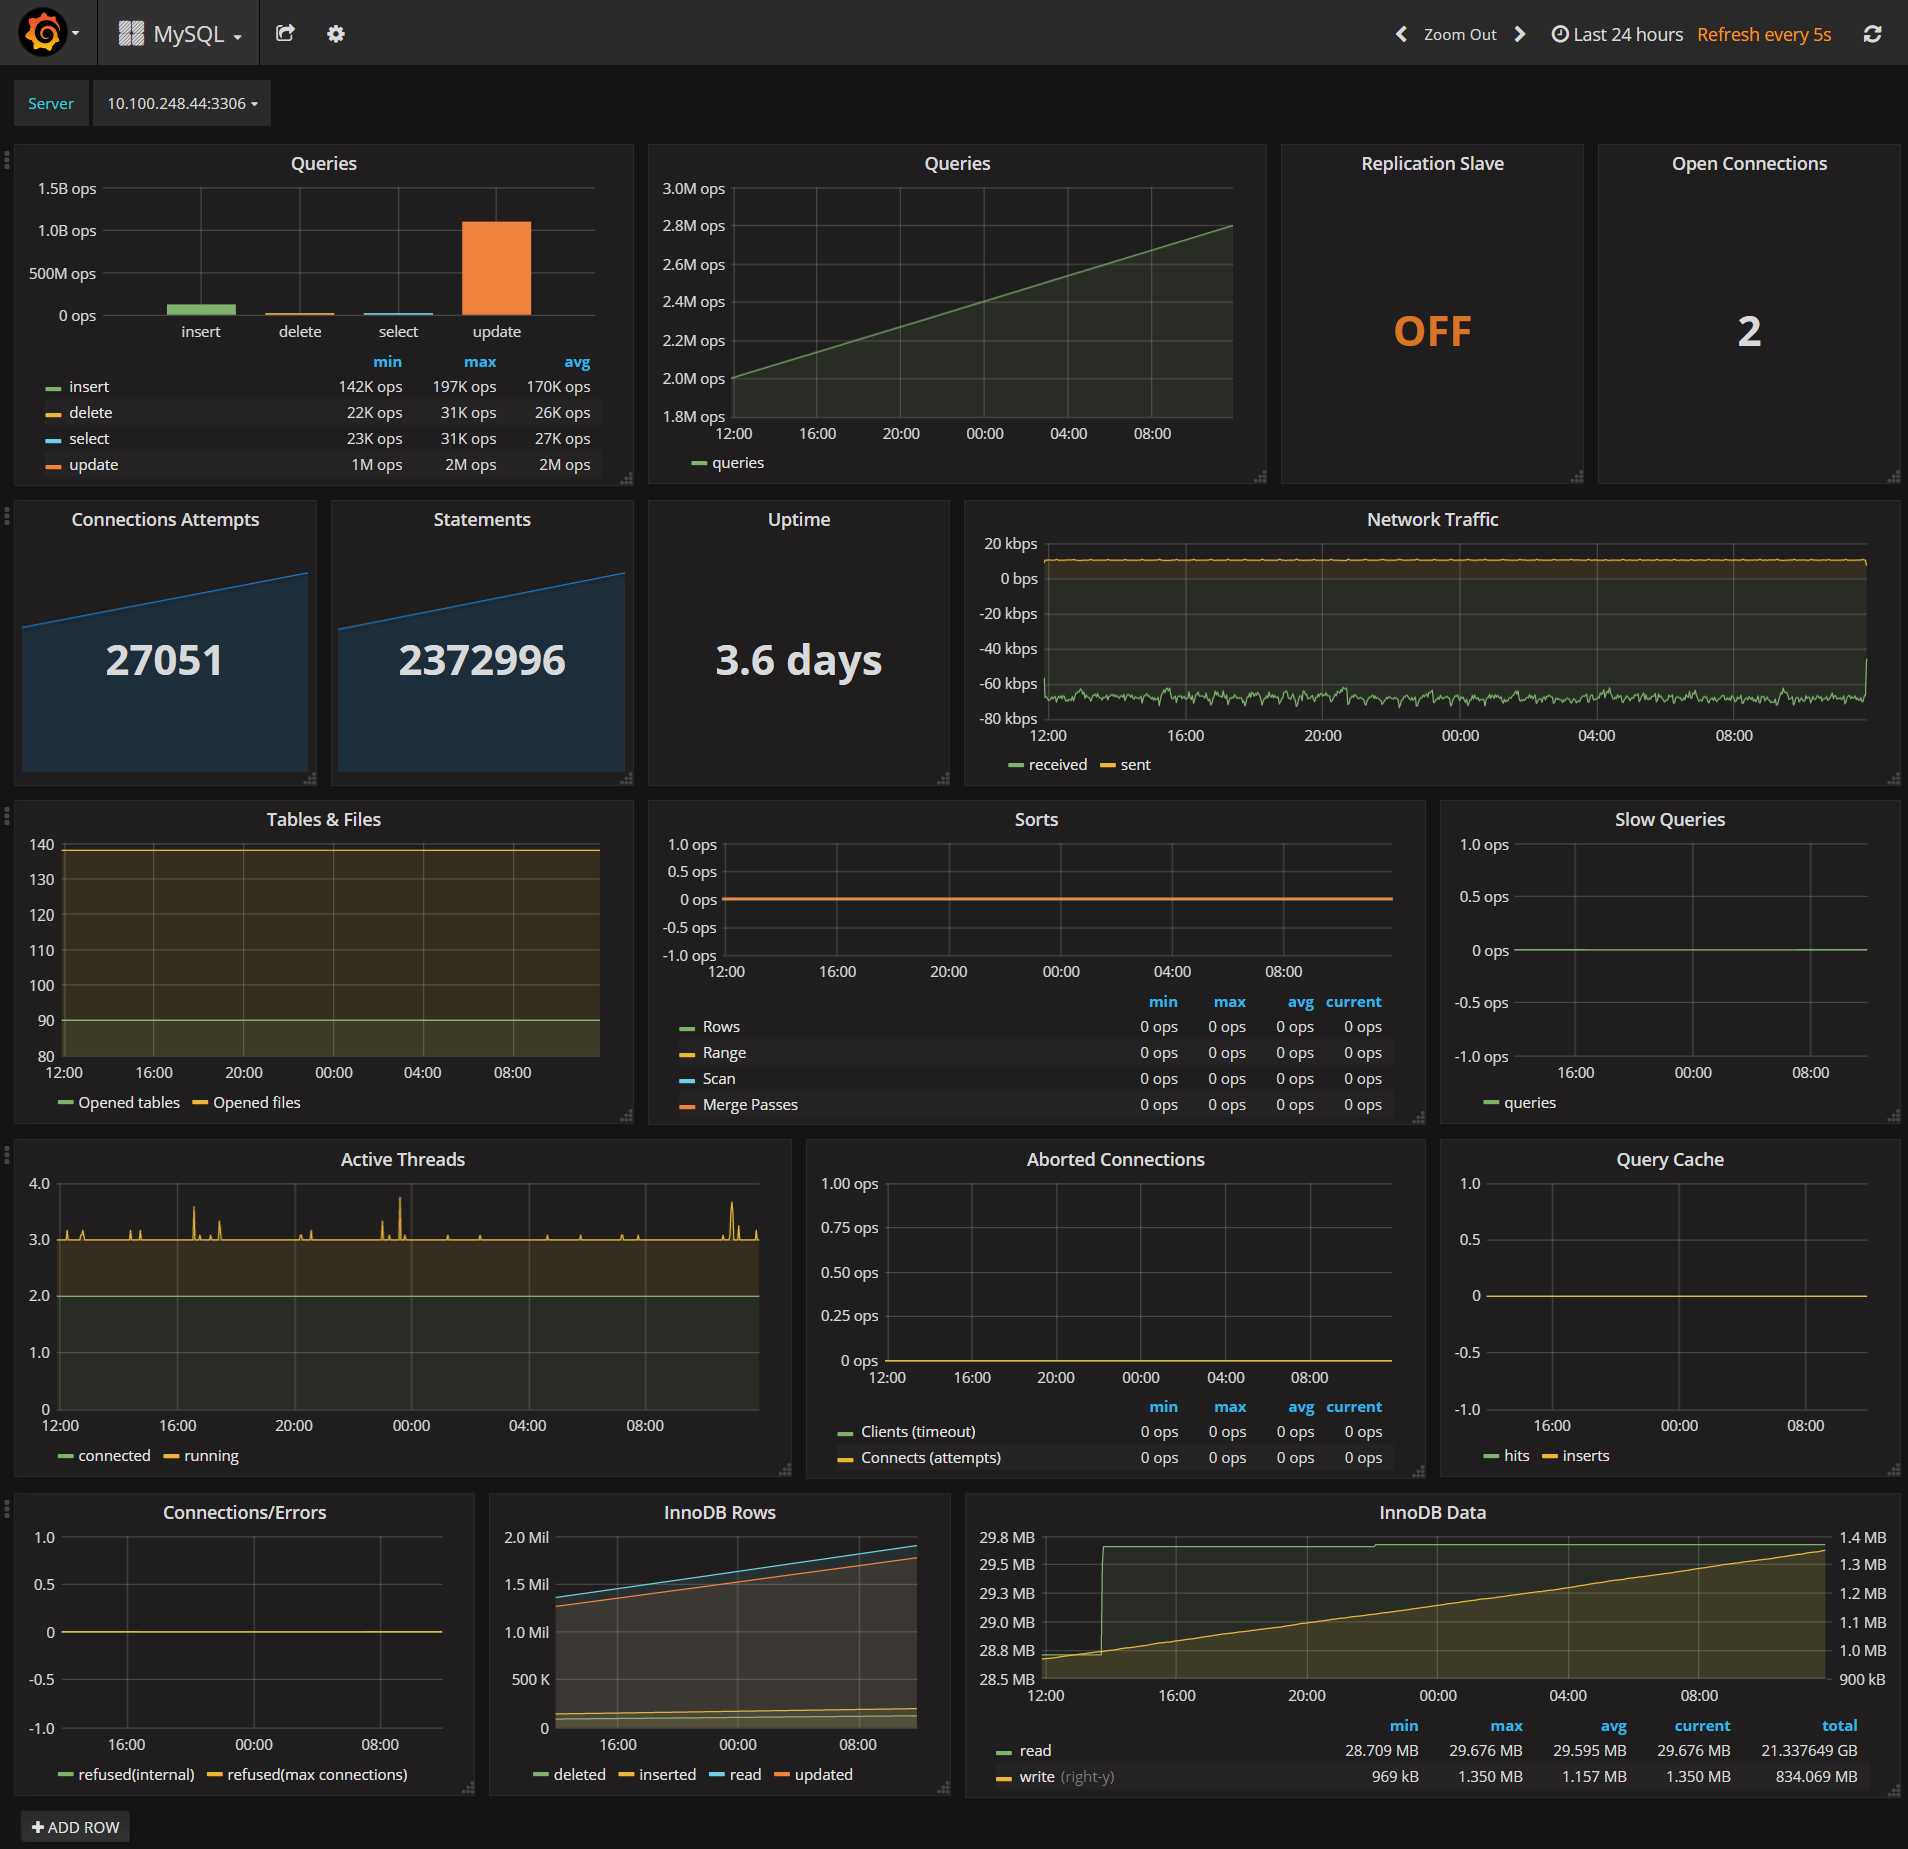
MySQL Grafana system dashboard (Source: MySQL Grafana Dashboard)
Prometheus is an open-source monitoring tool inspired by Google’s internal monitoring solution. It’s extremely popular, with over 33,000 stars on GitHub. This database monitor requires running the MySQLD Exporter service, which queries MySQL for performance statistics. It also requires running the Prometheus service as well as a separate visualization tool such as Grafana.
Monitoring Capabilities
- MySQL down
- Latency
- Errors
- Replication health
- Max connections
- Disk health (swapping)
Pros
- Relatively easy to operate.
- Large and active community.
Cons
- Not a managed service.
- Requires running MySQLD Exporter on top of Prometheus.
- User is responsible for running the Prometheus ecosystem alerting solution (AlertManager).
- No prepackaged version of these components available.
Pricing
Both Prometheus and MySQLD Exporter are free and open source. You only need to pay for the resources and people required to run them.
How to Choose the Right Monitoring Tool for Your Use Case
When choosing a MySQL performance monitoring tool, you should consider:
- Hosting model: Self-hosted vs. SaaS.
TIP: While self-hosted may look like the cheaper option, when you take into account the infrastructure and maintenance costs—which are almost always underestimated—SaaS is often less expensive. - User experience: Dashboards.
TIP: Look for solutions that feature out-of-the-box dashboards to save you the time of having to research what metrics to monitor, how to aggregate them, and then create the dashboards yourself. - Alerting: Ability to route notifications to chat or incident response service.
TIP: Look for solutions with built-in and seamlessly integrated alerting to simplify your workflow. - Pricing: Cost of the solution and additional tools.
TIP: When comparing solutions, consider whether you’ll need to pay to run other tools in parallel, and make sure to take into account infrastructure, people, time, and effort to calculate the TCO (total cost of ownership).
All of the solutions I’ve reviewed today should provide you with enough information to determine whether your MySQL database is healthy.
Conclusion
With databases like MySQL at the heart of most applications, ensuring visibility into your MySQL deployment is crucial. A monitoring solution helps by detecting if your MySQL becomes unhealthy, so you don’t end up finding out from your customers that your database is down.
All of the above MySQL monitoring tools provide metrics that allow you to understand MySQL clients (how many, how long, results, etc.) and the internal MySQL state (buffers, threads, pages, etc.). But no matter which vendor you choose, going from little or no metrics to using one of these tools is sure to supercharge your MySQL operations.
You might also be interested in:
Author Bio

Danny Mican
Danny has been working with relational databases for over 10 years. He currently works for auth0 keeping their data infrastructure working. He regularly does audits of different database systems and monitoring solutions.