Log monitoring tools enhance visibility by centralizing data from multiple applications and infrastructure elements, thus ensuring your organization’s good health and its business performance.
Companies face increasing challenges in managing their IT infrastructure, especially in a rapidly evolving digital landscape. Log monitoring software enables IT professionals to effectively manage, analyze, and visualize log data generated by various systems and applications, helping them diagnose and resolve issues, identify potential problems, and maintain system performance.
In this blog post, we will provide you with a comprehensive list of the best log monitoring tools and software, free and paid, and help you choose the perfect solution for your organization.
What Is a Log Monitoring Tool?
A log monitoring tool is a specialized application enabling real-time analysis, visualization, and management of log data generated by various applications and infrastructure elements. Log monitoring tools centralizes all your organization’s logs, providing a comprehensive view into the occuring events. Thus, log monitoring helps with root cause analysis, shortens issue resolving times and enhances proactive issue identification.
These software often come with out-of-box preconfigured templates that help you parse data and visualize incoming log information. They usually provide a complex set of features such as log data alerts, anomaly detection, notifications with ChatOps integration, or correlation with metrics and traces.
Such log monitoring tool functionalities are key for any IT organization that pays attention to the health, availability, and performance of its infrastructure and applications.
Best Log Monitoring Tools
1. Sematext Logs
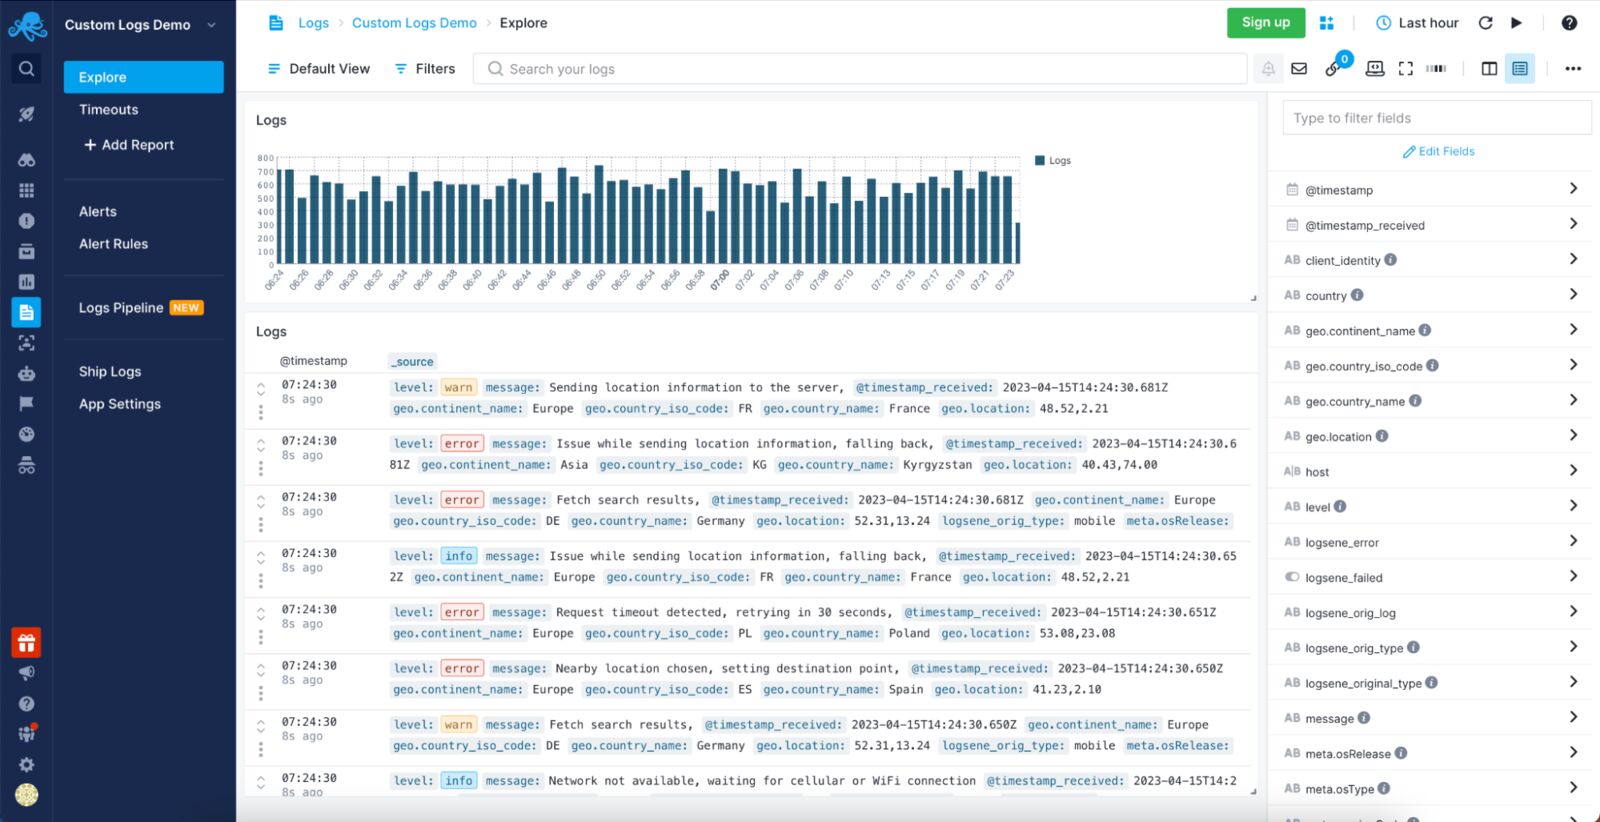
Sematext Logs is a log monitoring and analysis tool that allows you to easily slice through various log formats. It provides out-of-the-box dashboards with pre-configured visualizations for common applications and infrastructure elements such as NGINX, Apache, JVM Logs, and many more. These visualizations give you the most important information coming from your logs, allowing you to view the data in a single pane of glass making Sematext the go-to log monitoring tools. Here you can correlate logs with events and metrics, live-tail logs, add alerts to logs, and use Google-like syntax for filtering. Sematext’s powerful search and filtering capabilities give you the log context needed to find log events occurring before and after the one you are currently inspecting.
Features
- Powerful log-based visualizations allow you to draw charts based on the data from logs.
- Live Tail provides a real-time view of your logs as they stream into Sematext Logs.
- Multi-user role-based access control.
- Rich library of supported log shipping tools and integrations.
- Saved searches and log tagging support.
- Alerting with anomaly detection and delivery schedule.
Pros
- Provides an agent with pre-configured parsing rules for common formats like Apache common or Java garbage collector.
- Accepts data from various sources that can ship data in Elasticsearch-compatible format allowing integration of log events from various sources inside your environment.
- Once shipped, you can manipulate the data via user-friendly Logs Pipelines that enable further data processing, such as numerical data extraction, IP to geolocation mapping, and many more.
- Ease of integration with the rest of the Sematext Cloud offerings like Experience (Real User Monitoring), Synthetics, and Infrastructure Monitoring, giving you a full observability solution in a single tool.
Cons
- No support for unstructured text. You can only send JSON-formatted log events, use Syslog to send data, or use the provided agent that supports a limited set of common formats.
- It doesn’t allow mixing Kibana and Sematext native UI widgets in a single dashboard – it is one or the other.
Pricing
Sematext Logs’ pricing model starts with a Basic plan allowing up to 500MB/day worth of logs and 7 days of data retention for free. The Standard plan has a limited set of features and starts at $50/month and includes 1GB/day and 7 days retention, which translates to around $0.1/GB of received data and $1.67/GB of stored data. The fully-featured Pro plan has Logs Pipelines, Log Archiving, and more, starting at around $60/month for 1GB/day of data and 7-day retention, meaning $0.1/GB of received data and $2.00/GB of stored data.
If you want a sneak peek of Sematext Logs in action, watch the video below:
Sematext Logs Product Overview | Centralized Logging for all of your Applications
2. Elastic Stack
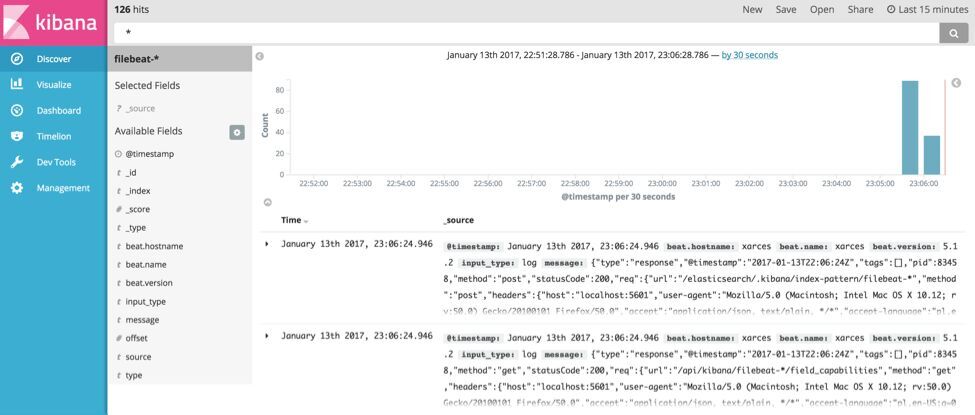
Elastic Stack, formerly known as ELK Stack, is a powerful open-source log monitoring and analysis platform, composed of three main components: Elasticsearch, Logstash, and Kibana.
Elasticsearch is a distributed search and analytics engine used for indexing your logs and providing real-time search and analysis capabilities. Logstash is the log processing and shipping tool that collects logs from various sources and enriches and transforms them before sending them to Elasticsearch. Finally, Kibana is a configurable visualization tool with support for a variety of visualization components and dashboards. Together, they provide a comprehensive solution for log monitoring, helping you identify patterns, troubleshoot issues, and gain insights into application and infrastructure elements.
Features
- Logging support for any kind of technology available, allowing easy correlation between events across your infrastructure, thus enabling faster troubleshooting.
- Scalable and distributed architecture supporting large data volume and long retention.
- Rich, virtually unlimited visualizations.
- Near real-time log indexing and search capabilities.
- Customizable data processing pipeline.
Pros
- Open-source and widely adopted.
- High performance and scalability.
- Relatively easy to set up and use.
- Advanced search and analytics capabilities.
Cons
- Can be resource-intensive, especially for large-scale deployments.
- Steeper learning curve for advanced features and configurations.
Pricing
The Basic version of Elastic Stack is free but self-managed, so you need to consider its toll – maintenance. It has limited features, including machine learning that becomes available with the platinum-grade tier, which starts at $125 a month.
3. Graylog
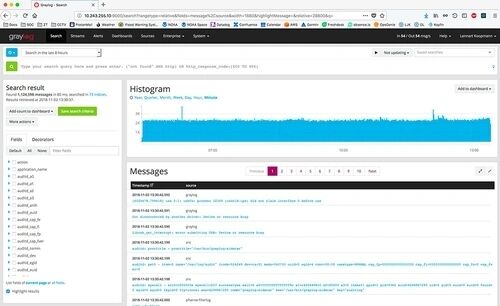
Graylog is an open-source, centralized log management solution that specializes in log monitoring and analysis. The tool leverages the powerful search and analytical capabilities of the Elasticsearch or OpenSearch engines that it is based on. The powerful processing pipeline ingests logs from various sources, then parses and enriches them before sending the log data to Elasticsearch for indexing; thus allowing for enhanced transformations and efficient processing. The solution offers a user-friendly interface, allowing you to search, filter, and visualize logs through customizable dashboards and build alerting based on them.
Features
- Built-in log processing and parsing capabilities.
- Alerting and event correlation for proactive monitoring.
- Role-based access control and security features.
- Support for “Content packs”, such as pre-configured input, output, processing intelligence, and visualizations allowing quick integration.
- Fault tolerance with the use of Graylog message journal.
Pros
- Open-source with a strong community behind it.
- Intuitive interface for easier log analysis with dashboarding support.
- Pre-built content packs for easy integration with common platforms.
- Flexible and extensible with the use of plugins and API.
- The newest versions of Graylog support both Elasticsearch and OpenSearch.
Cons
- Has a smaller ecosystem compared to ELK Stack.
- Advanced configuration and scaling may be challenging.
- Limited visualization options compared to Kibana.
Pricing
Graylog Open is free to use, open-source and self-managed.
4. GoAccess
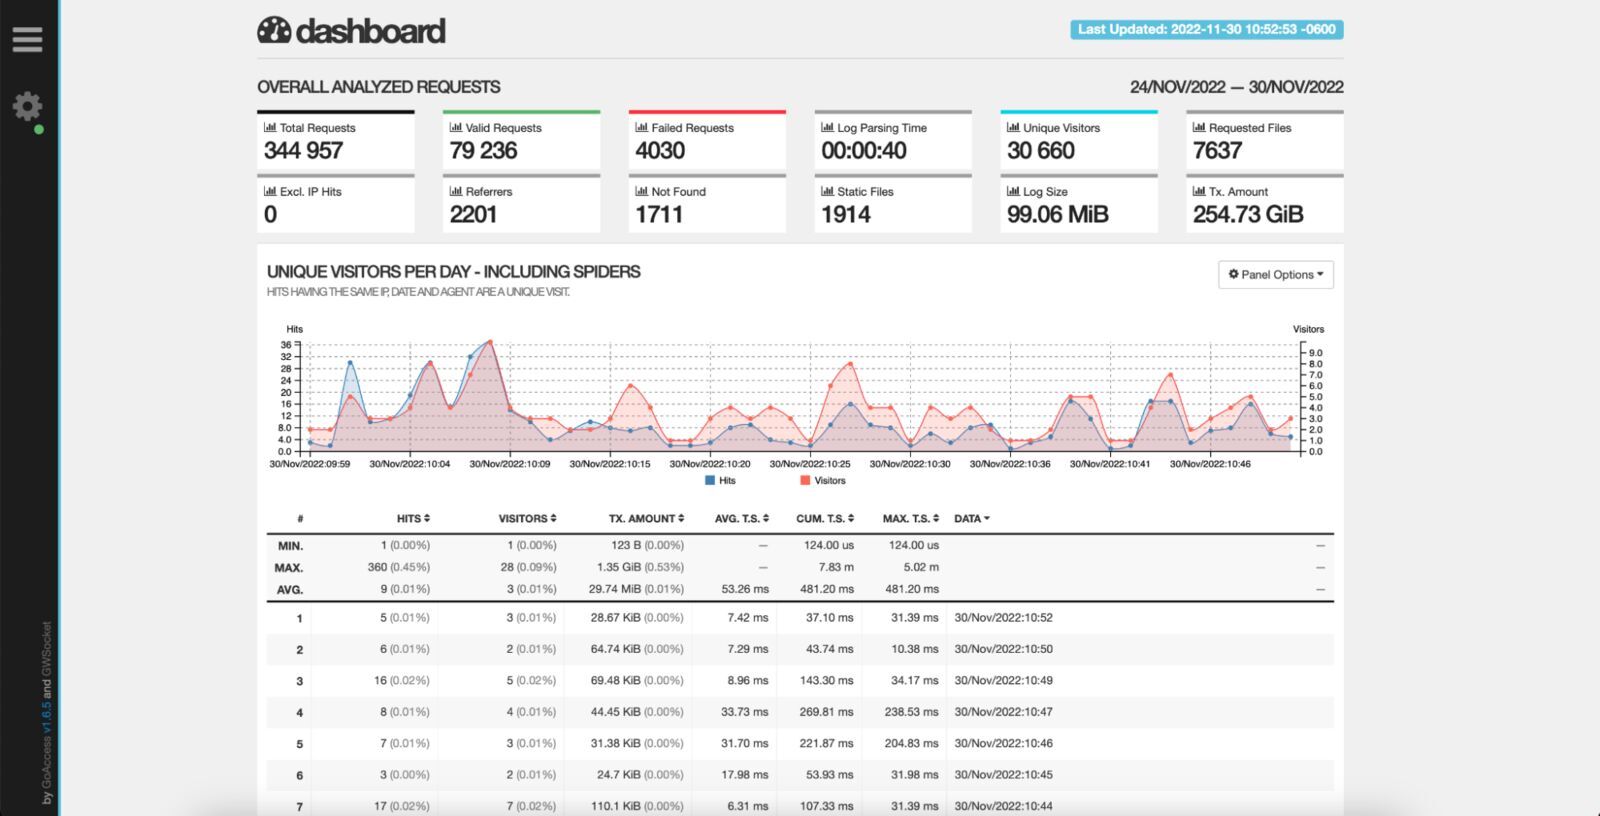
GoAccess is an open-source, real-time web log analyzer with support for formats such as Apache, NGINX, or Amazon S3. It was designed and developed as a console application and written in C, which makes it extremely fast. You can visualize data in one of two ways with GoAccess. You either work in the terminal, where you see log data via the command line, or inspect log data via the HTML files GoAccess generates. The files are automatically updated to provide the most important web-based information such as requests, visitors, top URLs, and more.
Features
- Support for most common web formats like Apache, NGINX, CloudFront, or Elastic Load Balancing.
- Real-time visualization and data processing.
- Incremental log processing.
- Per virtual host metrics visualization.
- Visitor-based metrics include the number of hits, bandwidth, and slowest running queries.
Pros
- Easy to use and fast to set up.
- Ability to parse the various logs without any additional configuration, such as Apache or NGINX.
- Beautiful terminal dashboard for those that prefer terminal rather than rich web visualizations, with the latter available as well.
- Support for incremental log processing with the on-disk database.
Cons
- If you want to visualize the logs of all your web instances simultaneously, you need to centralize them manually in a single shared place.
Pricing
GoAccess is open-source and can be used without any licensing costs.
5. Dynatrace
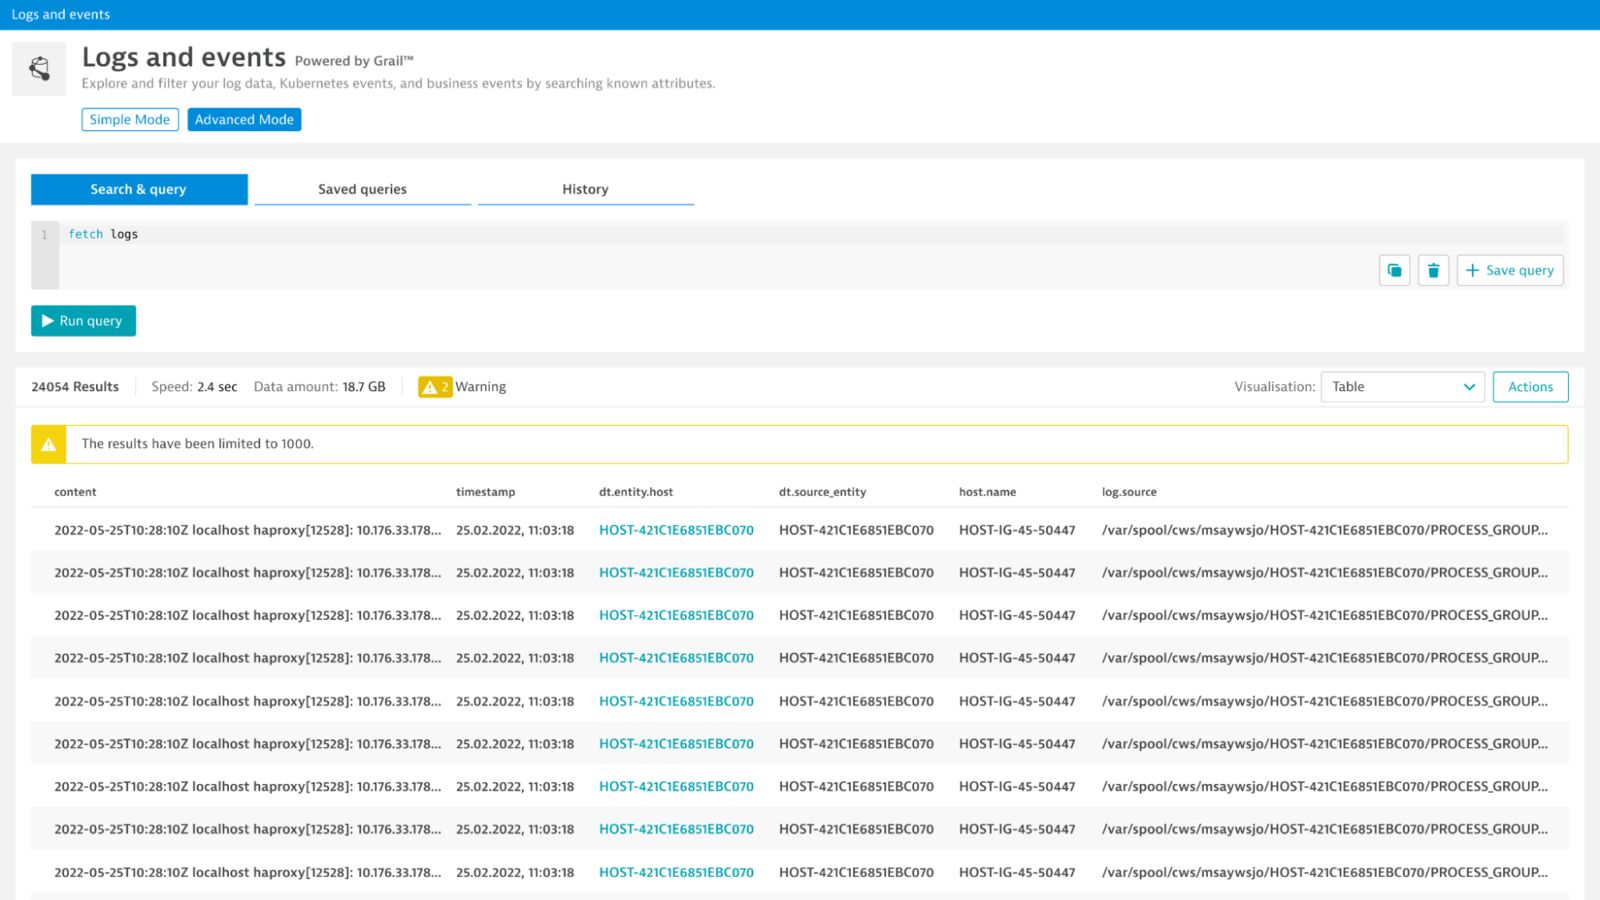
Dynatrace is an observability and security platform offering advanced log analytics capabilities, along with its core APM and infrastructure monitoring features. It focuses on efficient log ingestion, processing, and analysis. With Dynatrace, you can collect logs from various sources, process and enrich them, and then correlate the log events with application and infrastructure metrics. This process offers valuable context for troubleshooting and optimization making the root cause analysis fast and efficient.
Features
- Automatic log ingestion from a wide variety of sources.
- Real-time log search, filtering, and analysis enable you to get to the important events faster.
- Customizable log parsing rules and data enrichment.
- Alerting and event correlation based on log events notify you when things go wrong.
Pros
- AI-driven analytics for faster root cause detection leads to a reduction in downtime.
- Context-rich log analytics with the possibility of correlating the data with application and infrastructure metrics.
- Support for distributed and cloud-based environments.
- Easy integration with Dynatrace’s APM and infrastructure monitoring modules.
Cons
- Limited customization options compared to open-source alternatives.
- The steeper learning curve for advanced configurations spanning across various environments and functionalities.
- Complicated pricing model.
Pricing
You can start with Dynatrace using a free trial version. The client version starts at $25 per month and provides 100K annual DDUs or Davis Data Units. These can then be spent on various solutions. For example, the DDU for classic log monitoring for JSON formatted logs is the number of JSON log records multiplied by 0.0005. So if you send 10 JSON records in a request the cost will equal 0.005 DDU.
Read our article on Dynatrace alternatives to see how it compares to other competitors. Plus, you can check out our Sematext vs Dynatrace dedicated comparison to see how the two stack up.
6. Splunk
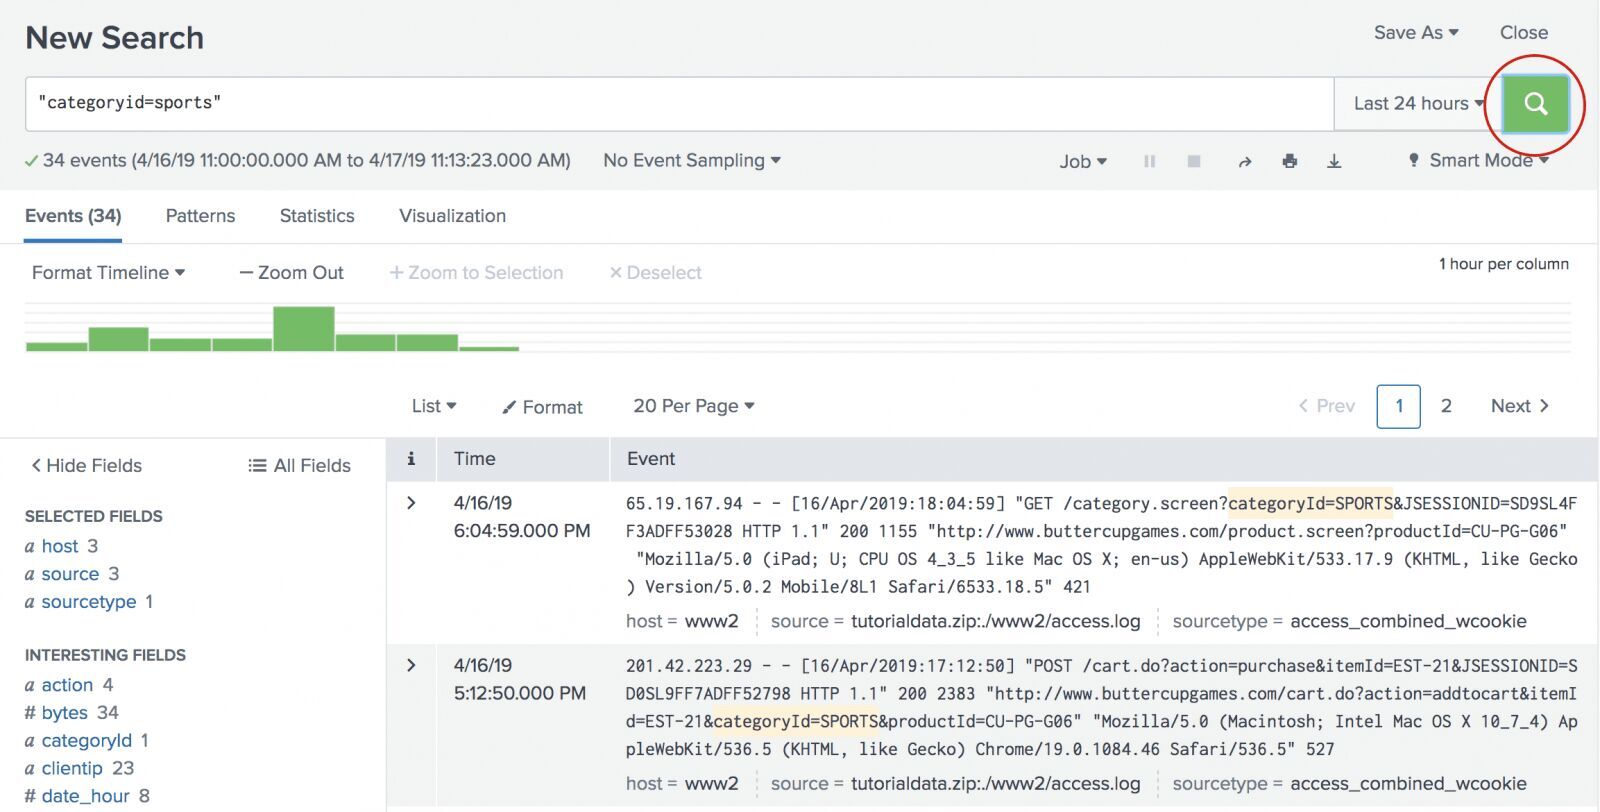
Splunk is a powerful, enterprise-grade log monitoring and analysis platform. One of the first commercially available log management solutions, Splunk gained a lot of traction and popularity, especially thanks to its many integrations and powerful analytics. It offers a flexible data processing pipeline, allowing users to extract and enrich log data, and intuitive query language enabling complex searches and correlations to identify patterns and anomalies.
Splunk comes with a wide variety of features, including data visualization for the metrics derived from your application and infrastructure logs, real-time search, KPI tracking, reporting, and monitoring. All the features make it a good log monitoring tool, at least when it comes to performance observability.
Features
- Robust security features and role-based access control.
- Wide range of supported log formats and data sources.
- Alerting with event correlation for proactive monitoring allows you to be informed when necessary
- A powerful query language for advanced log analysis.
Pros
- Mature, feature-rich, and widely adopted, making it a good solution for gaining observability into your applications and infrastructure logs.
- Rich visualizations allow you to graph whatever you want from your logs.
- Custom dashboarding and reports support creating the visualizations that you commonly need.
- Real-time alerting helps you stay updated with the important events in your Apache log.
Cons
- The steeper learning curve when it comes to advanced features such as its processing language.
- A powerful, yet pricey log monitoring tool.
Pricing
Splunk pricing starts with a free plan allowing up to 500MB of data per day. Paid plans are available upon request.
7. Datadog
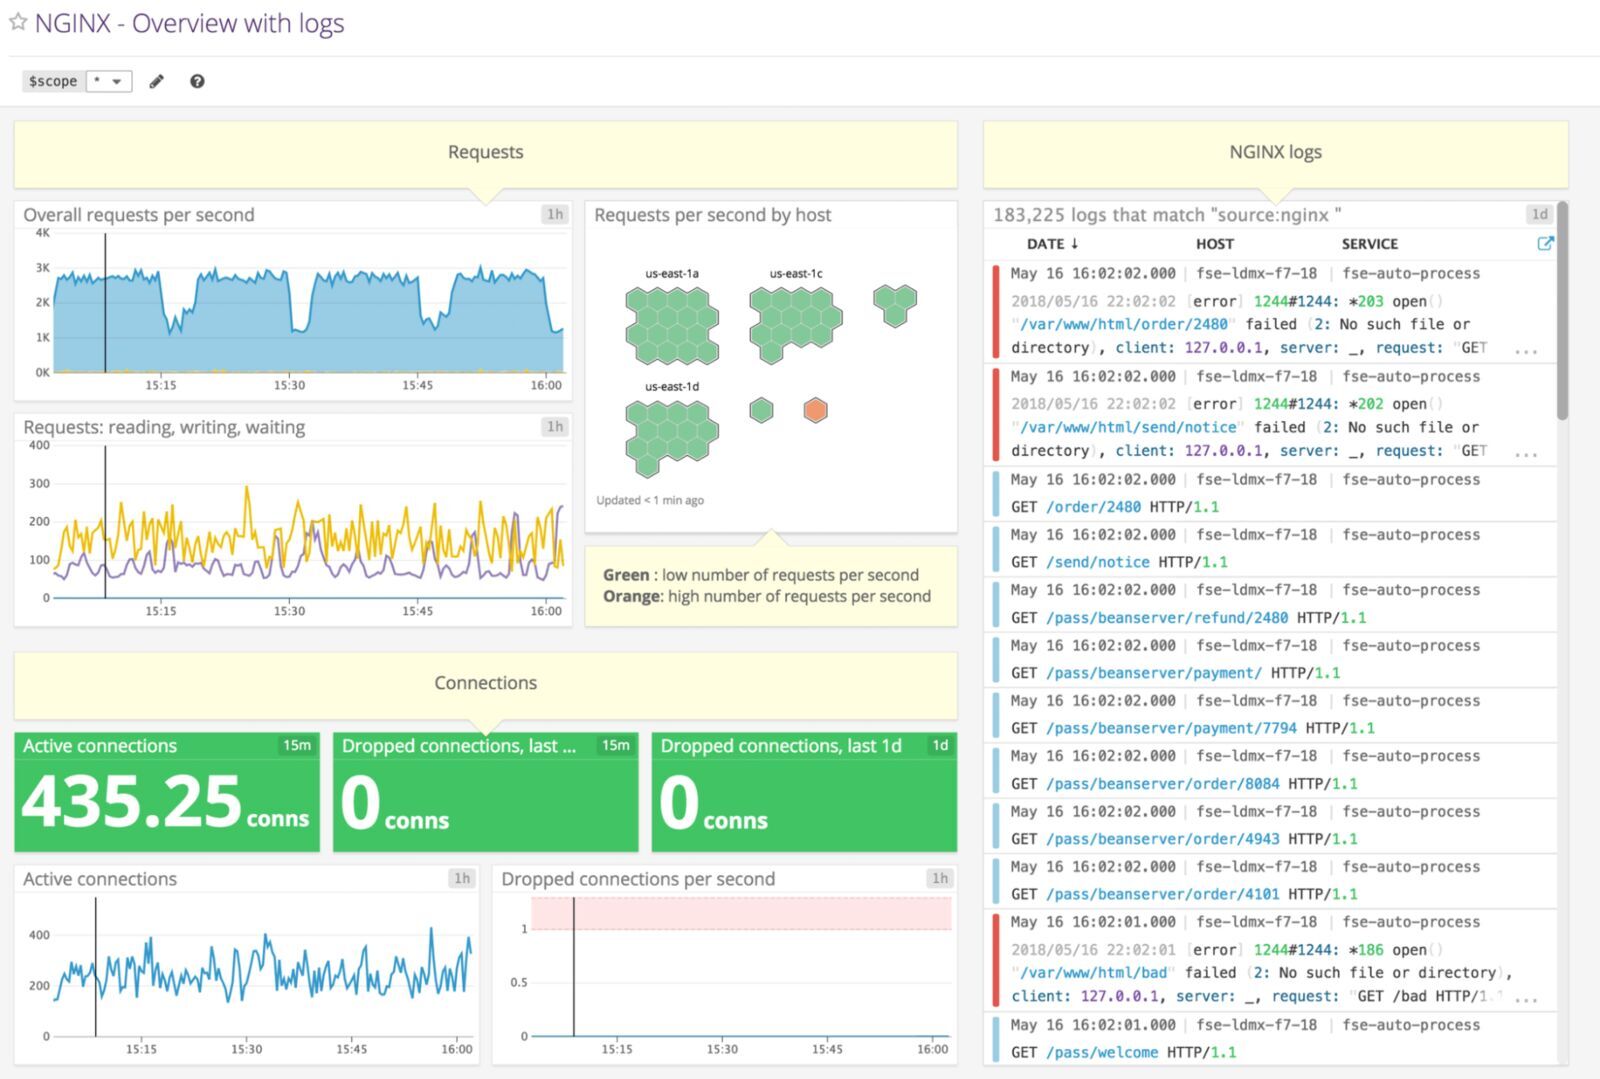
Datadog is a cloud-based, unified observability solution providing log monitoring capabilities as one of its key features. The tool accepts logs from various sources, processes, and enriches them, allowing for real-time insights into the infrastructure and application performance. It provides out-of-the-box support for more than 170 technologies that you can easily integrate, ship logs from, and extract the metrics for dynamic alerting. You can also prioritize the high-value logs to get a cost-effective and scalable approach to centralized log management.
Features
- Integration with more than 170 technologies out of the box.
- Customizable dashboards and rich visualizations.
- Advanced alerting and event correlation to alter you only when needed.
- On-data ingestion processing allows you to ship virtually any format of log events and parse them on the Datadog side.
Pros
- Possibility to generate metrics out of your logs allowing for rich dashboarding and alerting.
- TCP/SSL support with SOC 2 compliance for the highest security when it comes to logs.
- Support for various runtime environments including cloud, container, and serverless environments.
- Active community and extensive documentation.
Cons
- Only self-hosted data archiving in the Ingest plan.
- Unlimited user accounts are available only in the more expensive plan.
- Less focus is put on log monitoring compared to dedicated log monitoring solutions.
Pricing
Datadog offers two options for its log monitoring and analysis tool. The Ingest plan pricing starts at $0.10 per ingested or scanned GB of uncompressed data a month with the process, live tail, and archive available. The second option is Retain or Rehydrate, an on-demand billing plan that’s priced at $2.25 per million log events per month and includes 15 days of logs retention based on tags or facets, log patterns and analytics, as well as log rehydration for auditing and historical analysis.
Before making a choice, you should know what the alternatives to Datadog are, and how it compares to Sematext in our Sematext vs Datadog analysis.
8. SolarWinds Papertrail
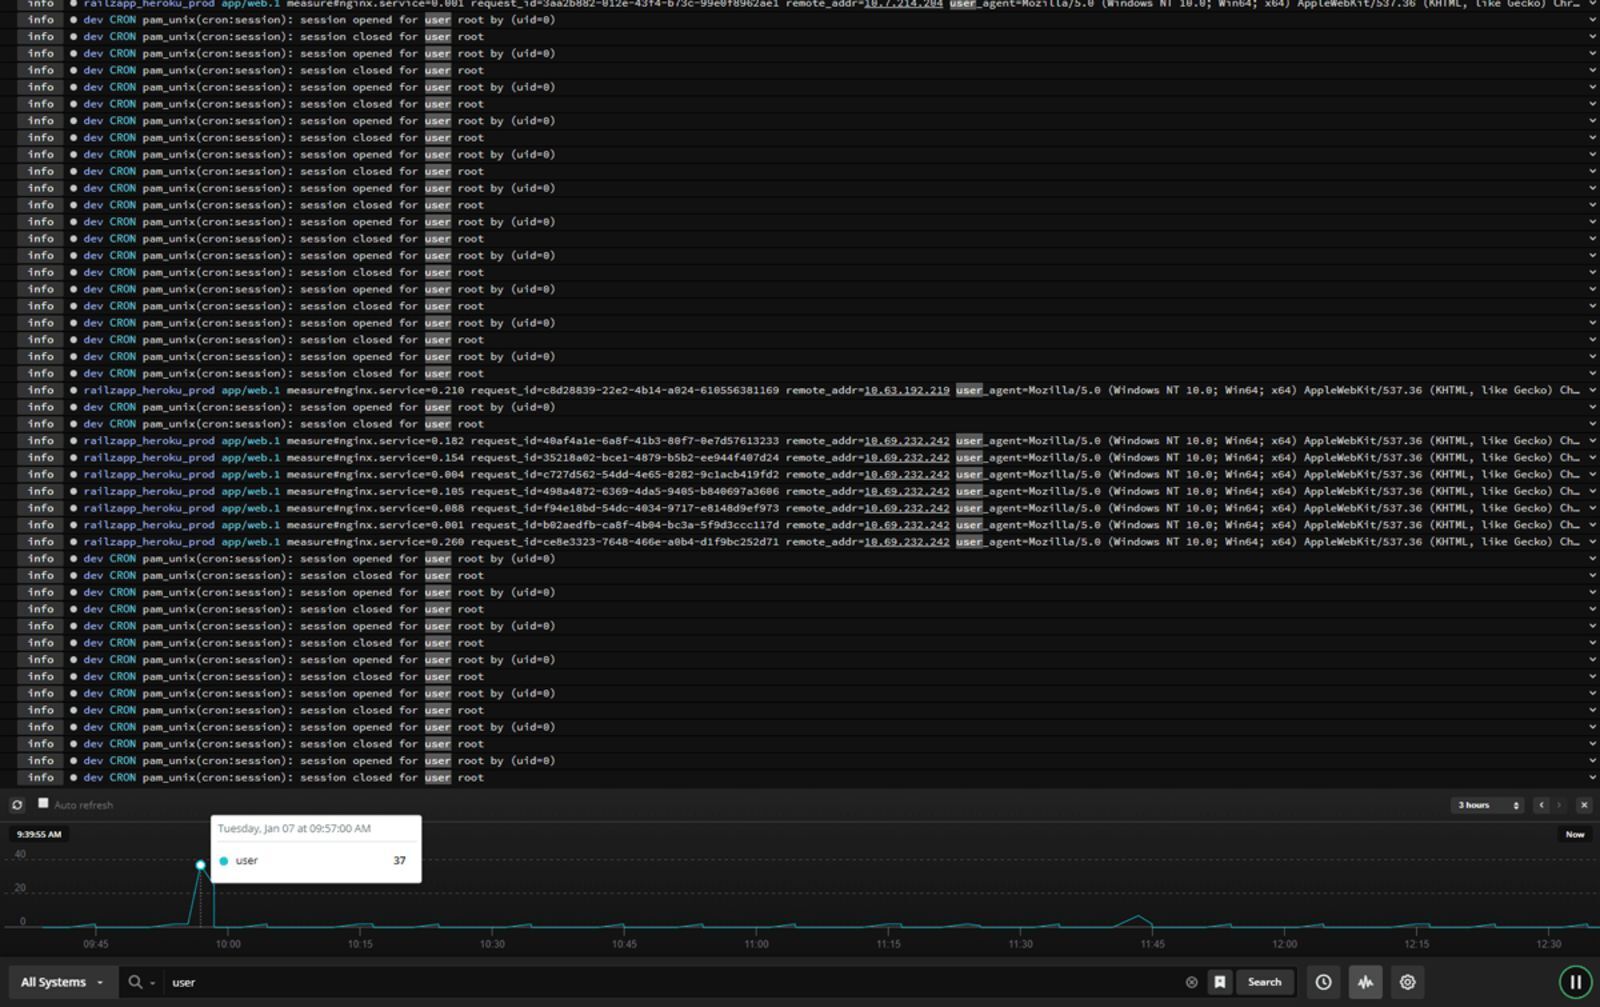
SolarWinds Papertrail is a cloud-hosted log aggregation and monitoring tool that by default mimics the console-like experience when dealing with logs. It allows you to search and analyze any type of log file, text log file, or data coming via the Syslog protocol. The platform’s live tail search helps detect issues faster and trace back the chain of events to enable real-time root cause analysis. It also offers powerful search capabilities, enabling users to quickly pinpoint relevant log events and troubleshoot issues. Additionally, Papertrail allows for integrations with popular third-party services for streamlined incident management.
Features
- Ability to browse logs via web browser, command line, or API.
- Log-based alerting.
- Traffic spike friendly, thanks to its monthly data ingestion calculation.
Pros
- Easy to set up and use.
- An interface that makes it easy to use by hardcode console users.
- Built-in archiving of the data makes it easy to work with large volumes.
- Flexible alerting options with numerous destination options including email and webhooks.
Cons
- No rich visualization support.
- Limited customization options.
- Higher volume plans quickly become expensive compared to other services.
Pricing
SolarWinds’ pricing starts at $0 for 2 days’ worth of searchable data and 7 days of an archive with 50MB/month of data, with 16GB free as a first-month bonus. The paid plans start at $7 for 1GB/month of data, with the data being searchable for 1 week and archived for a year. The most expensive non-custom plan you can find is $230 for 25GB/month of data available for two weeks for searching and one year of archiving.
9. Logz.io
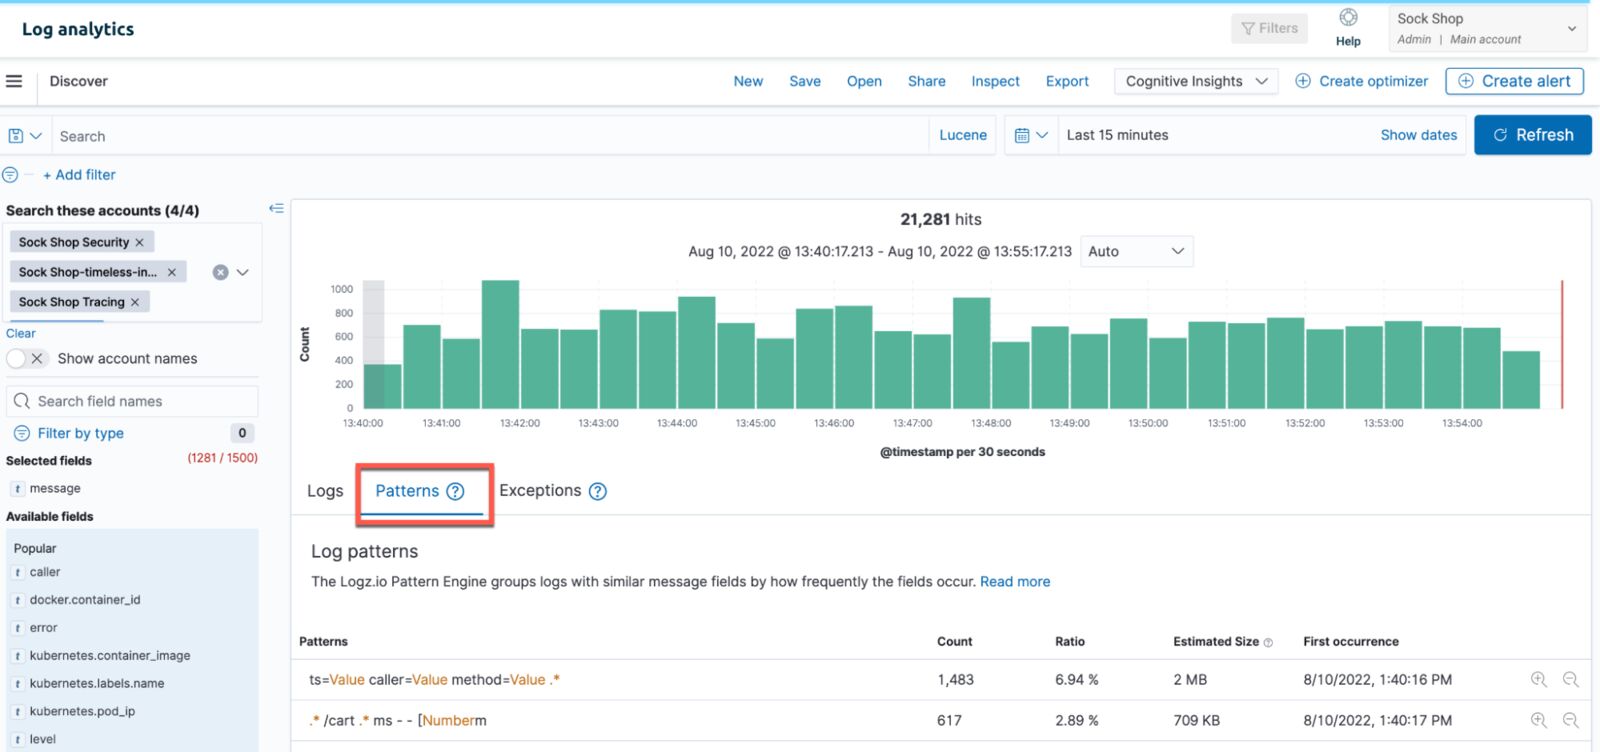
Logz.io is a cloud-based log monitoring and analysis platform. It is built on top of OpenSearch and the toolset around it and extends its functionalities. It offers rich visualizations based on Kibana, so if you ever used the ELK stack you will feel at home. The platform offers alerting based on multiple conditions for effective alerting and reduction of alert fatigue. Logz.io can help you slice and dice your logs via machine learning-based filtering of the most commonly used fields.
Features
- Self-service log parser can help you parse the log format that you use.
- ML-based recommended filters allow for quick and efficient filtering.
- Flexible storage options allow for cost reduction.
- Easily surface exceptions and errors in your logs via the dedicated tab.
- ML-based error detection.
- Alerting based on multiple conditions and queries.
Pros
- Correlation between errors and deployments.
- Customizable dashboards and visualizations based on Kibana.
- Connect logs, metrics, and traces for efficient root cause analysis.
- Alert notification with email and ChatOps tools integration.
Cons
- May be challenging for new users that are not familiar with the ELK Stack.
Pricing
The pricing is built around data ingestion and starts at $0.84 per GB of ingested data a day with 3 days of data retention and goes up to $1.82 per ingested GB per day.
10. Sumo Logic
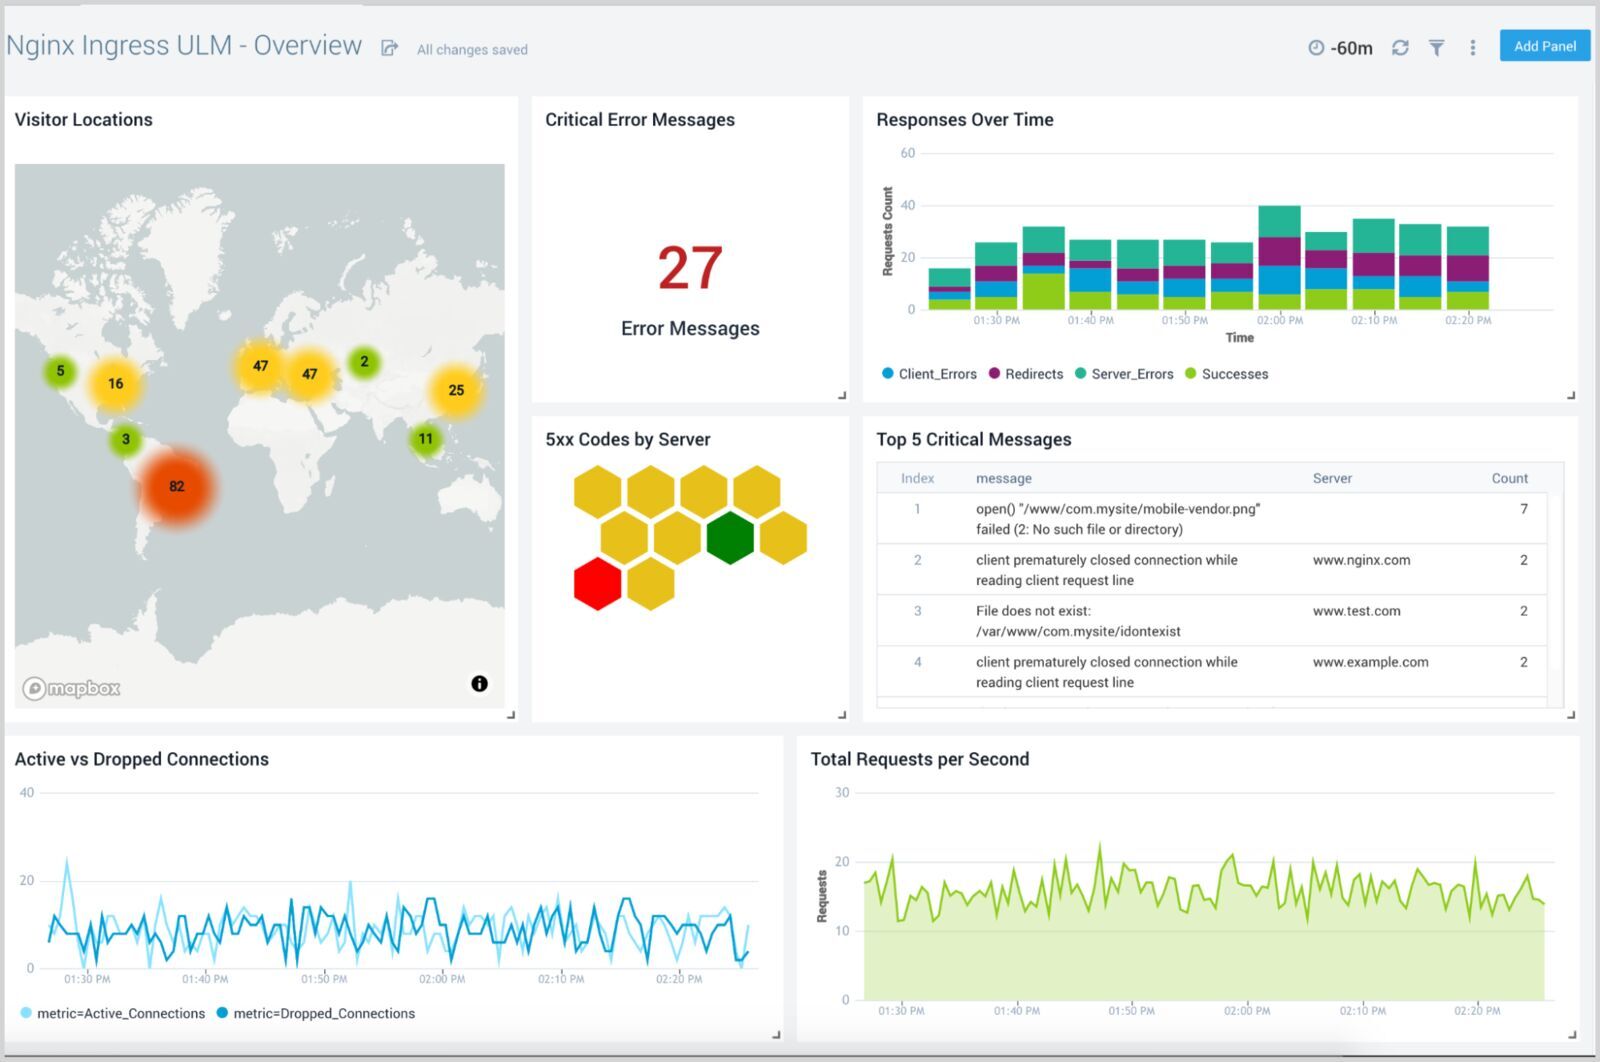
Sumo Logic is a unified logs monitoring system with out-of-the-box support for numerous applications and infrastructure elements providing real-time insights into your logs. Using Sumo Logic, you can create customizable dashboards and visualizations for presenting your log data and identifying patterns. Its advanced alerting helps users proactively detect and resolve issues while avoiding alert fatigue. The platform features machine learning and predictive algorithms that enable you to process large amounts of data daily.
Features
- Historical and live streaming dashboards for your logs.
- Alerts on live log data.
- Log Reduce functionality for immediate key insight analytics.
- Easy integration with major Cloud providers such as AWS, Azure, and GCP.
Pros
- Powerful query language.
- Centralized agents with easy setup supporting autoscaled environments.
- Automatic log pattern detection for easy integration with various applications and infrastructure elements.
- Rich visualizations.
Cons
- Not available on-premises disqualifies the solution for some companies.
- No overage support.
Pricing
The pricing for Sumo Logic is based on features and data ingestion. You can start with a free plan with limited features and up to 500MB daily data ingestion. The paid plans start with the Essential, which has log analytics, real-time alerting, and live and historical data dashboarding, and costs around $3/GB (an estimated cost based on annual commitment and 1GB of log ingest per day).
11. SolarWinds Loggly
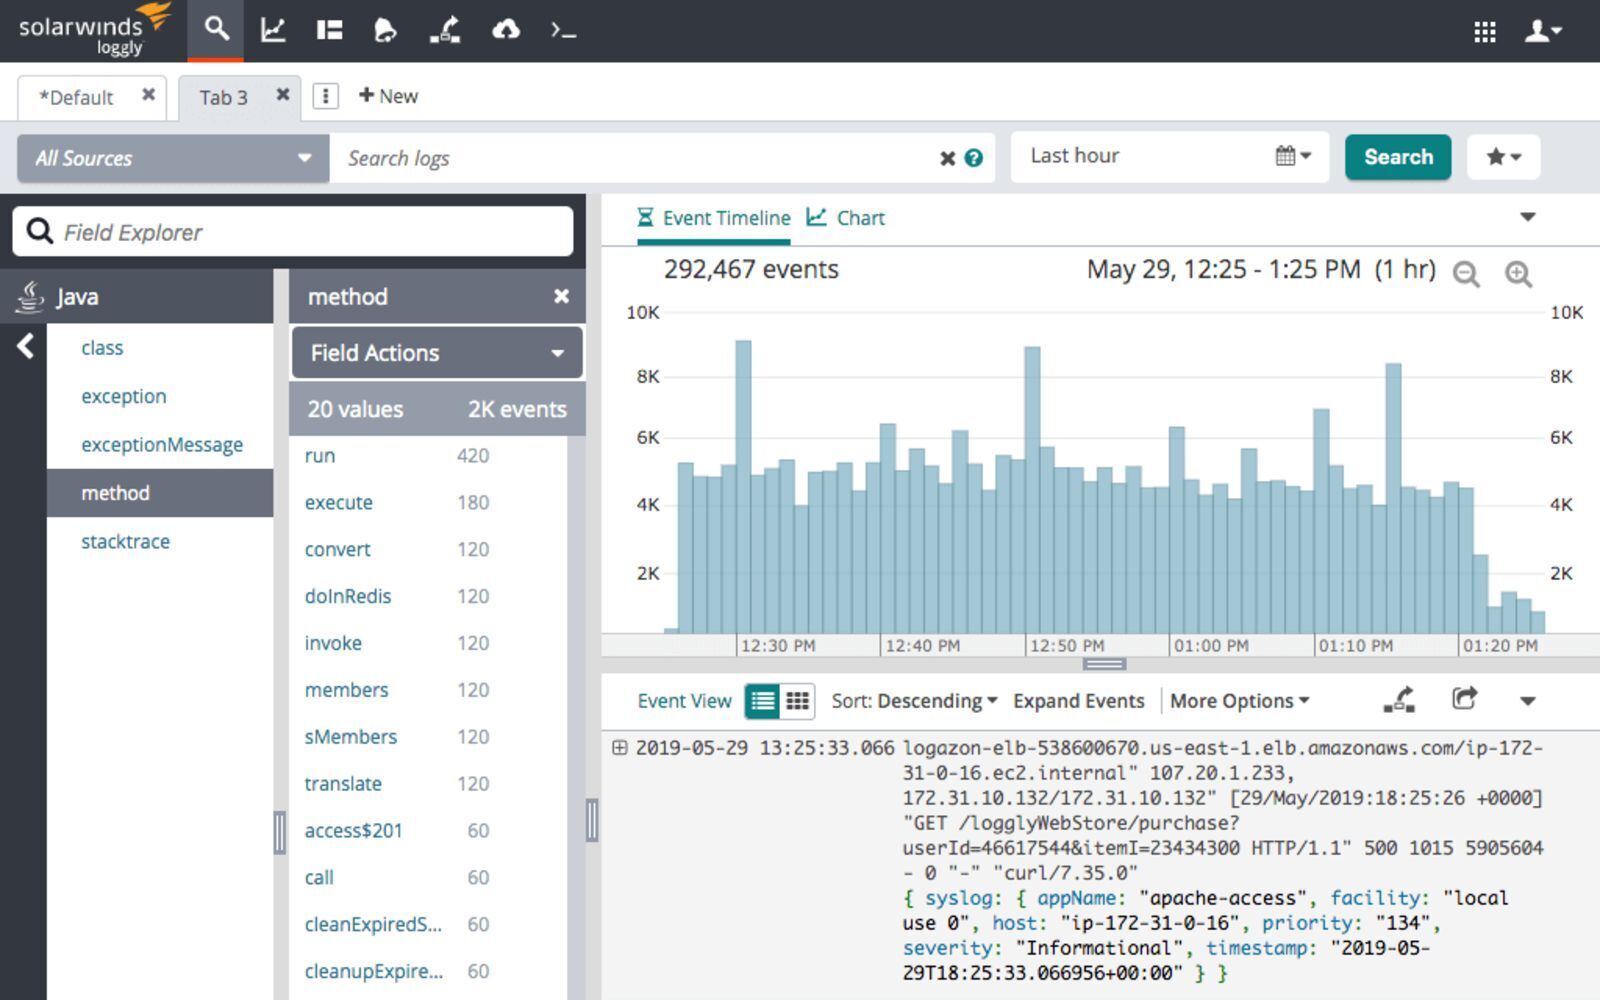
Loggly is a cloud-based log monitoring, aggregation, and management service that provides you with a real-time view of the information carried by your log files. It is a simple, yet powerful solution with support for common log shippers enabling you to quickly adapt the existing pipeline or set up a new one and start monitoring log data right away. The dynamic field explorer gives a real-time overview of your logs categorized by structure or customized view. The full-text search capabilities allow you to search according to individual fields and find the log events you are interested in. This shortens the critical time required for the root cause analysis of issues.
Features
- Server-side logs parsing for ease of integration and log shipping resource minimization.
- Parsing support for common log formats, including Apache, NGINX, and many others.
- Query time field extraction allowing on the fly data extraction.
- Customizable dashboards and visualizations
- Advanced log-based alerting to inform you only about the necessary elements.
Pros
- Support for popular log shippers make it easy to integrate with your existing pipeline or set up a completely new one.
- Agent-free logs collection for ease of integration shortens setup and configuration time.
- Flexible alerting options, including email, webhooks, and integrations
Cons
- Some features, like API access, are only available when using paid plans, which can limit your log analysis process when using external tools.
- Limited customization options compared to open-source alternatives such as Elastic stack.
- Restrictive overage rules.
Pricing
Loggly’s pricing starts with a free tier, which includes 200MB/day of data ingestion with 7 days retention. While it provides basic functionality, alerting and customized dashboards are missing. The paid plan starts at $79/month, billed annually for 1GB/day of data ingestion and 15 days retention, giving you access to a solution enriched with customized dashboards and email alerting. The Enterprise version starts at $279/month billed annually and includes all the features of the earlier plans, webhooks, custom daily data volume, and 15 to 90 days retention.
12. LogicMonitor
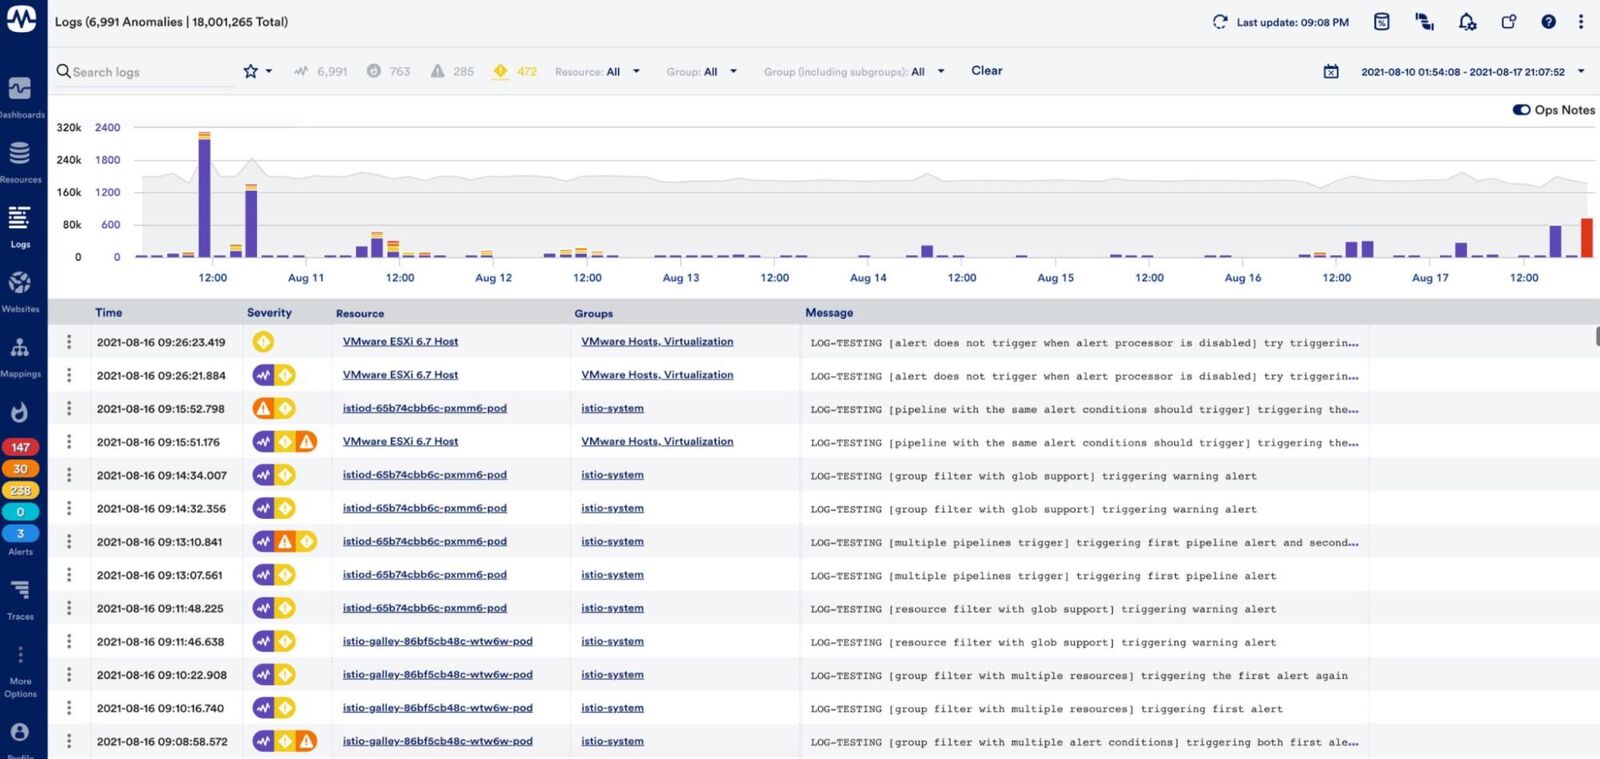
LogicMonitor is a cloud-based log monitoring and analytics platform designed to provide instant access to contextualized and correlated logs, metrics, and log anomalies through a single tool. With rule-based alerting with notifications, the platform enables efficient access to relevant logs data allowing for quick and efficient root cause analysis. You can perform real-time searches, filtering, and correlation of log events to identify patterns, anomalies, and potential issues occuring within the infrastructure and applications.
Features
- Automatic correlation and contextualization of log data.
- More than 2000 pre-build templates and modules for integrations.
- Easy correlation between logs, metrics, and log-based anomalies.
- Rule-based alerting with notifications.
Pros
- Flexible retention options.
- Support for easier root cause analysis by bringing unseen behavior to your attention.
- Access control allows access to the log data only to the teams that needed it.
- Streamlined incident management improving operational efficiency.
Cons
- Pricing available only on request.
Pricing
Currently, details on pricing are only available on request and depend on your infrastructure.
13. Mezmo (former LogDNA)
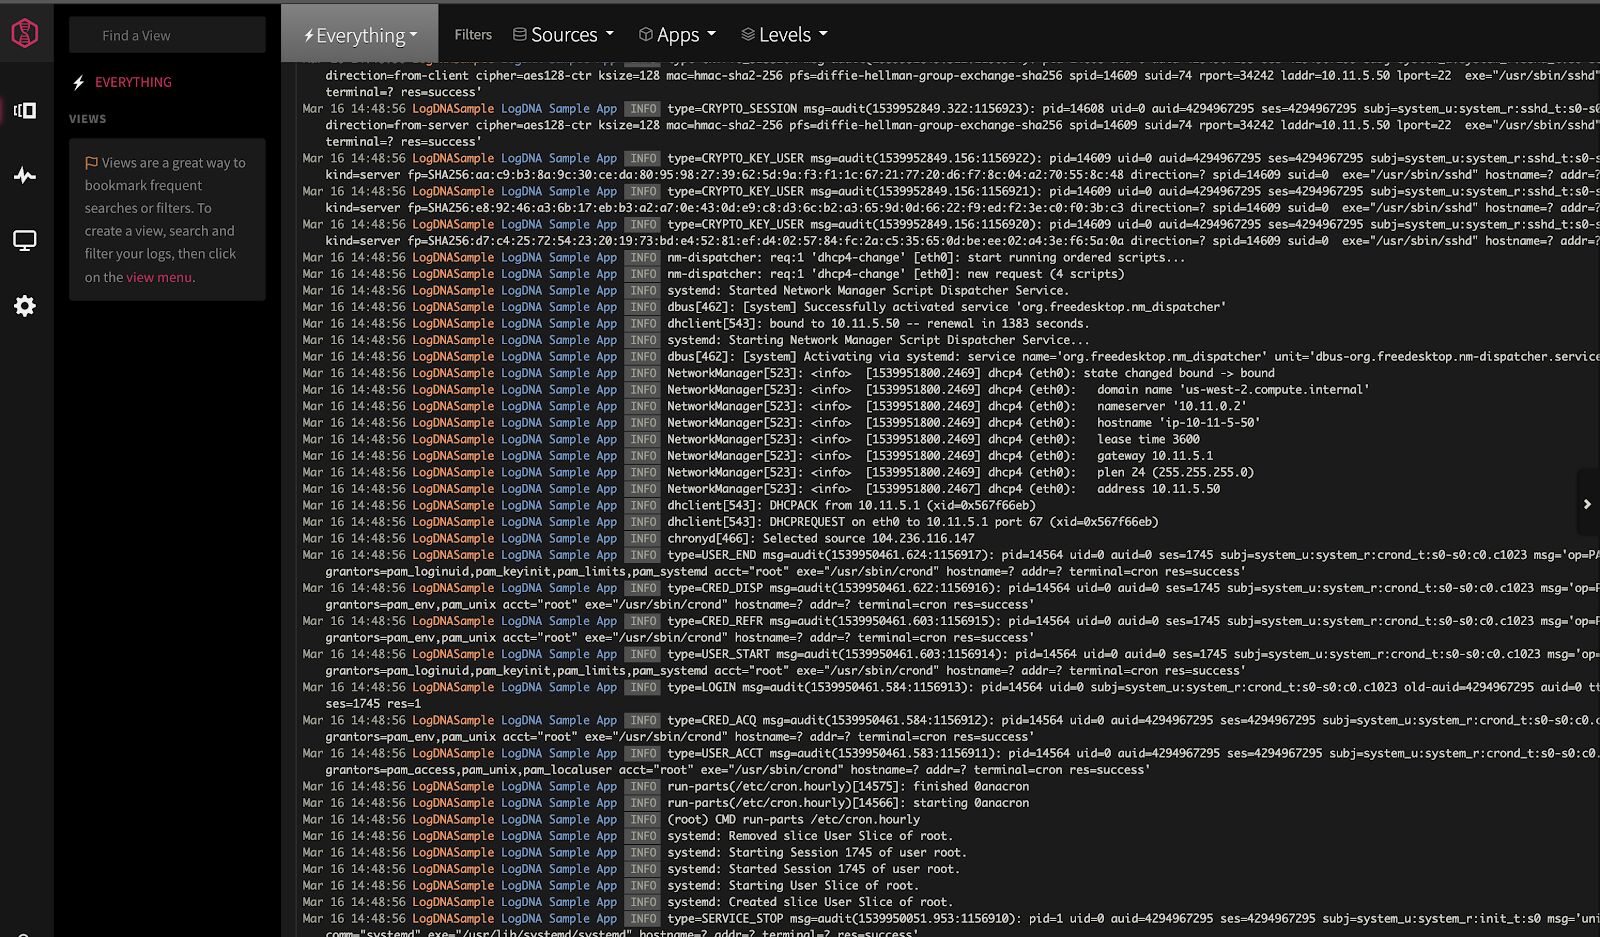
Mezmo, formerly LogDNA, is a cloud-based observability and telemetry data solution that allows you to monitor and analyze log data coming from various sources. It supports automatic and custom log parsing for greater ease of use. Mezmo enhances log data flexibility via custom pipelines that you can use to ship logs to different teams and their members. The alerting engine also helps you stay up to date with important events, by notifying you on your desired platform.
Features
- Automatic and custom log parsing giving you simplicity and ease of configuration of supported log formats.
- Log-based alerting with ChatOps notification support.
- Logs archiving and restoration for long-term log storage for compliance support.
- Kubernetes logs enrichment for easy slicing and dicing of the information coming from your clusters.
- Role-based access to your logs enables access limiting.
Pros
- Automatic and custom logs parsing enabling flexibility.
- Flexible data retention tiers with archiving support.
- Support for SAML, SSO, and HIPAA compliance for the enterprise user.
- Spike protection allows you to set dynamic thresholds and alerts when hitting data volume limits.
- Support for OpenTelemetry allowing shipping enriched logs data and connecting it with telemetry data.
Cons
- No data retention in the free plan.
- Custom logs parsing is available only in the paid plans.
Pricing
Mezmo log monitoring pricing comes in three tiers. The free Community plan allows for a single user, has no data retention, and provides the live tail, views, and automatic parsing. The Professional plan starts at $0.80/GB with 3-day data retention, up to 25 users, alerts with ChatOps, and more. The Enterprise plan supports features such as SAML, SSO, and HIPAA compliance, but the price is not listed publicly.
14. New Relic
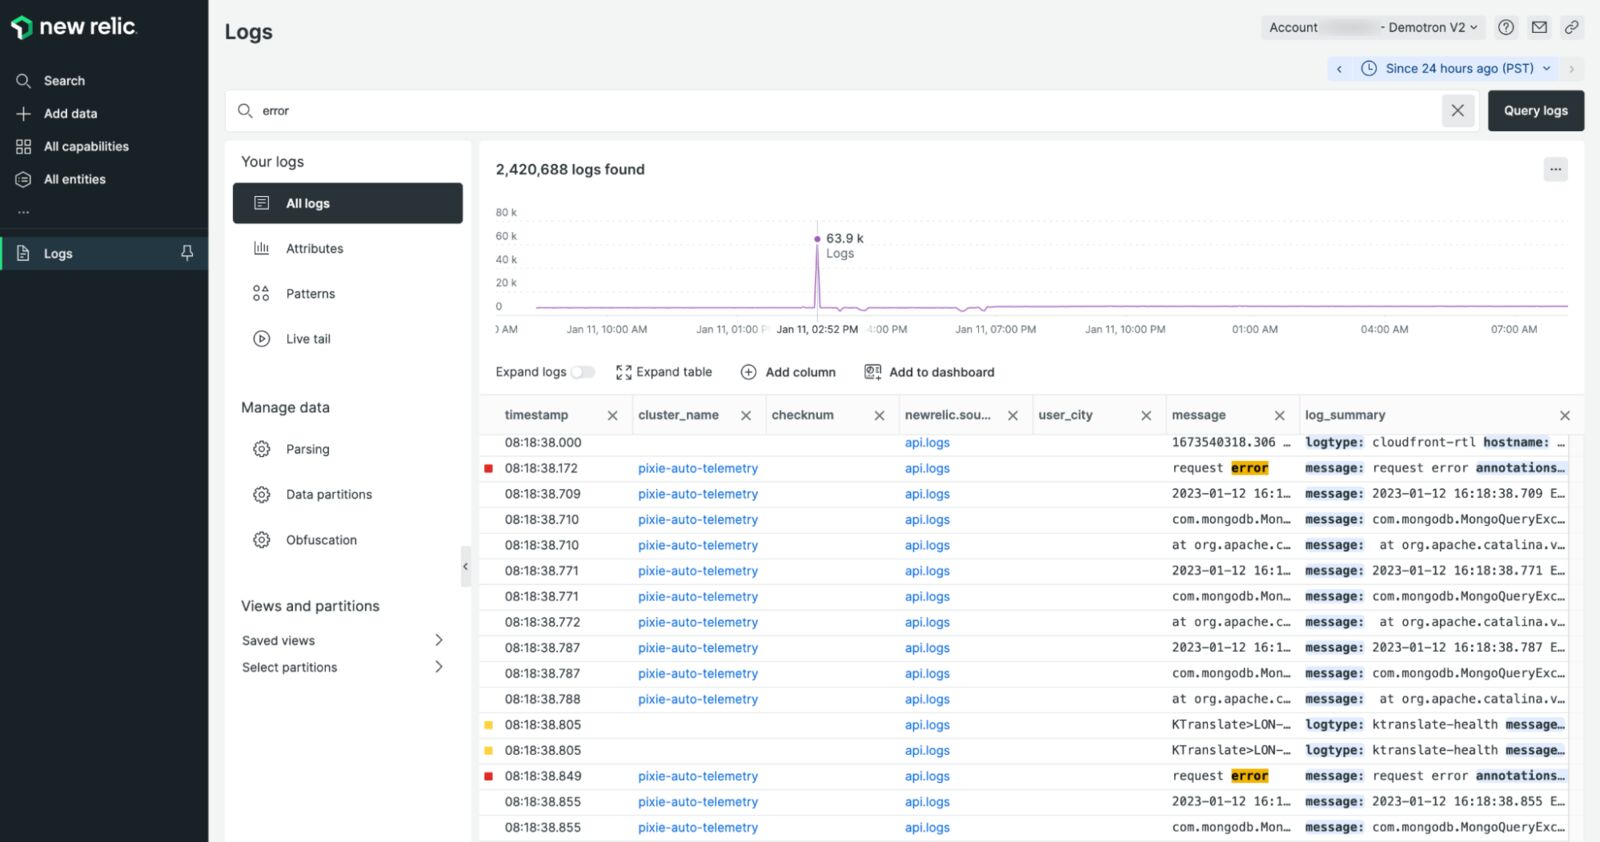
New Relic is an observability platform with first-class log monitoring support. The platform enables you to ship your logs via numerous methods including popular open-source tools, enhancing its usability, regardless of whether you already have an in-house log monitor or not. . The alerting system integrates machine learning features, allowing you to address all issues without being overwhelmed by the amount of information. Visualization and custom dashboards make it easy to see the most important data coming from your logs and correlate it with APM errors, traces, and metrics from your infrastructure.
Features
- Uses the native, powerful New Relic Query Language or well-known Apache Lucene syntax to find data.
- Support for custom dashboards making it easy to visualize your logs data.
- Alerting systems keep you informed about events from your logs delivered to you via services like Slack, and PagerDuty.
- Support for more than just logs: APM errors, distributed tracing, and infrastructure metrics for full visibility are available in a single tool.
Pros
- Support for various log shipping methods, including your own log forwarder or well-known and adapted tools, such as Logstash or Syslog.
- Support for saved searches makes it easy to get back to queries that returned results.
- Programmable interfaces allow you to use tools like Grafana to visualize the data stored in New Relic.
- Reduction of alert fatigue with machine learning-based features.
Cons
- Complicated pricing based on data and user types.
Pricing
NewRelic pricing is based on data and users. For the data you are billed for $0.30/GB above 100GB for basic features and $0.50/GB if you want to go for 90 days of data retention and configurable logs obfuscation. In addition, you pay for the features that are available for certain user types. For example, for logs, you may want to go for the Core user, which is $49/month per user.
Get Started with Log Monitoring
Selecting the right log monitoring tool can be an overwhelming task due to the wide range of available options, each with its own unique set of features and capabilities. Still, gathering log data is crucial, regardless if you manage a small business with limited infrastructure and few applications or a large-scale enterprise with worldwide locations.
You may either for the managed enterprise solution providing all required functionalities in one panel or opt for an open source log file monitoring tool that will need your maintenance. Whatever your decision you will require a centralized space to visualize your logs. Only that will enable fast and efficient troubleshooting across your entire infrastructure and all your applications.
A log file monitoring tool like Sematext Logs is one that combines ease of use and flexibility, aiming to conserve the best of both options, at reasonable pricing.