To keep your users happy – and business going – your Java app needs to be up and running smoothly at all times. It’s not enough to just have it installed. You must look beyond the code and into the workings of the Java Virtual Machine (JVM) on an ongoing basis. By monitoring the JVM with the help of powerful Java monitoring tools, you can measure performance and detect issues that might affect your users’ experiences.
There are different tools that you can use to monitor your Java application. Some of them provide similar functionalities, while others give a completely different set of options to ensure visibility. You can choose from various options like profilers, application performance monitoring, tracing, and more. Each group of tools will give you a different angle and different set of possibilities for looking at the problem.
Without further ado, here are the types of Java monitoring tools you could use to ensure peak JVM performance.
Standard Java Profilers
Standard Java Profilers give you visibility into all the JVM metrics (memory, CPU, threads, garbage collection) and browse heap dumps for fine-grained memory analysis. They track all method calls and memory usage allowing developers to dive into the call structure to quickly point down the areas that require the most CPU and memory space.
With standard Java profilers, you can track down memory leaks as they allow you to run GC manually. You can then analyze memory usage and easily detect the objects that caused the memory failure. On the other hand, for this high level of detail, profilers use significant resources, which leads to application slowdown. Not to mention, they need to be connected with the monitored JVM, which can tamper usage to development environments.
Among the most popular tools, we could name Java VisualVM, Oracle Java Mission Control, and NetBeans Profiler.
1. Java VisualVM
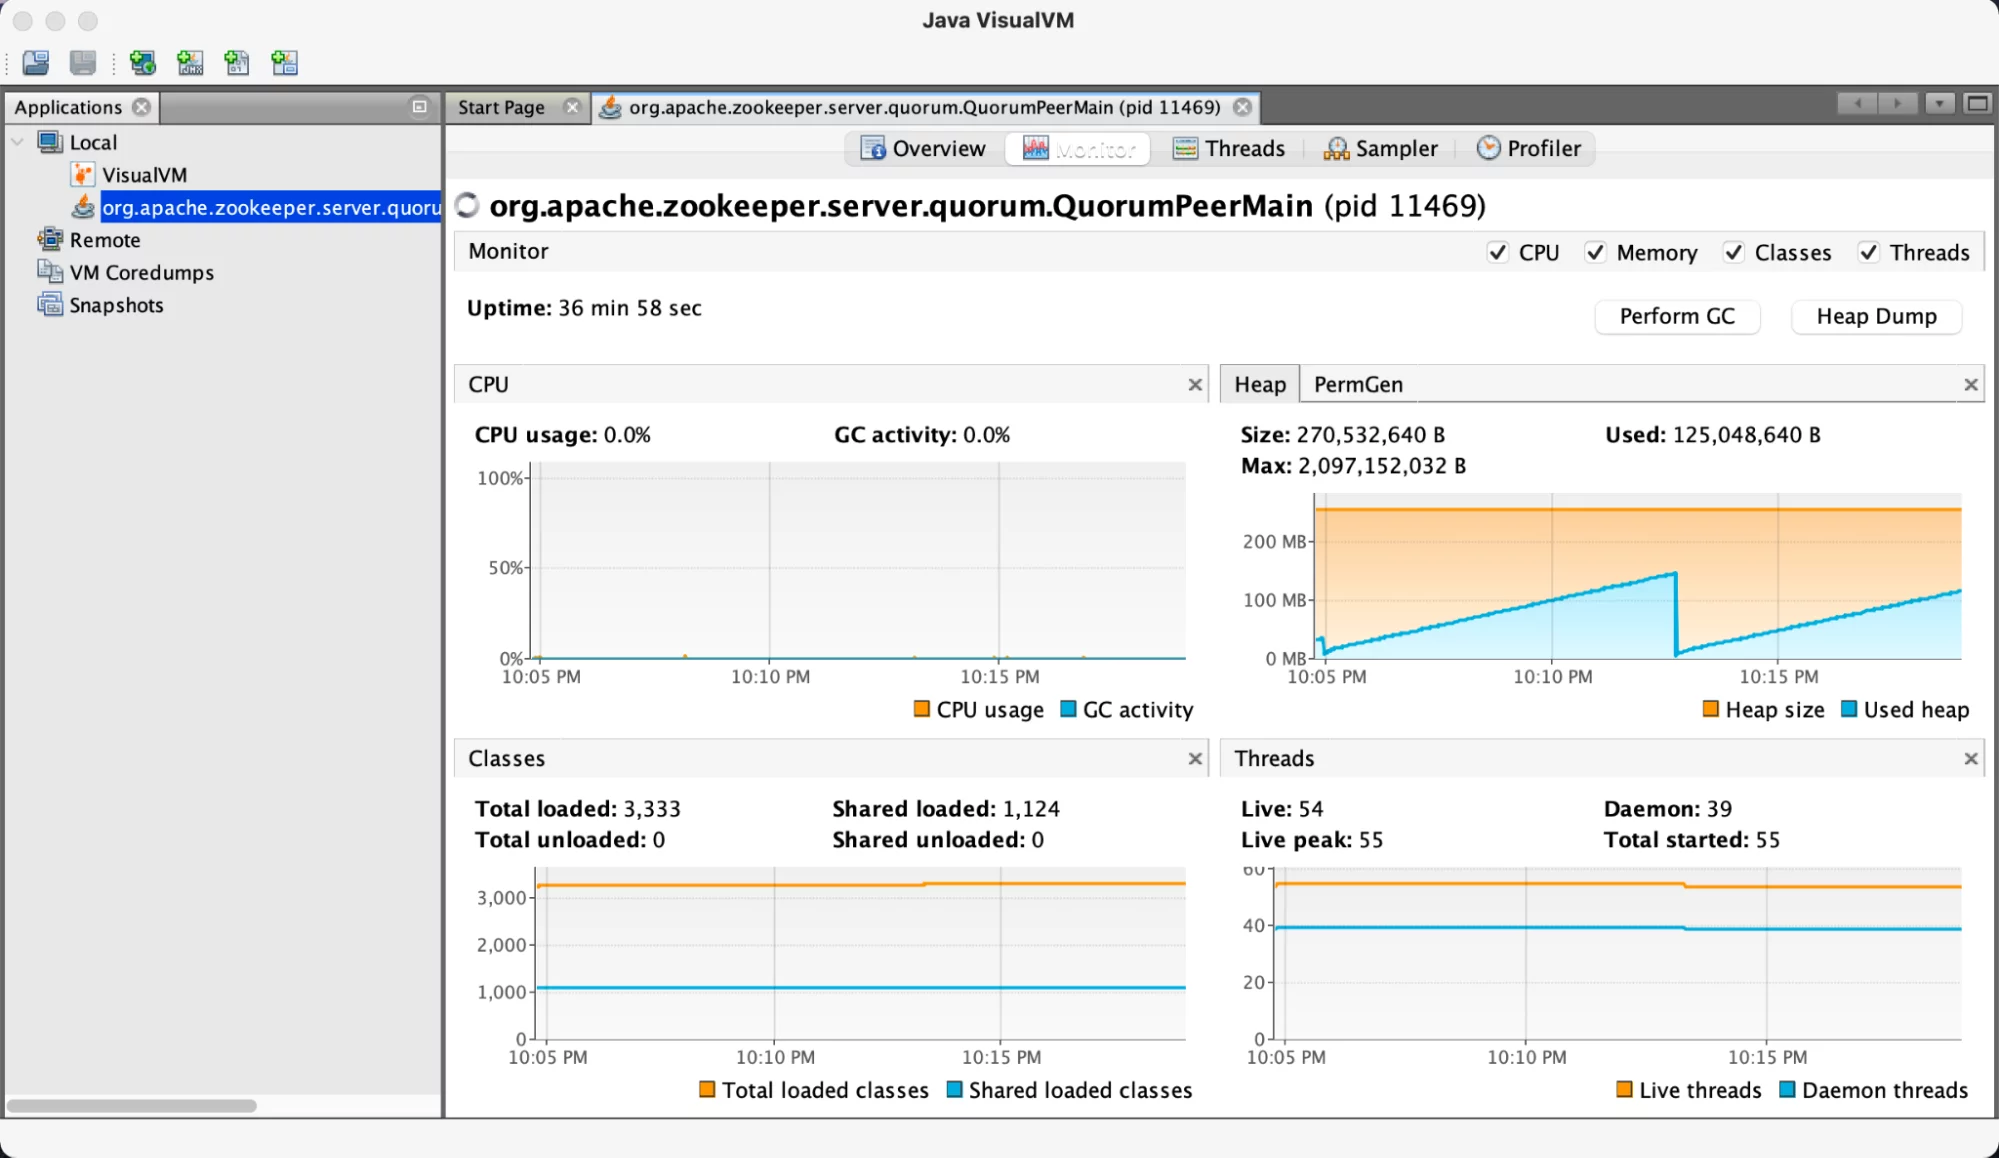
Java VisualVM is a visual tool that combines command-line Java Development Kit features with lightweight profiling capabilities for both development, test, and production use cases. Available for Java 1.4 and newer, it allows you to connect to local and remote Java processes.
Java VisualVM provides a Java process configuration overview, and basic JVM metrics such as CPU, GC activity, heap, space metrics, number of running threads, and classes. It can take and display thread dumps, take heap dumps, and load them for offline analysis – all of that available out-of-the-box with the latest JVM versions.
2. Oracle Java Mission Control
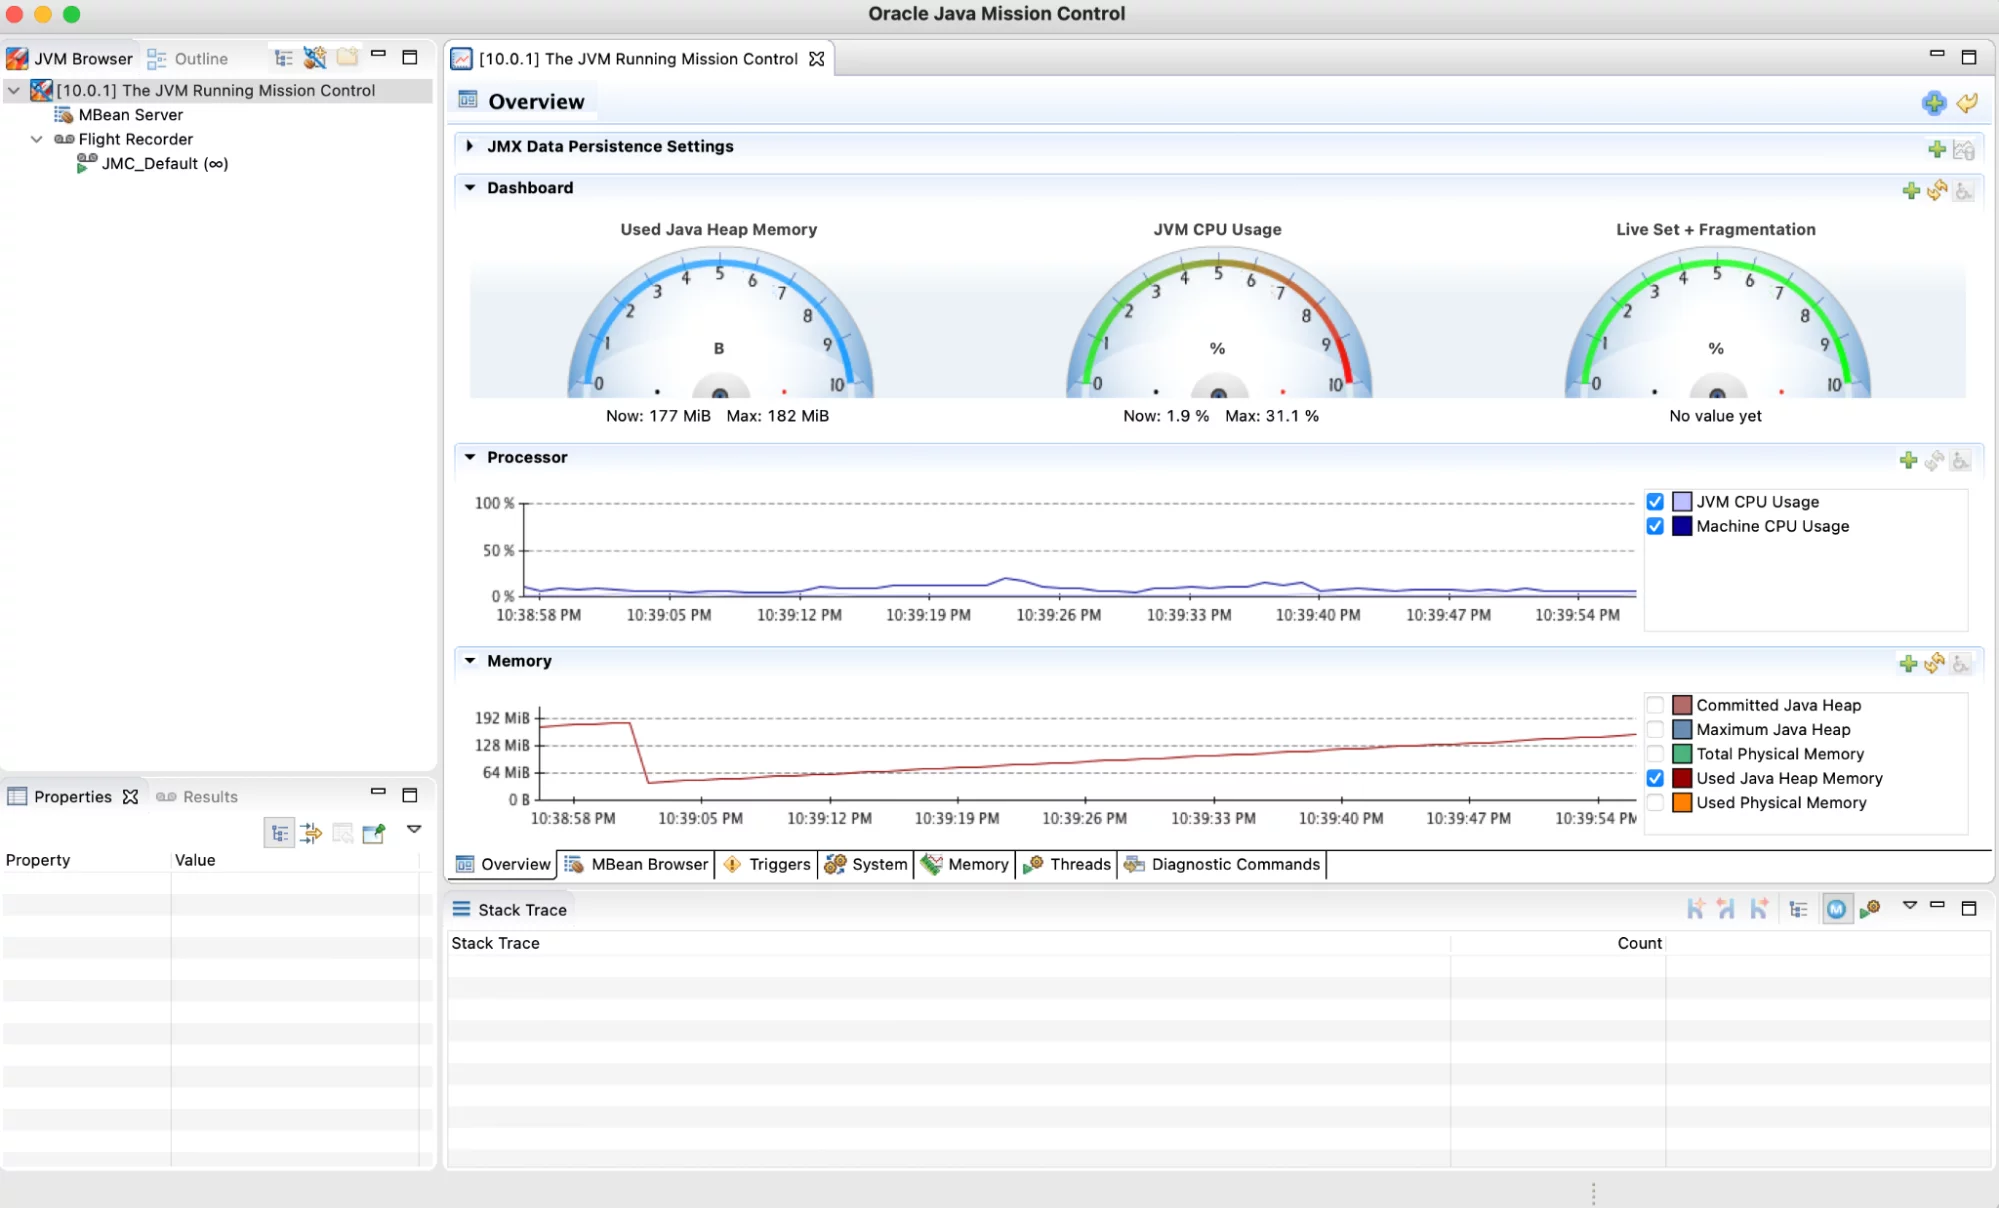
Oracle Java Development Kit Mission Control, together with Java Flight Recorder, creates a complete monitoring toolchain for collecting detailed runtime information allowing post-mortem incident analysis.
Java Flight Recorder is the framework built into the Oracle JDK, enabling profiling and event capturing. It allows you to gather low-level information about the JVM and the Java application running on top of it.
The JDK Mission Control is the second part of the toolchain that allows analysis of the data collected by the Java Flight Recorder. You can use the tools for testing, development, and production environments.
3. NetBeans Profiler
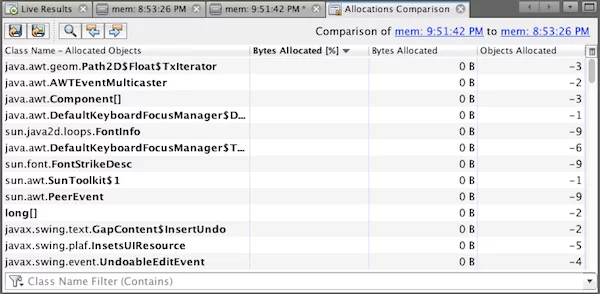
The NetBeans Profiler is part of the Apache NetBeans Integrated Development Environment. It is integrated into the IDE for ease of use and enables profiling CPU performance, memory usage, and threads with a relatively low overhead for the application.
Depending on your needs you may choose to monitor your Java application to obtain higher-level information about memory, thread activity, and memory allocations. You can analyze CPU performance for detailed application performance metrics, including methods execution timings.
NetBeans Profiler also allows you to analyze the memory usage for object allocation and garbage collection telemetry.
4. JProfiler
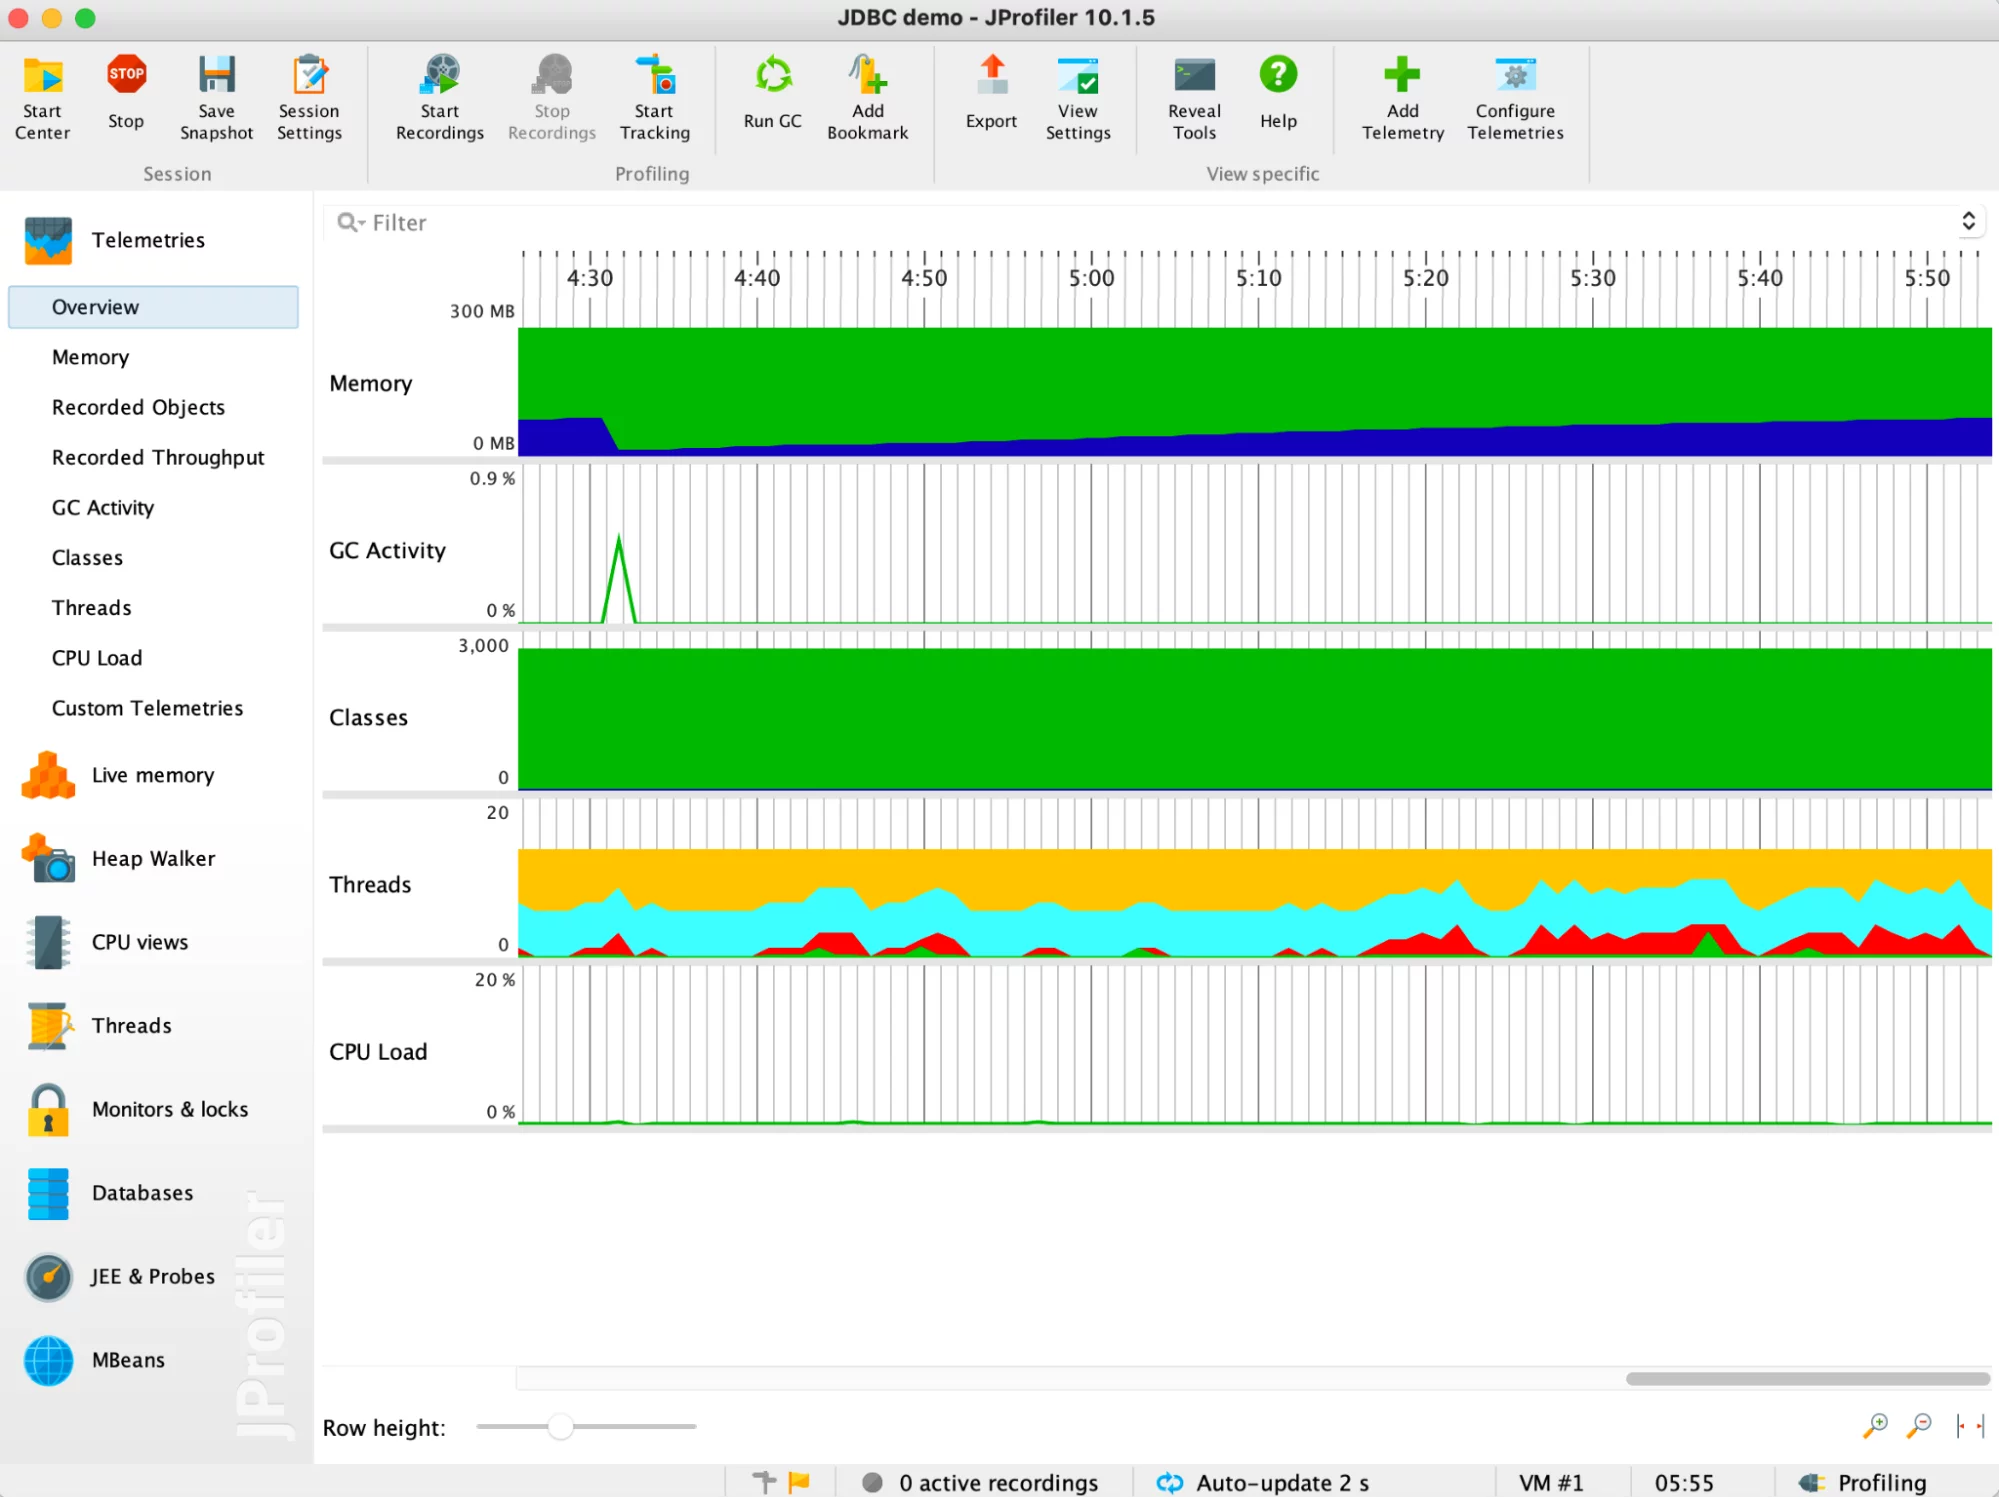
JProfiler is a fully-featured JVM profiler that gathers every bit of information you would need from a profiler. It allows live profiling of local and remote sessions, offline profiling and triggers, snapshot comparison, heap dumps analysis, automatic request tracking for Kotlin coroutines, Thread starts, java.util.concurrent executors, AWT, and SWT events. It can even track HTTP requests, RMI calls, web services calls, and remote Enterprise Java Beans calls going from one JVM to another if both Java Virtual Machines are profiled with JProfiler.
JProfiler provides an overview of memory usage with information about objects, allocation trees, and hotspots. You can inspect the heap and its contents, record CPU data for hotspot analysis, call graphs, and method statistics. JProfiler allows you to profile threads, get the Java virtual machine telemetry, and many, many more.
5. YourKit Profiler
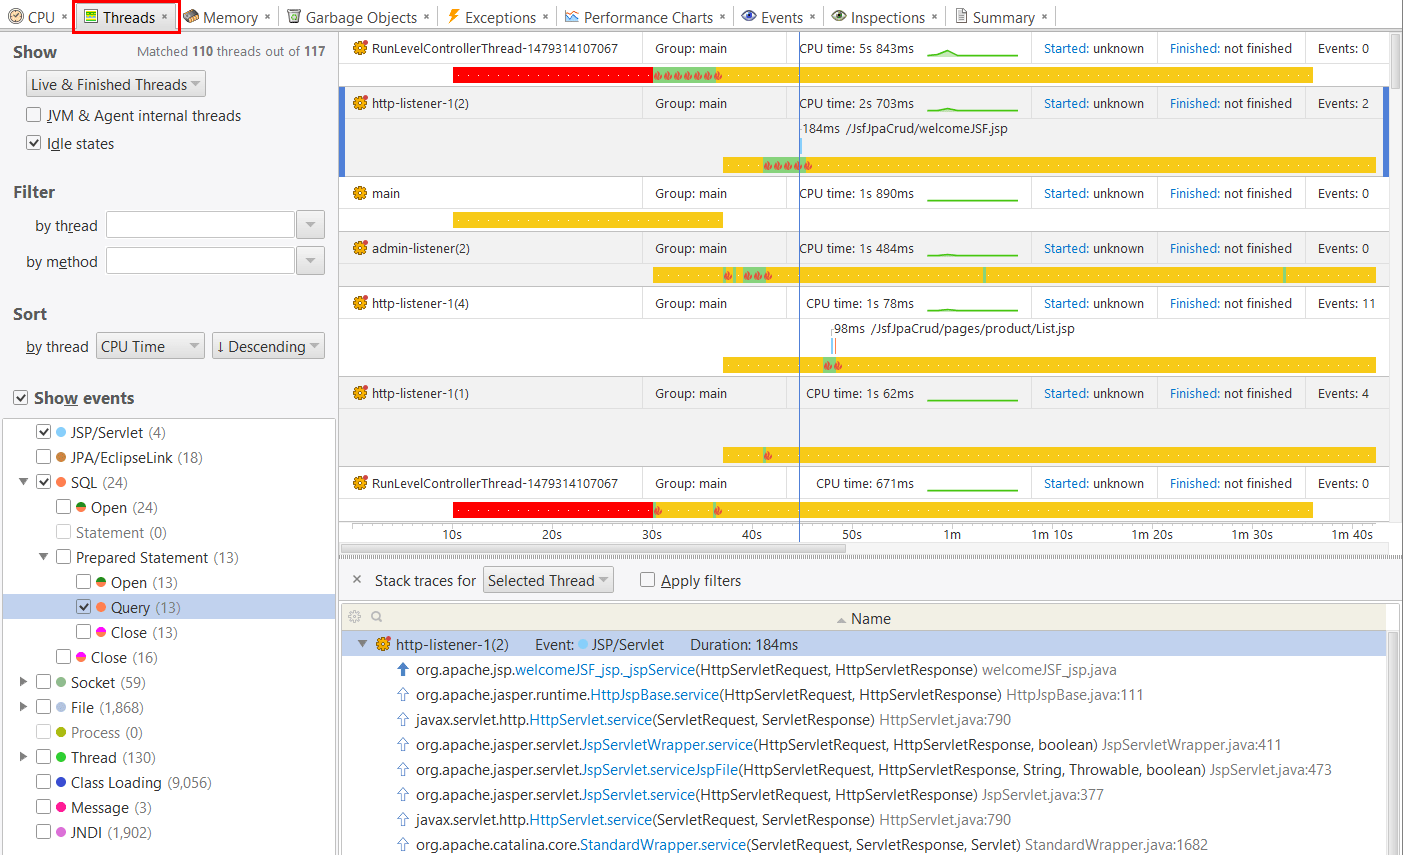
YourKit Java Profiler enables profiling of CPU and memory usage with the possibility of profiling local, test, and production environments with a live connection or with offline analysis. YourKit Java Profiler allows easy hot spot and calls tree visualizations by capturing JVM and operating system telemetry data and supports flame graphs for efficient performance bottleneck analysis. You can not only look into a single profiling session but compare CPU and memory snapshots to track the changes in the code and how they affect the performance of your JVM-based applications.
You can easily look into slow SQL queries and web requests with support for common data stores like MongoDB, Cassandra, and HBase. With the thread activity visualization, YourKit Java Profiler enables easy detection of thread synchronization issues. At the same time, the Java Exception profiling allows you to instantly spot places that slow down application performance due to the extensive number of thrown exceptions.
Lightweight Java Transaction Profilers
Unlike standard Java profilers that monitor the performance of all methods across the entire application, lightweight Java profilers track the performance of individual web requests or transactions by injecting themselves right into the code.
Transaction profilers extract in-depth data for everything JVM-related, enabling you to track the flow of requests to detect what method calls influenced your response time. However, they can only monitor your application during development. You’ll need an APM tool to track it in the QA and production environments.
6. xRebel
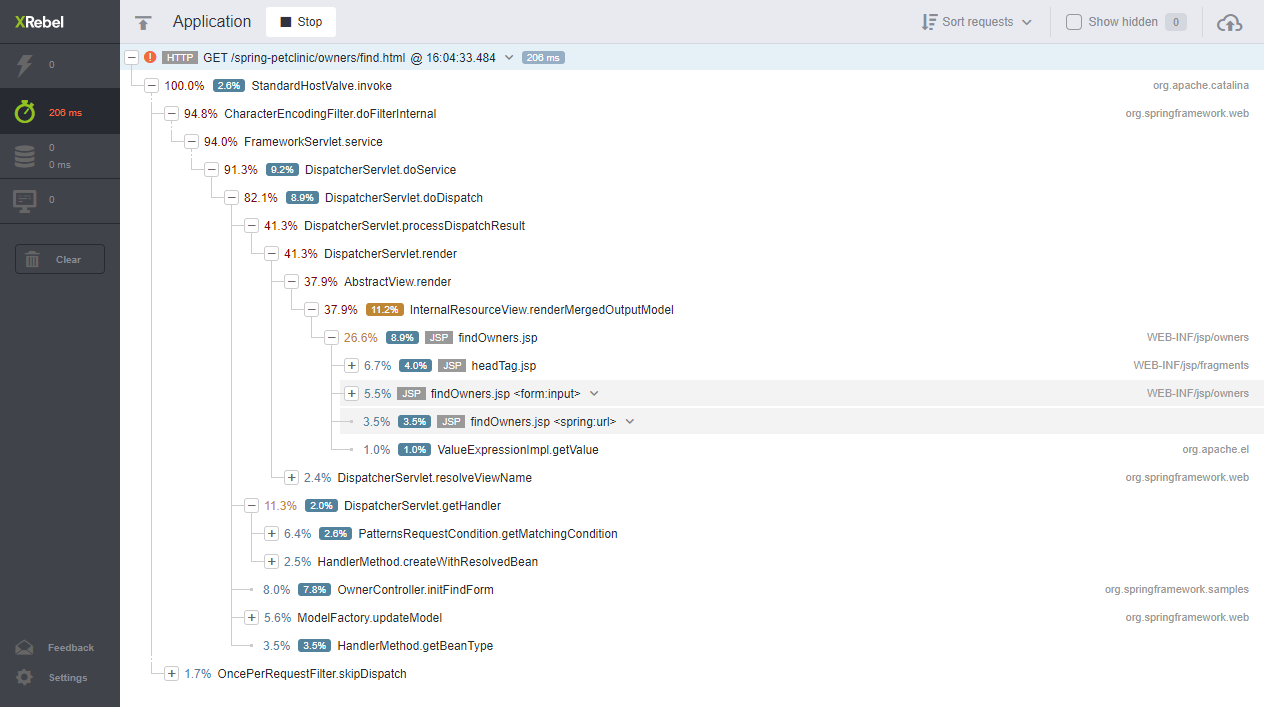
xRebel is a platform allowing users to see the execution details of the request on each of the xRebel-enabled services. That way, the request can be traced in the distributed application even if it spans through multiple Java Virtual Machines, providing performance for each part of its execution. That includes requests performed using JPA, Hibernate, and JDBC and done to datastores such as MongoDB, Cassandra, HBase, or Neo4j. All these features make it perfect for monitoring and troubleshooting microservice-based architectures.
7. LightStep
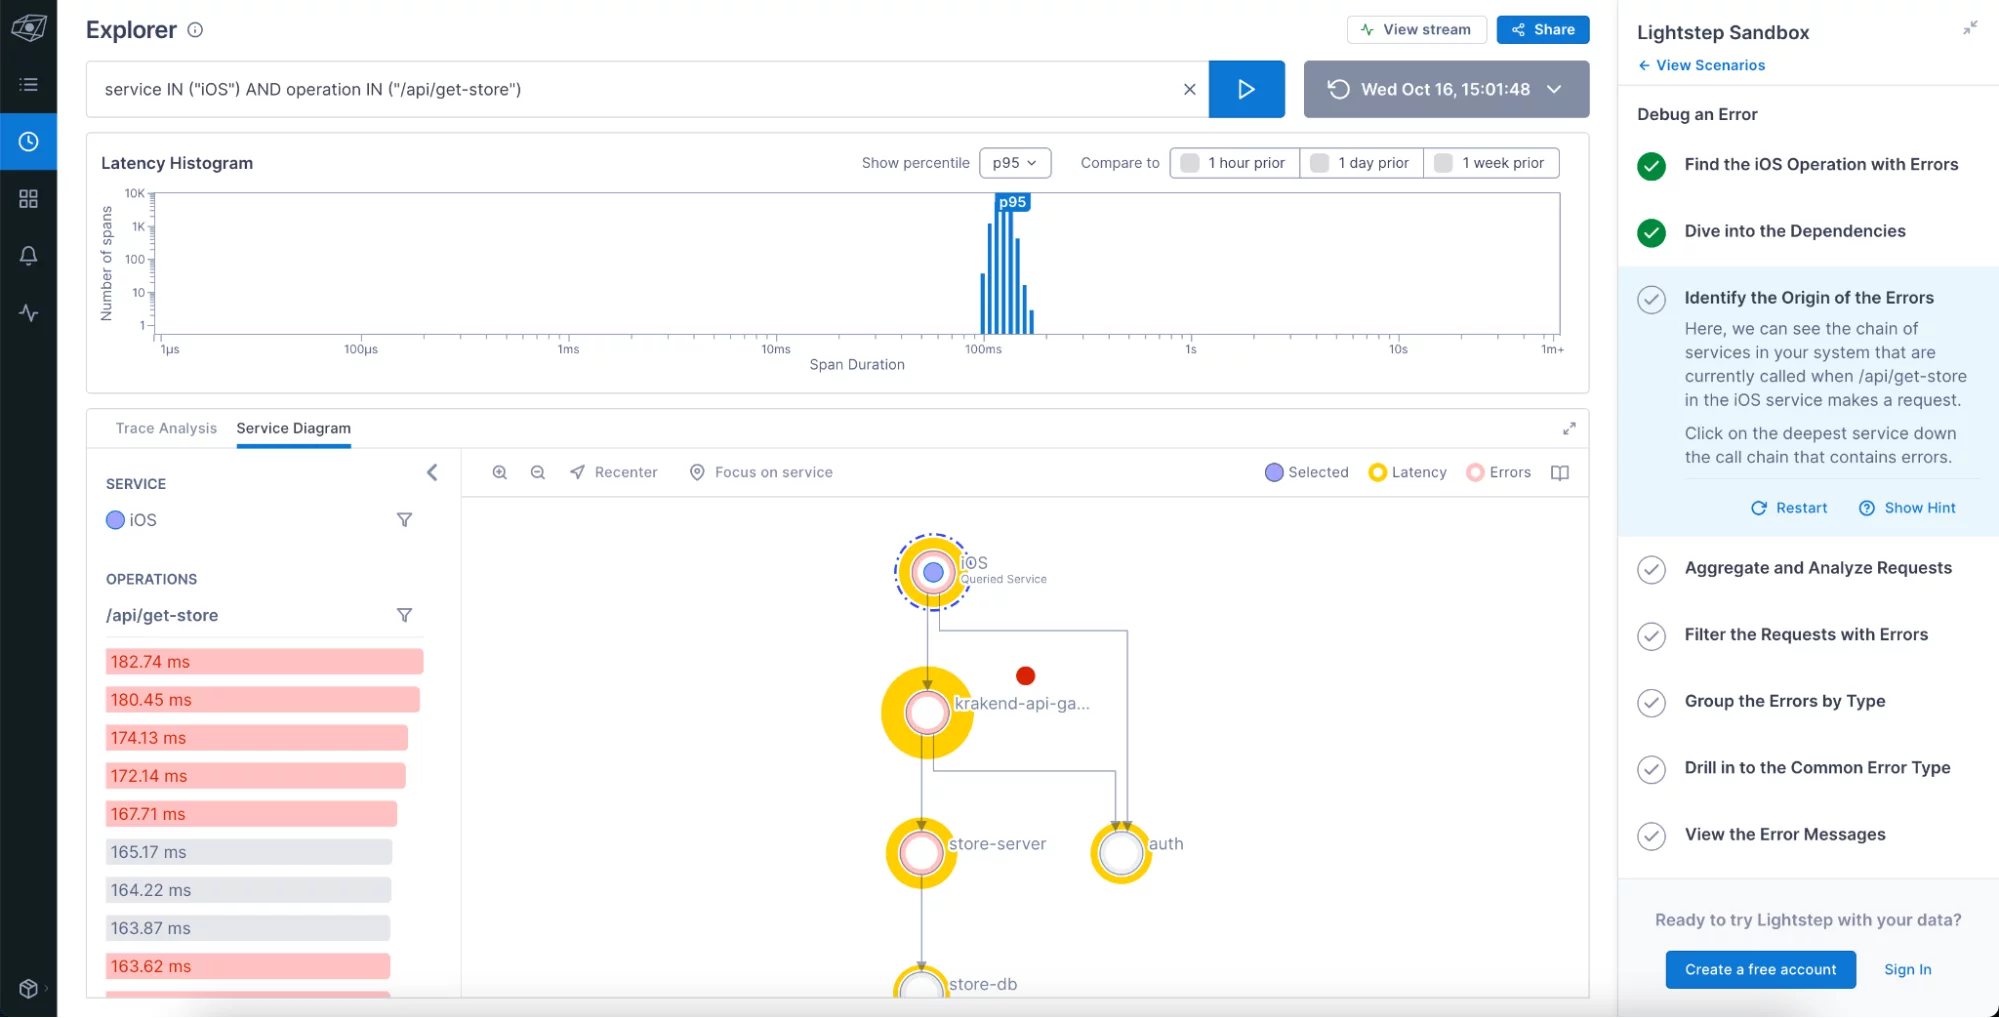
LightStep combines full-context distributed tracing with the power of Application Performance Monitoring, giving you powerful insights into the deepest level of your Java application for easier troubleshooting and root cause analysis.
You can drill down to the service you are interested in and explore each of its calls, group, and filter them, all within an easy-to-use UI. Combine that with dashboarding capabilities, alerting, and data streams, and you get a very good tool for your Java application monitoring.
Application Performance Management (APM)
As development and production environments have different requirements, it’s critical to see how your Java application performs live in production. They collect only information that is highly relevant for JVM performance concerns by aggregating timing statistics and sampling traces.
With APM tools, you can detect issues before going into production by monitoring the QA and Staging environments and debug production live by analyzing traces and Java exceptions. On the downside, it can be expensive to run APM on all QA/Staging and production servers and can slow down your application if they are not tuned accurately.
You can find both open source and commercial APM tools and good ones at that. Below, we’ve gathered some of the most popular open-source APM solutions that help monitor Java applications.
8. Glowroot
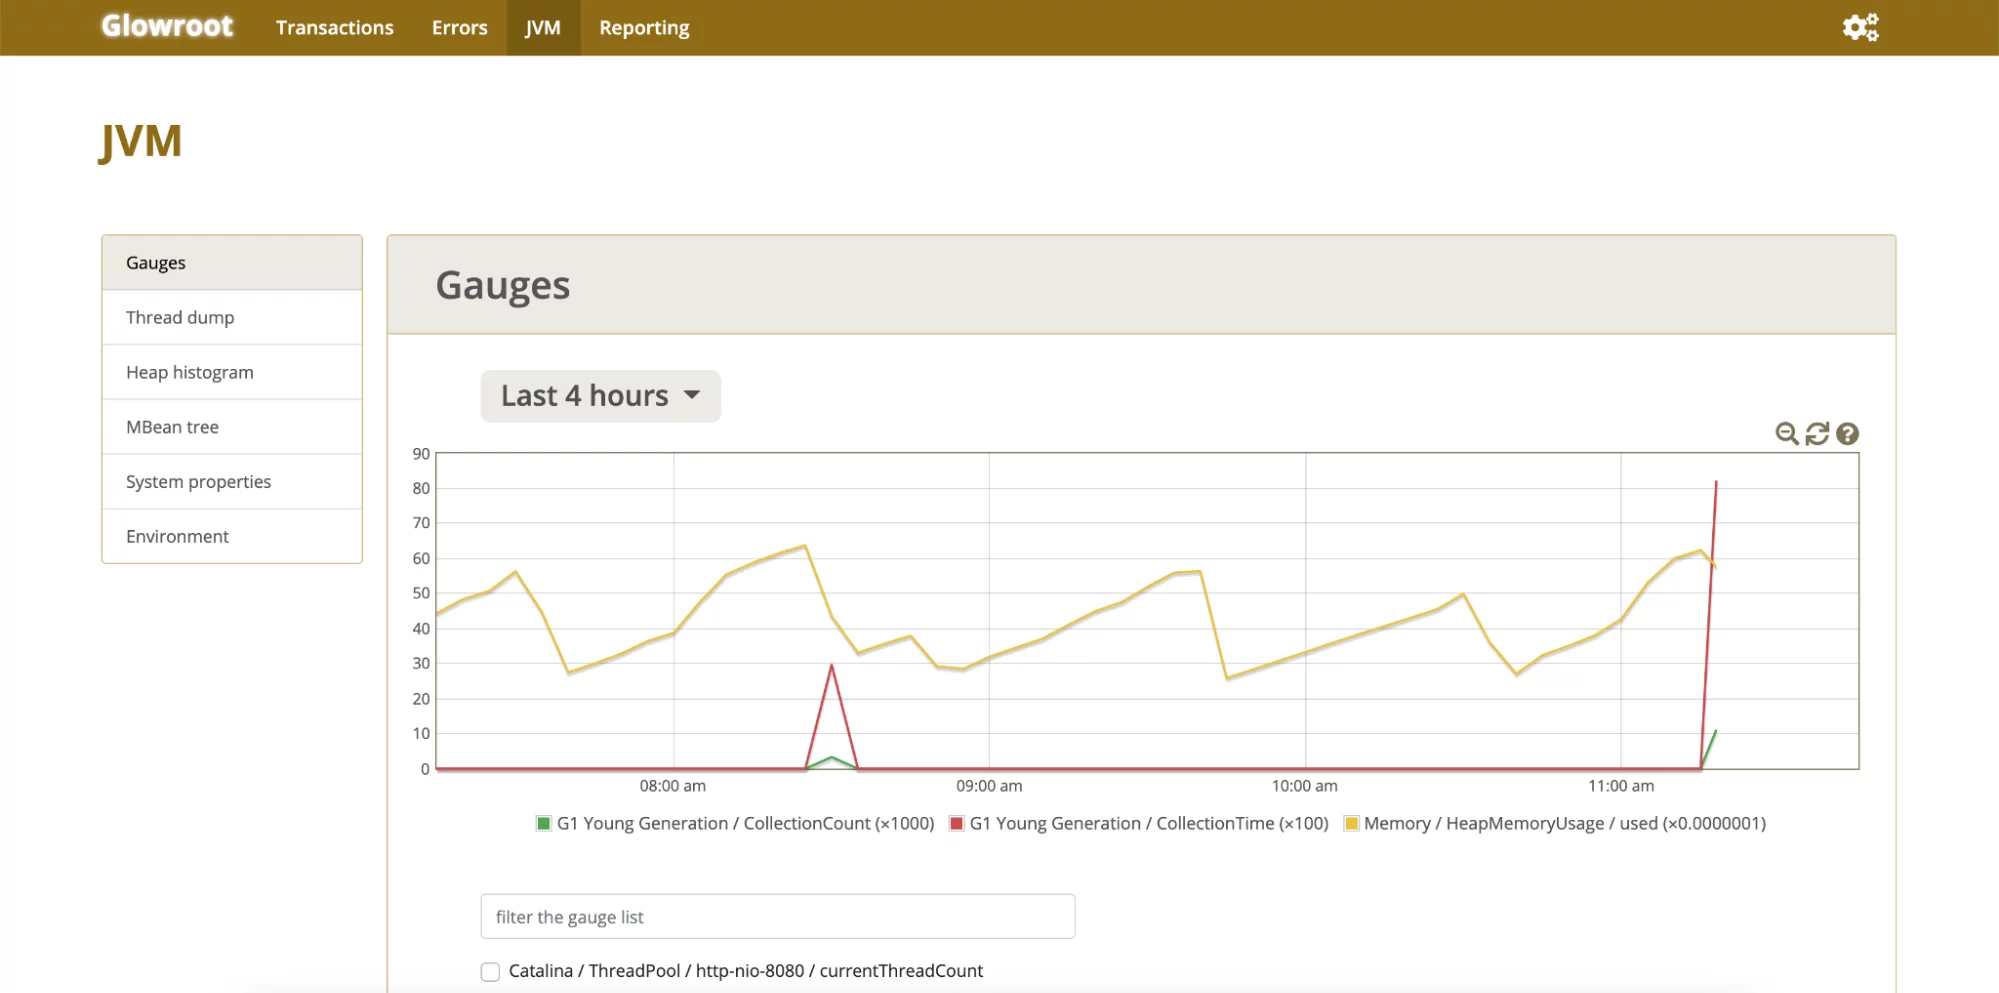
Glowroot is a fast, clean, and easy-to-use open source Java APM tool. It enables tracing to capture slow requests and mistakes, as well as log time follow for every user action, SQL catch, and aggregation. The tool further features a historical roll-up of all information with configurable maintenance and provides charts to visualize time breakdown and response time percentiles. With its interactive UI, you can monitor your Java application from desktop and mobile devices alike.
9. Pinpoint
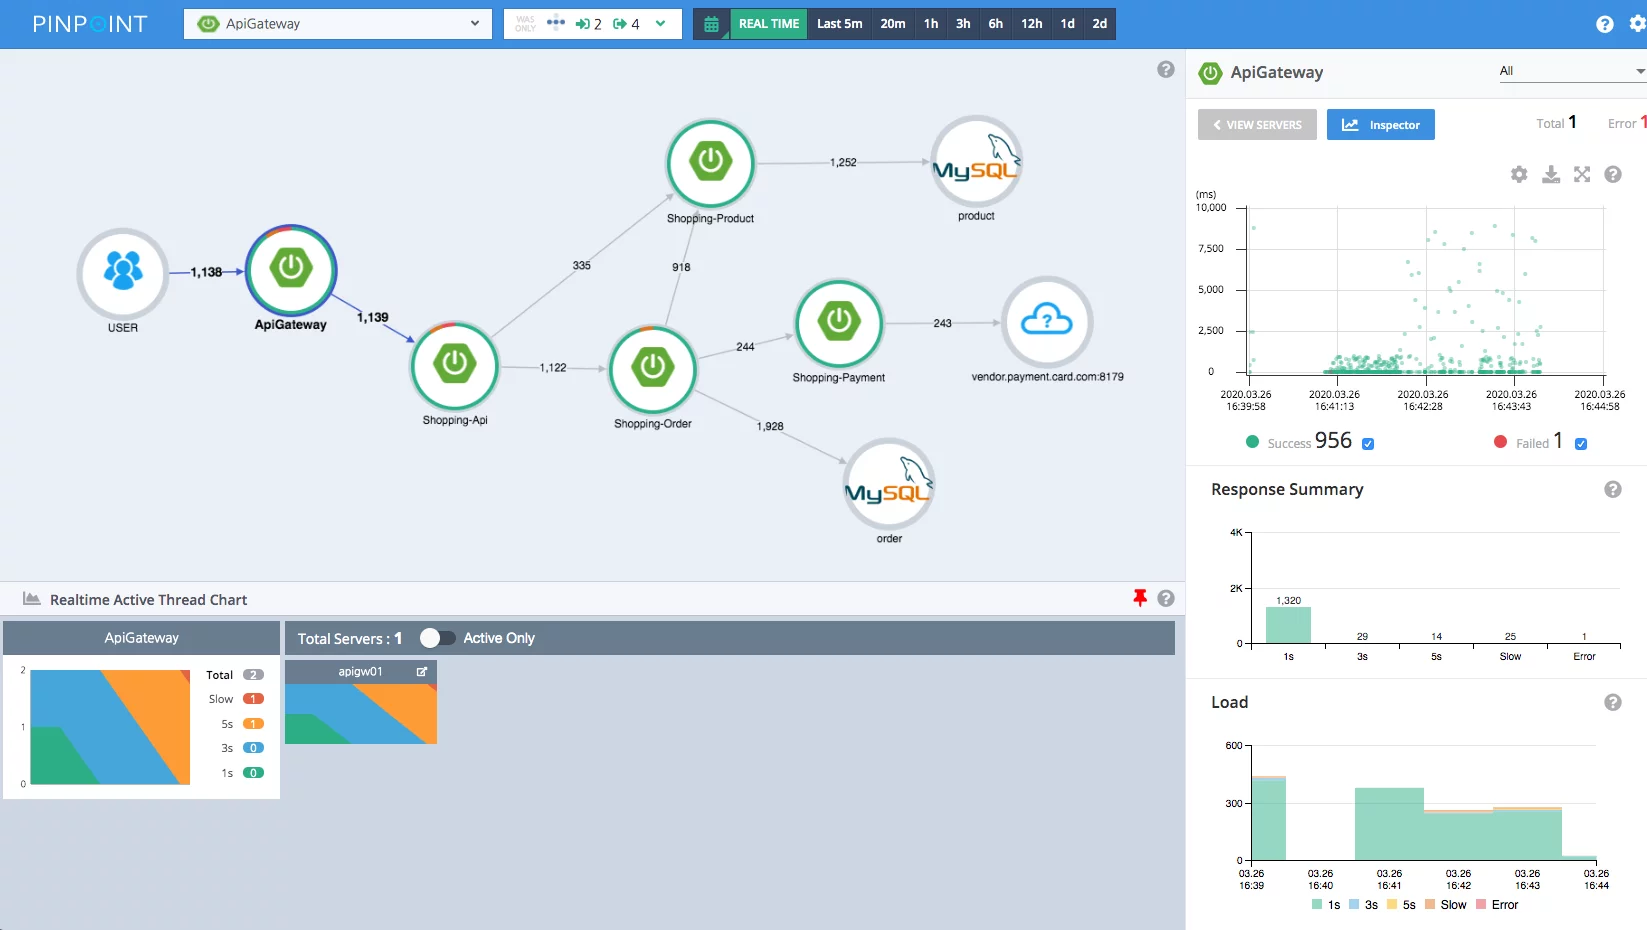
A free and open source APM solution, Pinpoint, can help you monitor the performance of complex distributed systems written in Java and PHP. It looks at the structure of your system and how its components are interconnected by tracing transactions across distributed applications. You can track active threads in real time, see request count and response patterns, as well as JVM performance metrics such as CPU and memory usage, garbage collection, and JVM arguments.
10. JavaMelody
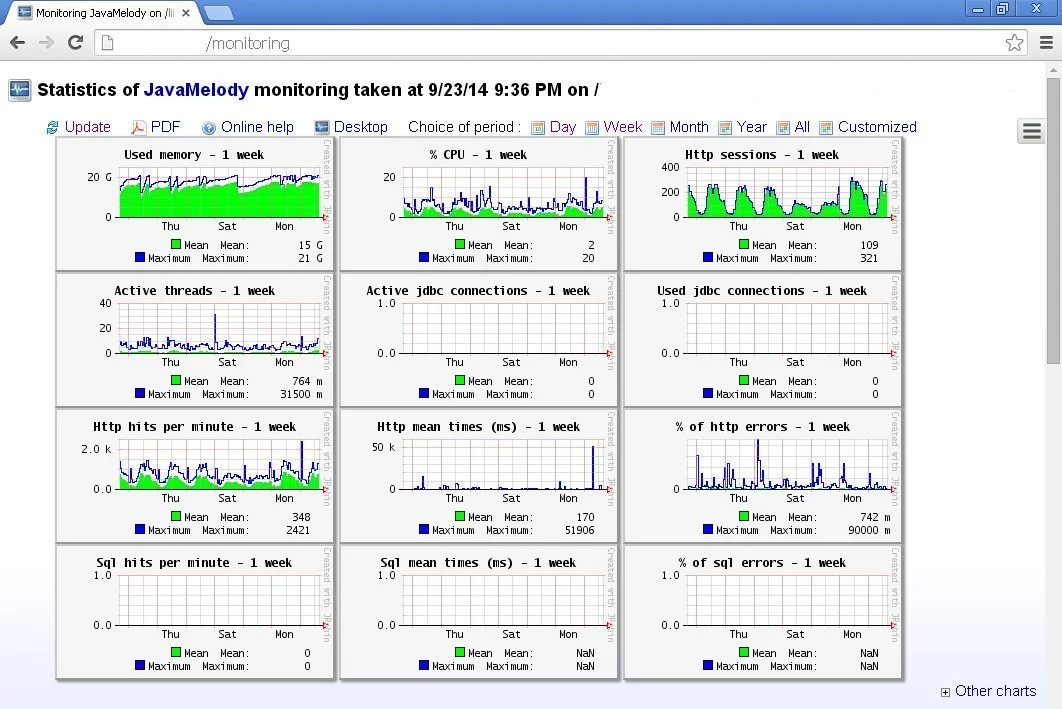
JavaMelody is a free and open source APM tool designed to monitor Java or Java EE applications in QA and production environments. Seeing as it doesn’t include a database or profiling, JavaMelody is a lightweight solution you can easily integrate into most applications.
11. Scouter
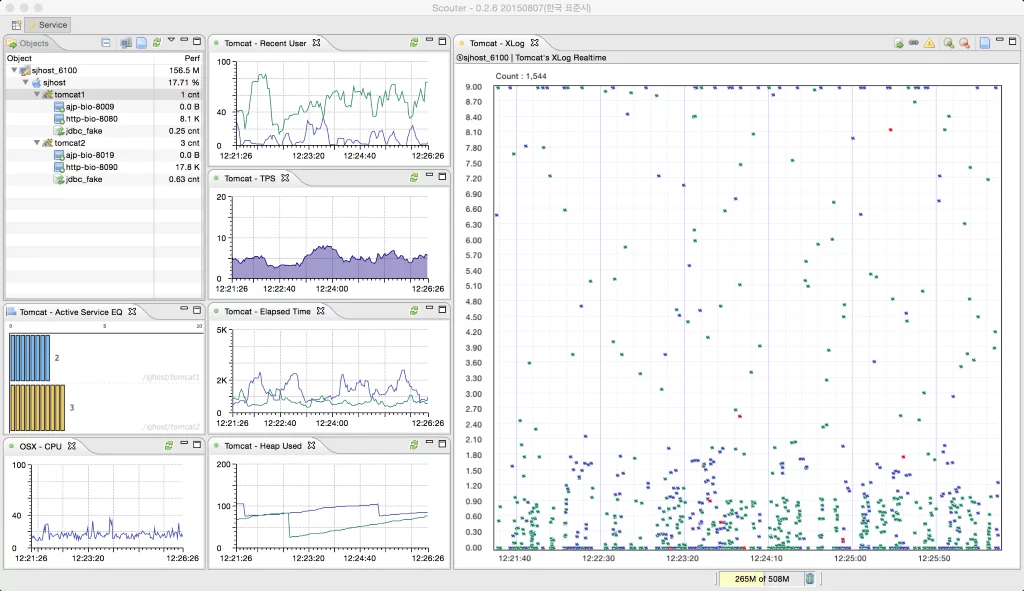
Scouter calls itself the free and open source alternative to New Relic and AppDynamics’ APM. It shows metrics like user activity, service activity (TPS, response time, SQL profiling, and more), and resource consumption metrics (CPU, memory usage, heap memory).
12. Stagemonitor
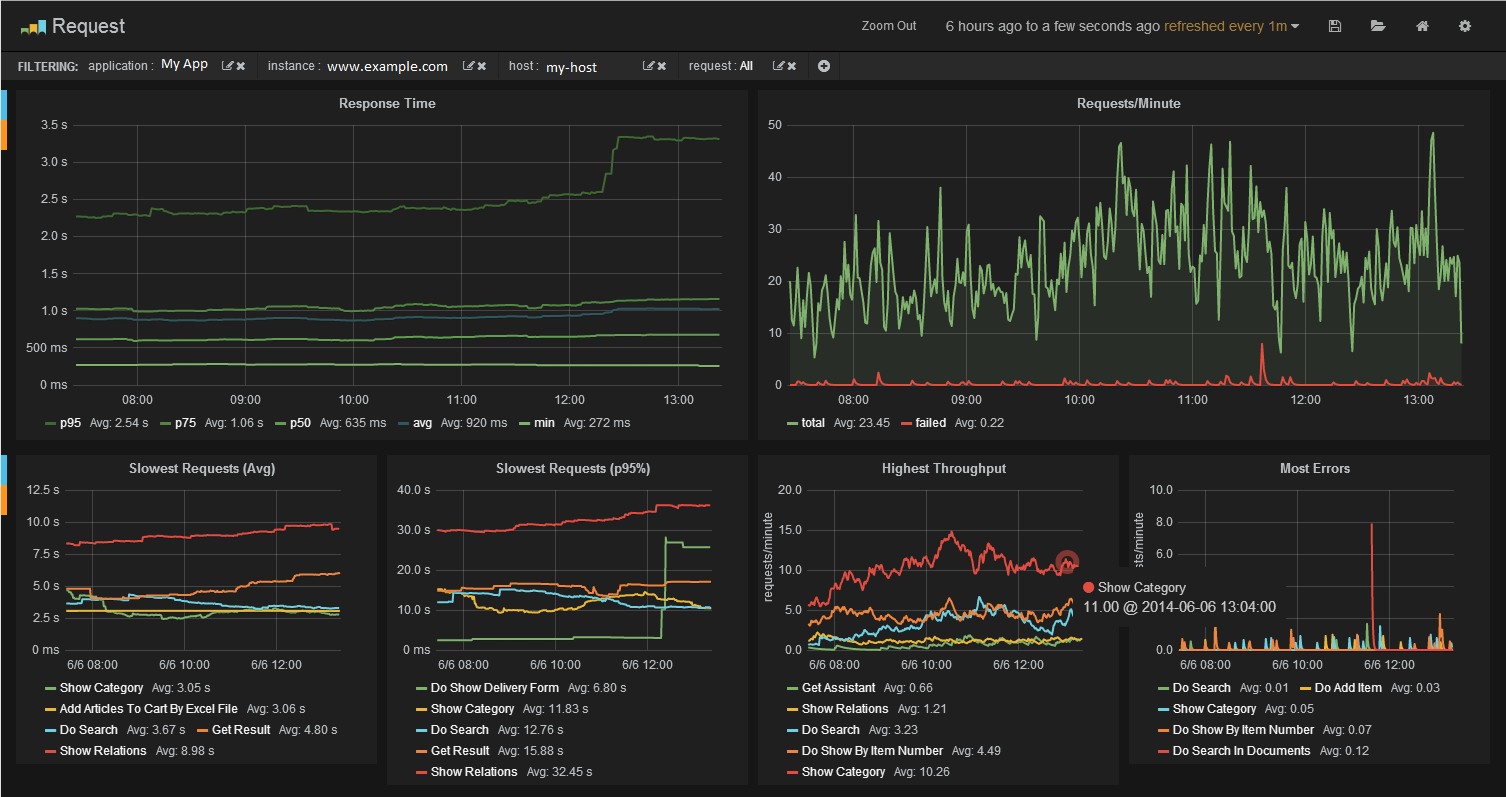
Stagemonitor is a community-developed monitoring tool designed for clustered application stack. That means that you can use it to monitor development, testing, and production of JVM-based applications running on multiple servers while keeping a low overhead. It integrates with time series databases (TDSB) such as Elasticsearch, Graphite, and InfluxDB.
With Stagemonitor, you can view historical or live data from the cluster or the developer server, create custom alerts, and set thresholds for each JVM metric. It also allows you to create custom dashboards to visualize and analyze metrics.
13. MoSKito
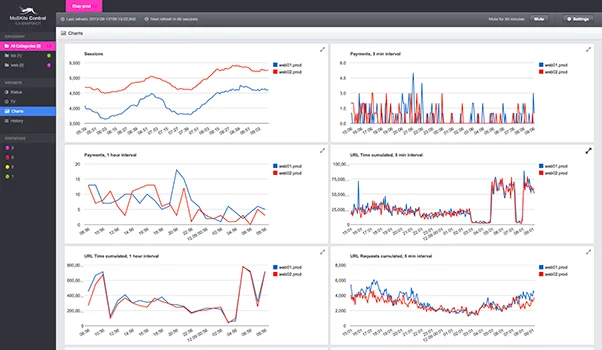
MoSKito is a complete toolset for DevOps to monitor the performance and behavior of Java applications. It collects, analyzes, and stores all critical JVM performance metrics such as memory, CPU, threads, caches, load distribution, and many more in real time.
Moskito works with all major app servers such as Tomcat, JBoss, Jetty, WebLogic, doesn’t require code change, and keeps your data private. You can set thresholds and notification alerts, record user activity, and provide a clean dashboard to monitor all application processes in multi-node production environments.
Real User Monitoring (RUM)
To deliver an interactive experience, apps can demand many dependencies, such as web fonts, images, and Javascript/CSS frameworks. RUM looks at how your visitors interact with your application, giving you visibility into its dependencies by showing asset download and page rendering time.
There are many such tools you can pick from, both standalone and as part of an APM.
14. Sematext Experience
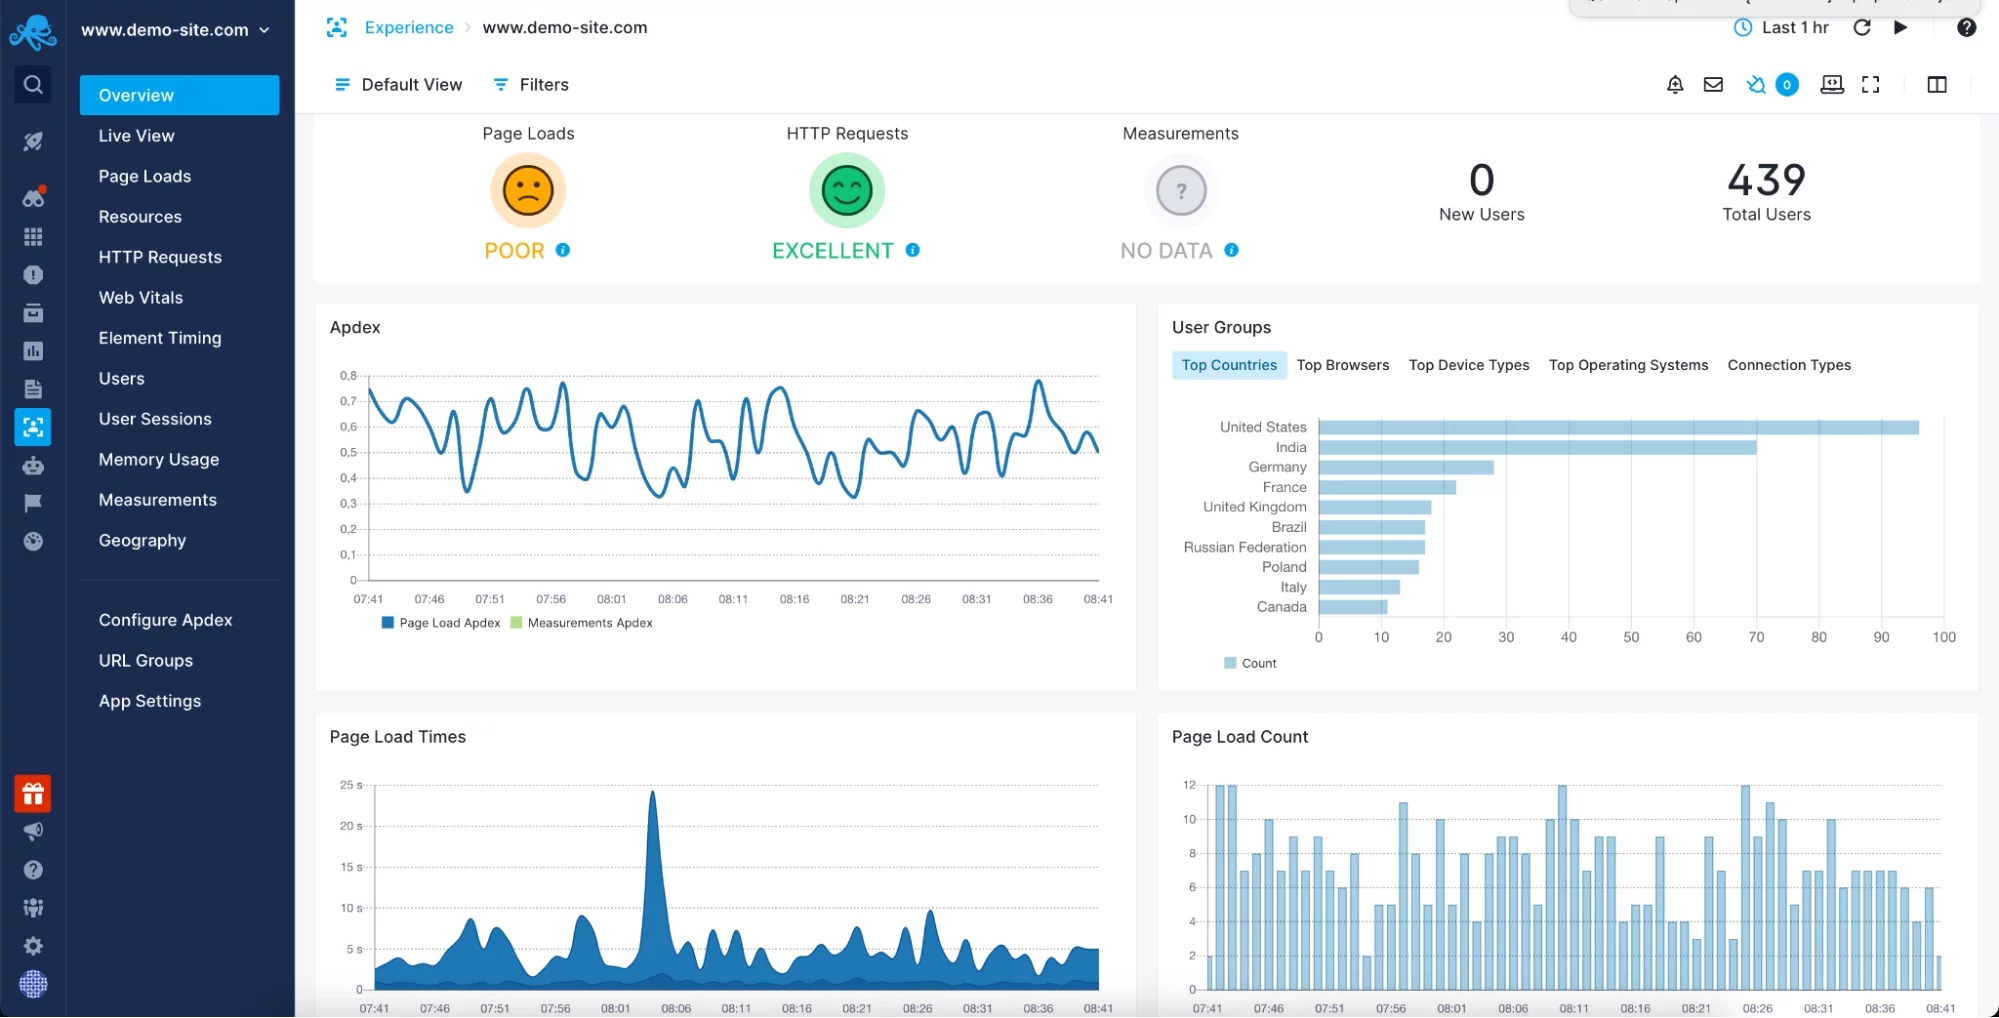
Sematext Experience is a real user monitoring tool that allows you to track app performance and receive alerts whenever it detects anomalies that affect end-user experience.
You can correlate the end-user behavior metrics provided by the Sematext Experience with the metrics provided by Sematext Java Monitoring to expand your view over a given period. This offers you a broader perspective when troubleshooting or looking into the metrics in real time.
Knowing how your users interact with your application offers you a unique opportunity to get to the root cause of the potential issue faster and more efficiently by looking into the problem from various angles. If you want to see how Sematext Experience stacks against similar solutions, read our article about the best real-user monitoring tools available today.
Logging Solutions
Java logs provide useful insight into executed code, errors, potential issues, and many more. For instance, if you’re using Nginx or Apache as proxy servers, access logs will help you see how long it takes for a request to be processed. By aggregating access logs, you can detect the most popular, fastest, as well as slowest endpoints.
Analyzing logs using the command line may take time, and doing that on multiple servers may be problematic. Instead, you can use log analyzers that do the hard work for you. For small datasets, you can opt for desktop tools like AWStats or Apache Log Viewer.
Otherwise, for staging and production environments, you should turn to a hosted logging solution, such as Sematext Logs.
15. Sematext Logs
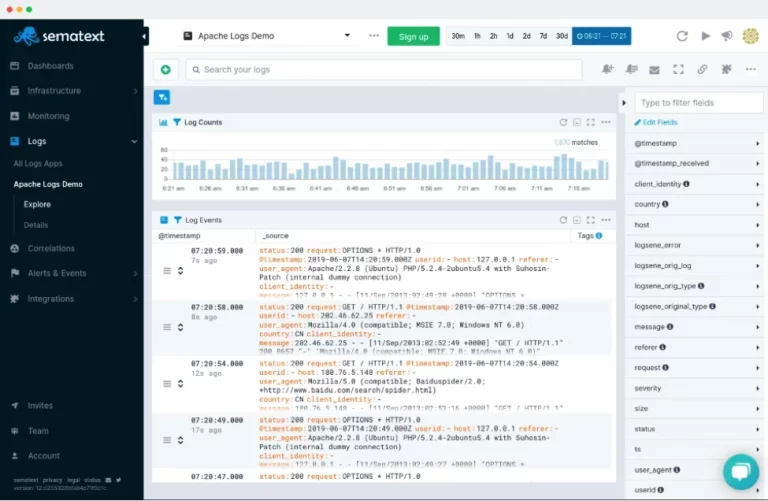
Sematext Logs is a logging service that allows you to centralize logs from various sources like applications, microservices, operating systems, different devices, and, of course, Java-based applications.
The platform enables you to structure, visualize and analyze all collected data passively and actively. You can create informative dashboards connecting every piece of information and observe how your systems behave in real-time or set up alerts to be notified when a critical event happens. Use per-user access restrictions to control who can access which data and store your data in the S3-compatible storage for no additional cost.
For more details on how Sematext Logs stacks against similar platforms, we compared it with solutions from the entire log management landscape, from log analysis software and log aggregation tools to log management solutions and cloud-based logging services.
Observability Platforms
However, while logs point out potential issues in the Java code, you can’t diagnose the performance side of the application without JVM metrics. This is why you should look for an integrated monitoring tool that allows you to correlate logs, metrics, and real user monitoring data – such as Sematext Cloud.
16. Sematext Cloud
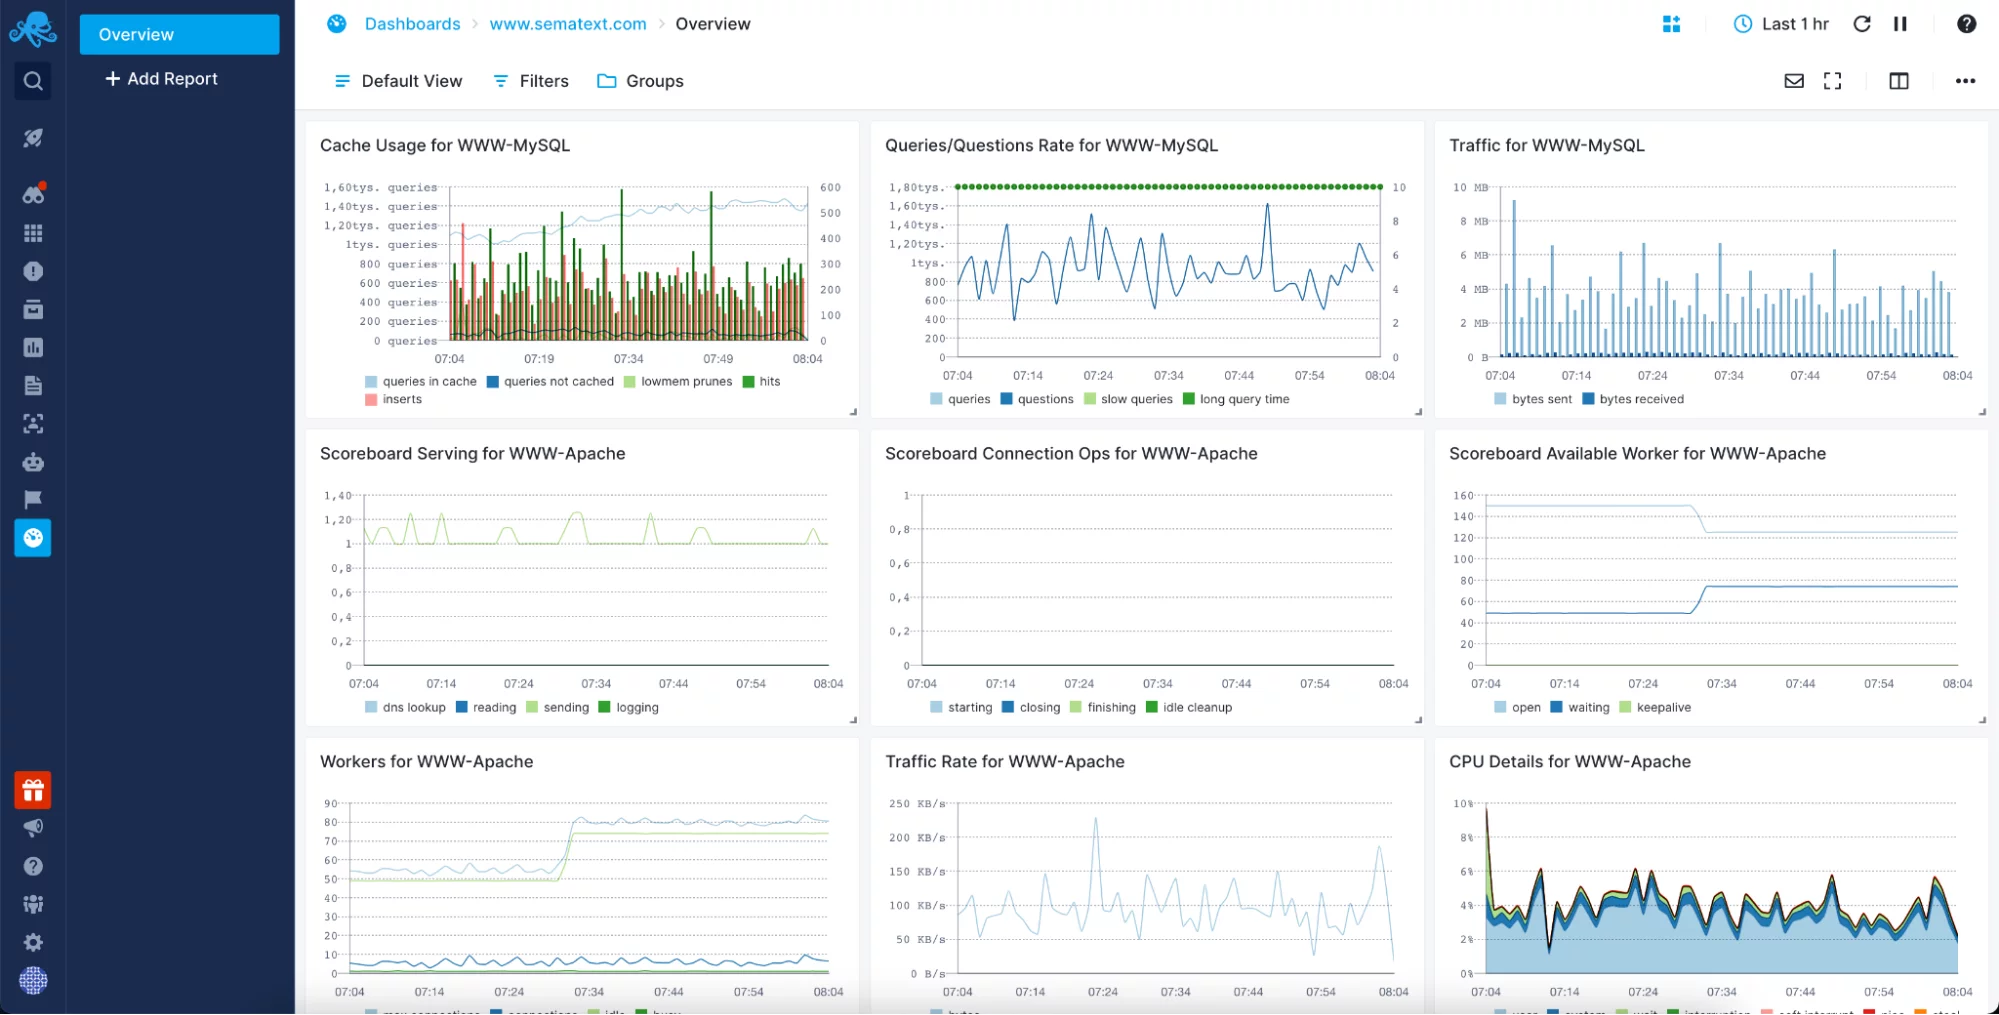
Sematext Cloud is an observability platform providing you a rich set of features. With the simple and easy setup monitoring your Java application is easy and fast. With the out-of-the-box dashboards pre-created, you can start monitoring your JVM-based application as soon as you’ve finished installing the agent. Sematext Cloud is not only dedicated to metrics. With Sematext Logs, you can also analyze your logs using the automated logs discovery feature for your Java applications or send them via one of the supported log shippers.
You can extend and create new dashboards that span through metrics, logs, and other features such as Real User Monitoring and Synthetics Monitoring. With the alerting engine supporting anomaly detection, you will be notified when you need to intervene via one of the supported notification hooks delivered right to the destination of your choice.
You can read more about what Sematext Cloud offers compared to her observability platforms in our article about the best cloud monitoring tools available today.
Application Memory Analysis Tools
We’ve already established that monitoring memory usage is critical to ensure your Java application runs smoothly. Consequently, heap dumps can help diagnose issues such as memory leaks, GC problems, and java.lang.OutOfMemoryError, and optimize memory usage.
You can load the heap dump file into memory analyzers such as Eclipse MAT and the already quite old BHeapSampler to help identify the cause of memory-related performance problems. Java profilers like JProfiler and YourKit can also help monitor memory usage as they have the option to analyze the heap.
17. Eclipse Memory Analyzer Tool (MAT)
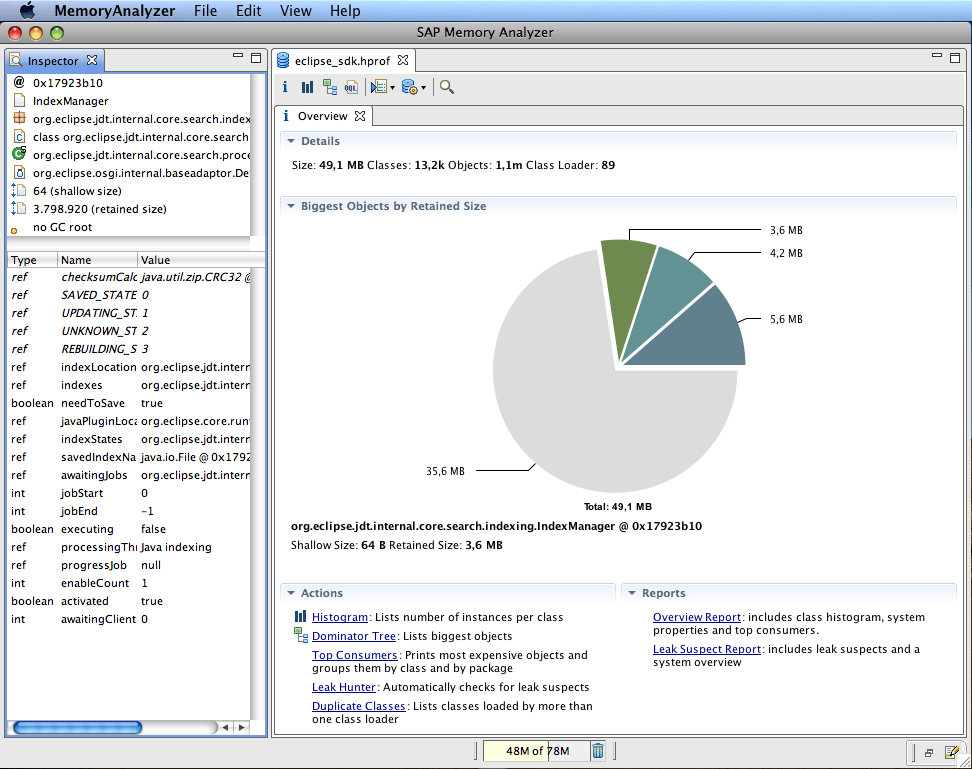
Eclipse MAT is a powerful Java heap analyzer that helps to detect memory leaks and high memory usage to improve application performance. With this tool, you can analyze productive heap dumps, calculate the retained sizes of objects, run a report to automatically extract leak suspects, and identify who keeps the GC from collecting objects.
Conclusion
Choosing the right tool for monitoring your Java applications and the environment they are running in is not easy. The tool or tools you will go for should support live and post-mortem analysis on top of metrics, logs, traces. Metrics for looking into how your application and JVM are working and what is happening on the operating system level. Logs to see what’s exactly happening and traces to see the overall execution path in the distributed environment.
In some cases, you might need to look deeper into the performance issue, which means comparing and analyzing heap dump and thread dump between different periods to spot the differences. This may require a different tool than the one that gives you insights into your JVM application telemetry.
Luckily, with all the options available, you will for sure find a Java monitoring tool or tools that fits your needs, regardless if you’re looking for a commercial solution, an open-source, or a self-hosted one. So nothing should stop you from monitoring your Java applications and the environment on which they run.