It’s virtually impossible to manage today’s complex IT environments at scale without a comprehensive system monitoring solution that allows you to check the health of all your applications and services from a single pane of glass. When your end users are experiencing difficulties, you must have such a tool in place that lets you quickly ascertain and remediate the root cause of the slowdown or error.
In this blog post, we compare some of the best system monitoring software available today, regardless of whether you are looking for a paid, free, or open-source option.
Definition: What Is a System Monitoring Tool?
A system monitoring software is a tool that tracks, logs, and analyzes system resources throughout all layers of the IT environment—from operating systems and firmware at the bottom of the stack, to system applications and services in the middle layer, to user software running at the top.
It collects diverse layer-specific metrics and events using agents, as well as API integrations with third-party tools and services. The software then aggregates and analyzes the metrics and events to give you a correlated holistic view of system health, performance, and security. Once a baseline has been established, the tool alerts admins to anomalous behavior that may have a negative impact on system availability, performance, or security.
Top System Monitoring Software
Below are the pros, cons, and pricing of the best system monitoring tools available in the market.
1. Sematext Monitoring
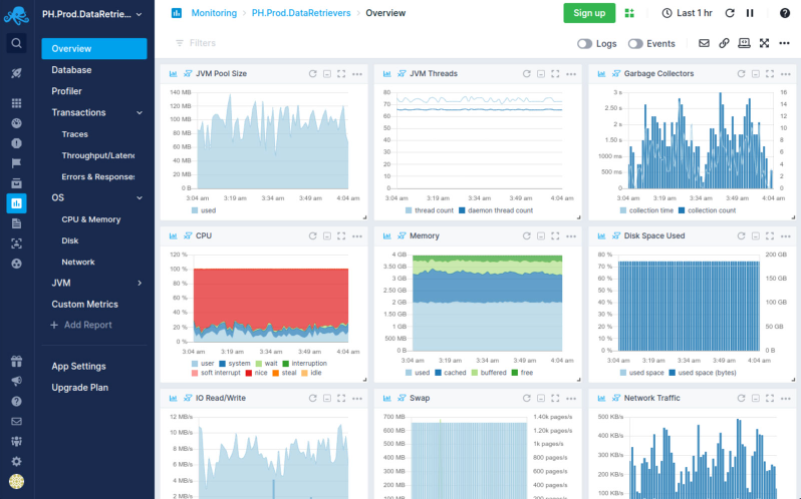
Sematext Monitoring is a robust system monitoring software that gives you end-to-end, real-time visibility into all deployments—on-premises and cloud. At a glance, you’ll get valueable insight into the health status of your system by centrally monitoring applications, servers, containers, events, inventory of packages, servers, container images, databases, processes, and more.
Sematext Monitoring delivers actionable visibility into Docker containers and orchestration platforms like Kubernetes, Docker Swarm, and Nomad.
The Sematext Agent is incredibly lightweight, which means it will fit well into your current stack. It offers more than 100 integrations for popular application frameworks, such as Apache Cassandra, MySQL, PostgreSQL, JVM, Elasticsearch, Solr, MongoDB, and more.
Sematext is constantly on the lookout for the wellbeing of your system. When an issue is detected, you will immediately be notified through alerts and notifications via webhooks. Using a specific integration for alerting services? Integrations with leading system alerting services, like PagerDuty, Opsgenie, and Splunk On-Call (formerly VictorOps) can also be used with the Sematext platform, so you’ll never miss a beat.
[product_banner type=”infrastructure-monitoring”]Map and monitor your entire infrastructure on-premise or in the cloud.[/product_banner]
Sematext is the perfect solution for system monitoring. In just a few minutes of setup time, and in addition to everything mentioned above, you’ll get:
- Automated discovery of services and logs; quick onboarding
- Correlates logs and events with a consolidated single-pane system status and health view
- Monitors for server misconfigurations and out-of-date packages
- Process monitoring for visibility into performance bottlenecks
- Flexible per-app pricing
Pricing
Sematext offers a 14-day free trial. There are three pricing tiers: Basic (free infrastructure monitoring of up to three hosts), Standard ($3.6 per host/month), and Pro ($5.76 per host/month).
To learn more about how Sematext works for monitoring your system, check out the short video below:
2. SolarWinds Server & Application Monitor
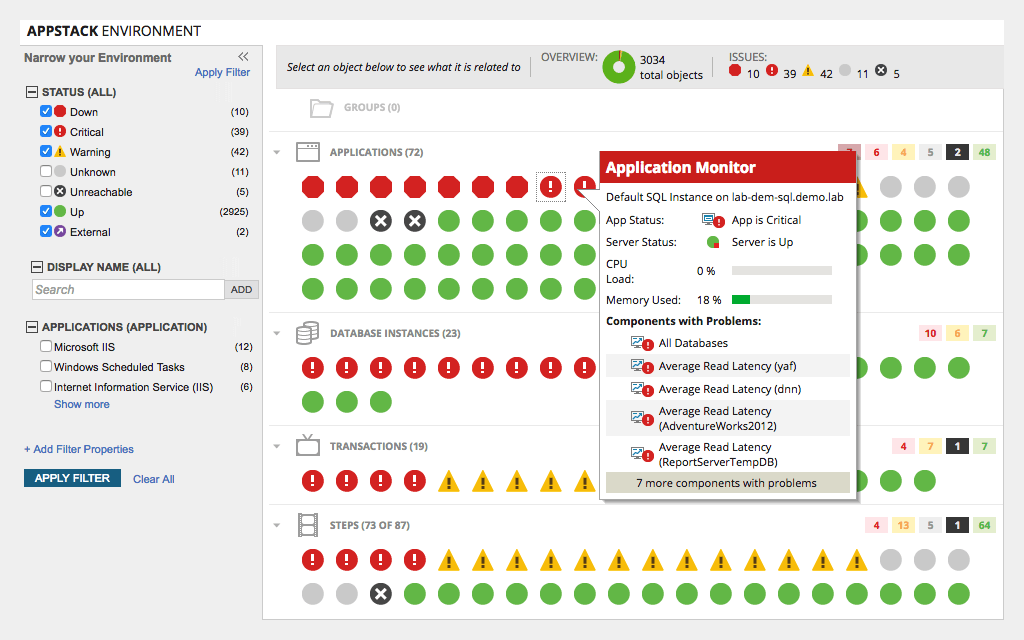
SolarWinds offers a suite of system management tools that monitor applications, web app user experience, virtual hosts, servers, storage performance, and other resources to provide visibility into system health and performance across on-premises and cloud environments.
With SolarWinds, you get out-of-the-box templates for more than 1,200 applications and systems, as well as support for a wide range of integration protocols, including WMI, SNMP, Powershell, and REST API.
Pros
- Single-pane console across applications and servers
- Accelerates time to resolution by aggregating and charting diverse log data
- Cross-stack comprehensive insights into performance, uptime, capacity, and resource utilization
- Monitors performance metrics and uptime
Cons
- Some features included in other Solarwinds tools
- Complex configuration due to multiple modules
Pricing
SolarWinds offers a full-function free trial for 30 days. Subscription and perpetual licensing prices start at $1,622 and $2,995 for up to 10 nodes, respectively.
3. Atera
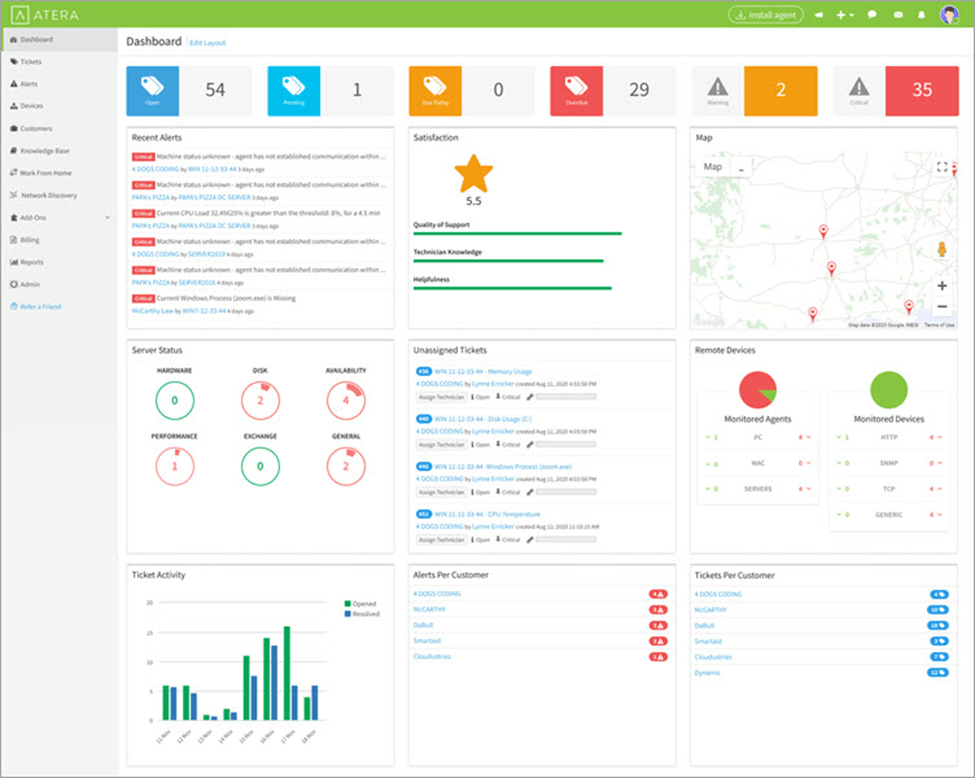
Atera is a monitoring tool available as one of two SaaS systems: professional services automation (PSA) and remote monitoring and management (RMM). Managed service providers and IT teams use the agent-based Atera solution to monitor unlimited hardware and software endpoints and troubleshoot system issues. RMM scripts can monitor remote connections, manage patches, install software, orchestrate incident response, and more.
You can track and assess the health and performance of networks, assets, services, and applications with Atera’s single dashboard and automated reports. You can also customize alerts to support efficient incident response times.
Pros
- Real-time monitoring and alerts for system resources, user behavior, network/IP traffic flow, and more
- Instant identification of unmanaged devices (add-on)
- Automated software update patches
- Pre-configured admin and maintenance tasks, as well as custom scripting
Cons
- Difficult-to-customize inflexible dashboards, alerts, reports, and automation features
- Overly simple network discovery tool
Pricing
Atera offers a full-featured, 30-day, free trial for each of the tiered subscriptions, which are priced at flat rates per technician per month. The prices shown here are discounted. For an annual subscription, the costs are: Pro ($79/tech/month), Growth ($119), and Power ($149).
4. Datadog Infrastructure Monitoring
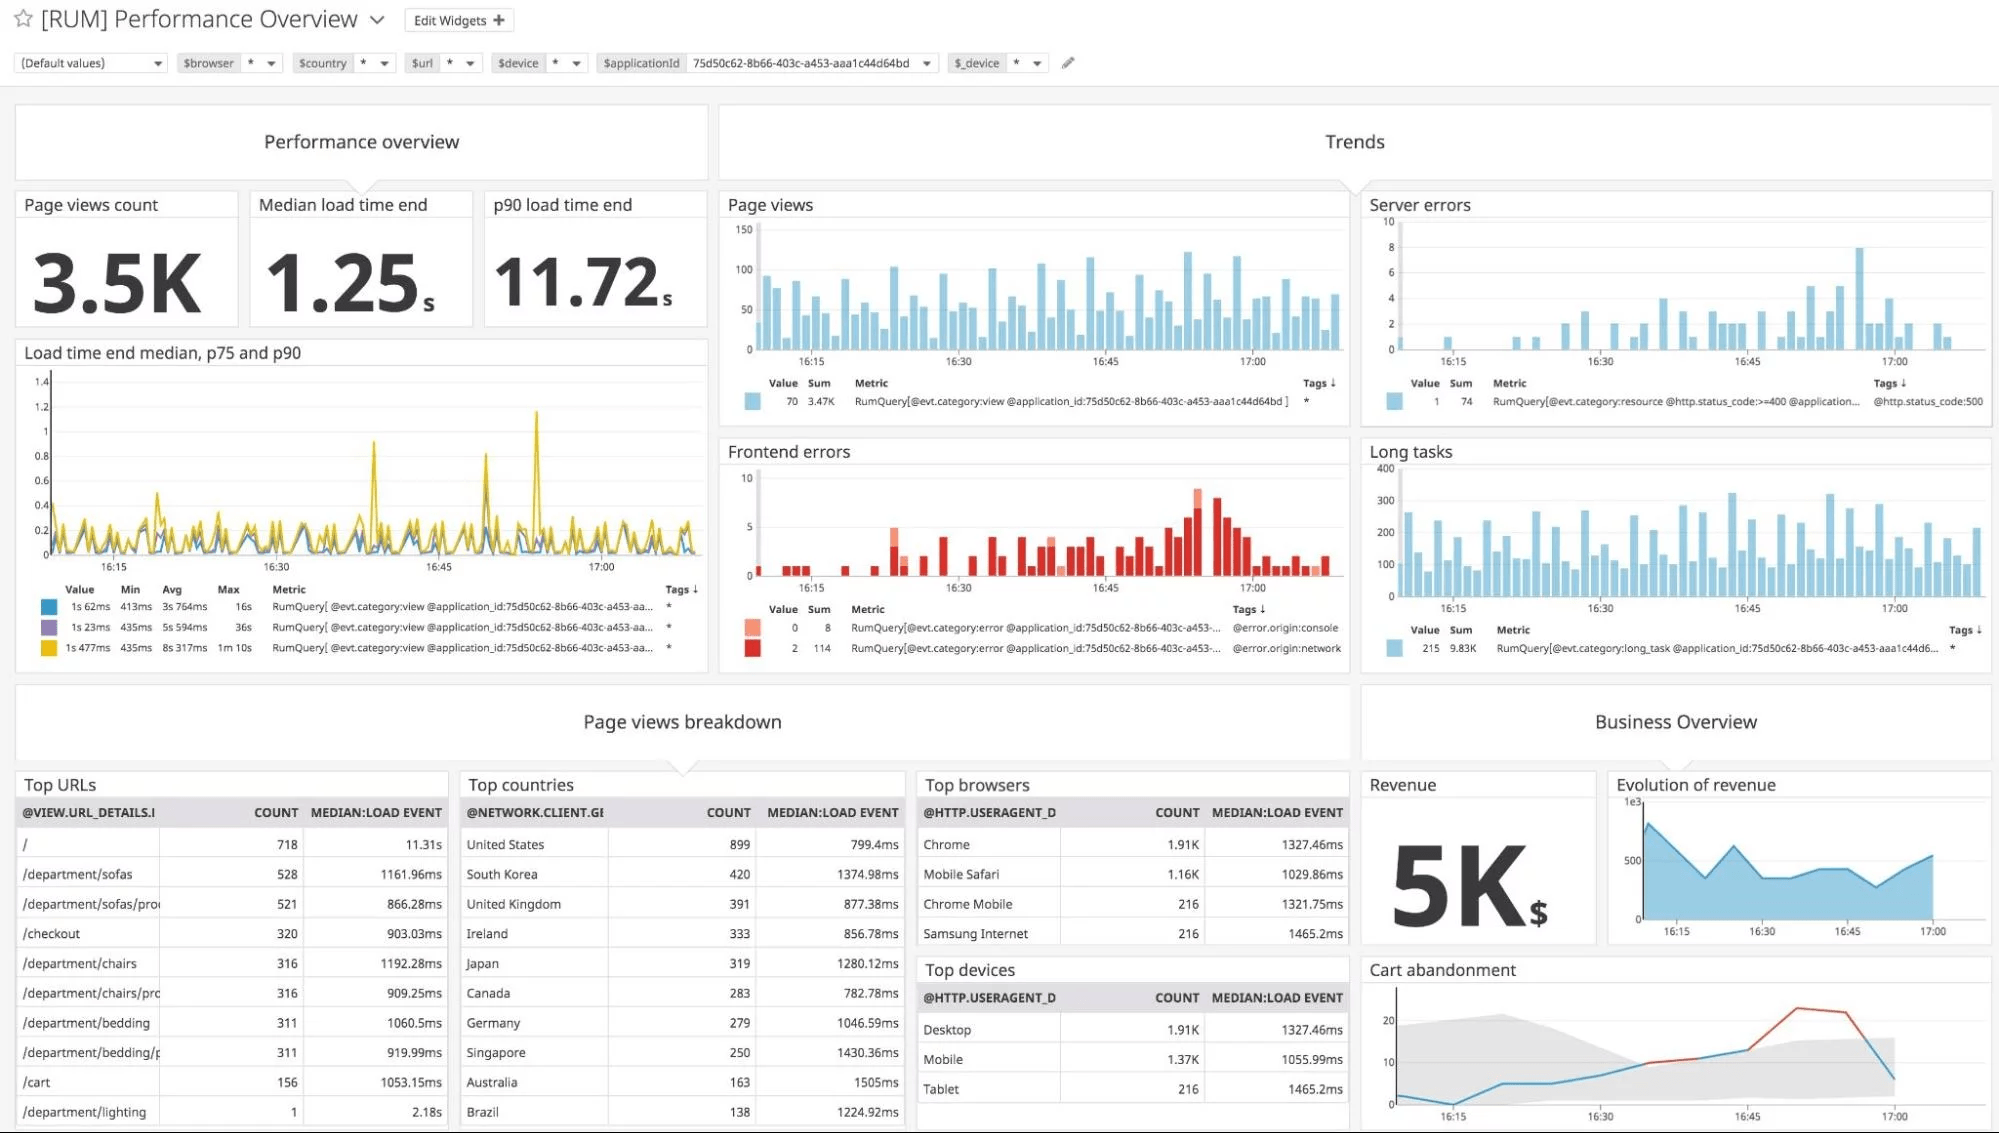
Datadog is a cloud-based software that monitors all the system metrics you need to assess the health of your application stack, such as containers and virtualization platforms. The Datadog open-source agent supports more than 450 integrations, including Kubernetes, Docker, and Apache Kafka.
Datadog covers all relevant security and system monitoring metrics and logs, and you can use the Datadog API to integrate with the rest of your environment. You can also search, filter, slice, and analyze logs and other metrics to get an actionable picture of system health, as well as quickly troubleshoot detected issues.
Pros
- Automatically detects anomalies and generates intelligent alerts
- Unified monitoring experience across cloud and on-premises environments
- Visualizes system topography
- Consolidated and customizable dashboards for displaying key insights about system health, including website frontend, application code, and underlying infrastructure
Cons
- Complex setup
- Steep learning curve
Pricing
You can try out Datadog with a free 14-day trial. There are three pricing tiers: Free (five hosts with 1-day metric retention), Pro ($15 per host/month), and Enterprise ($23 per host/month).
Want to see how Sematext stacks up? Check out our page on Sematext vs Datadog.
5. Site24x7 Server Monitoring
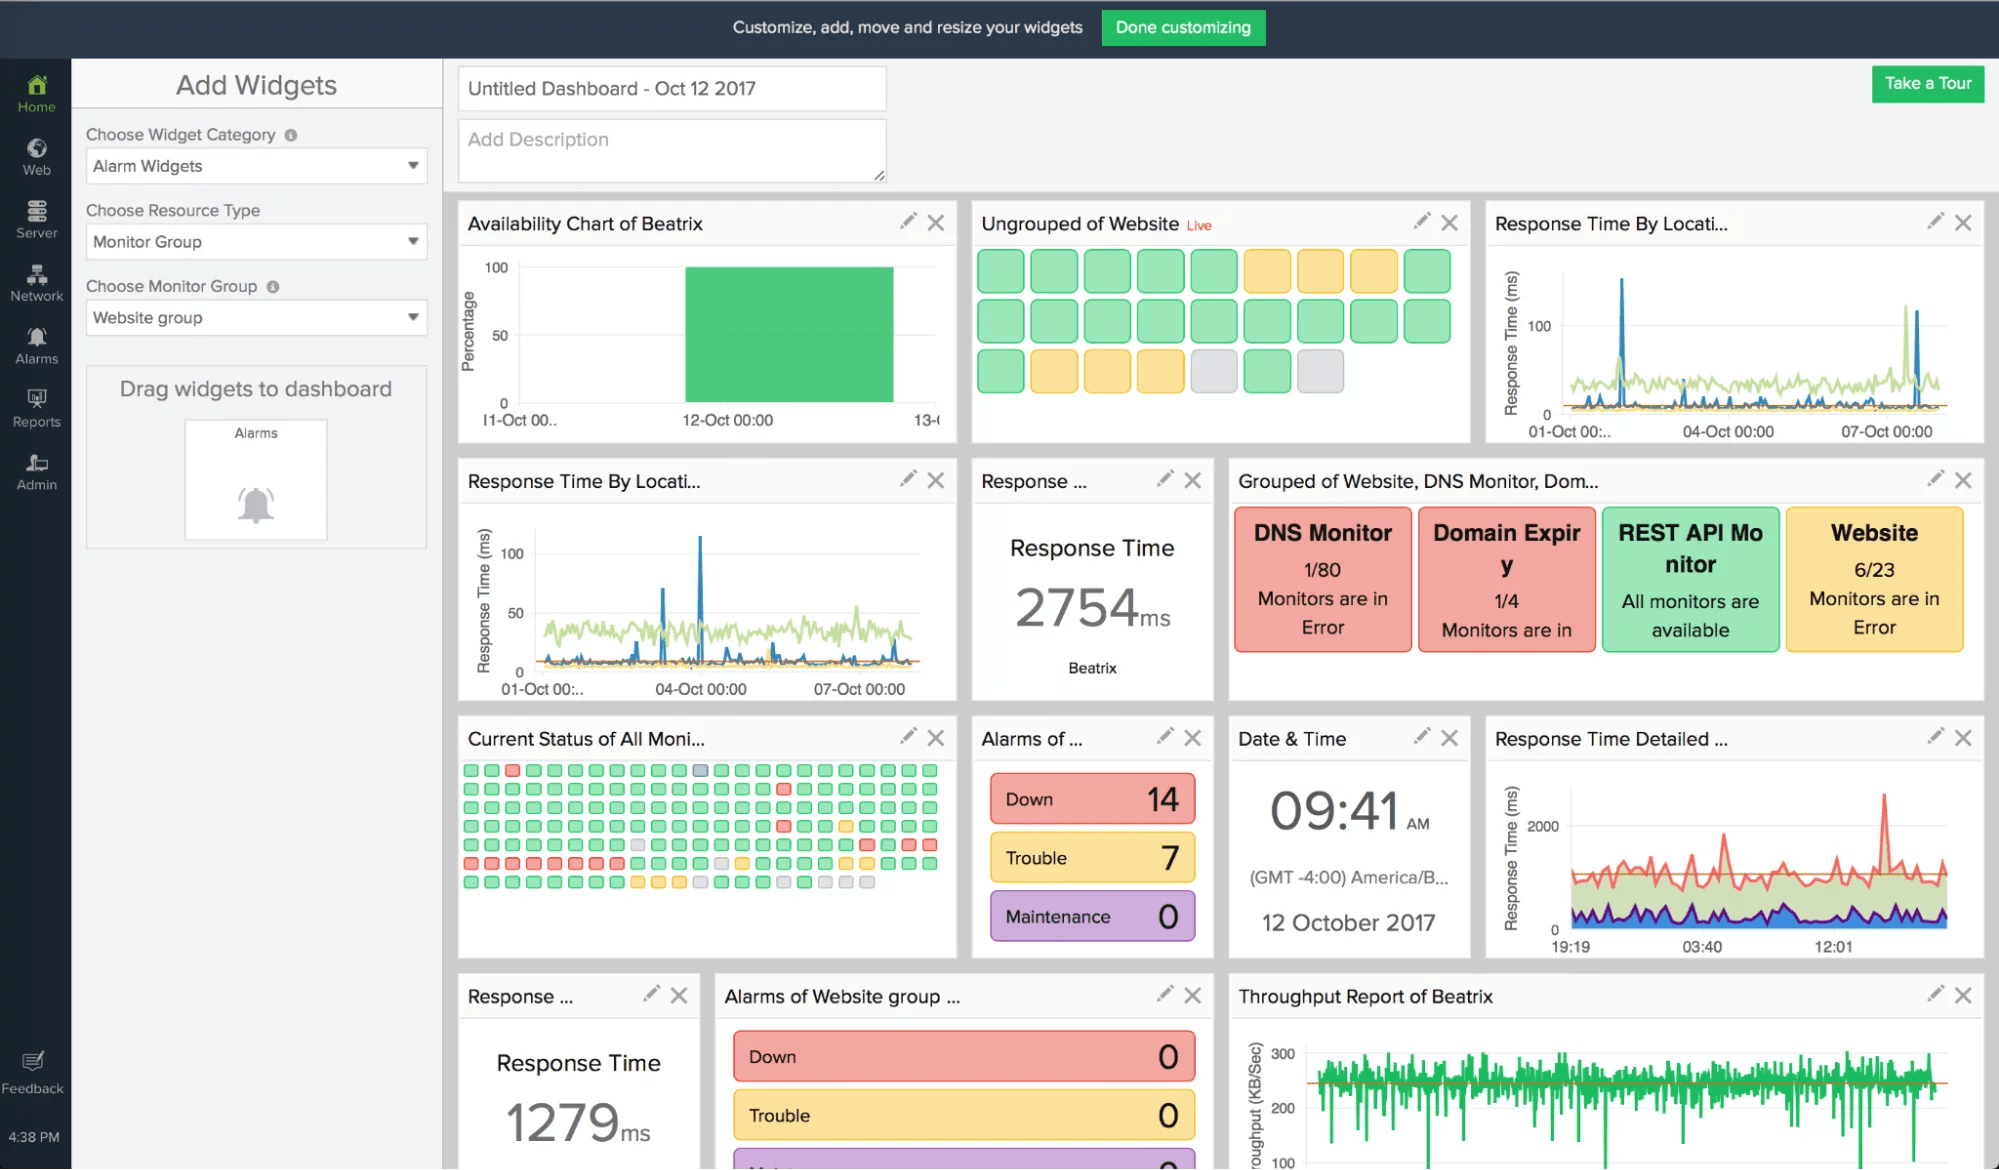
Site24x7 is an all-in-one agent-based system monitoring software that tracks metrics for servers, networks, containers, websites, applications, virtualization platforms, Docker hosts, and Kubernetes clusters. It can be deployed on-premises or in the cloud.
The tool’s dashboards visualize network information, application activity, and server metrics to give you real-time insights into system health. You can supplement the tool’s built-in monitoring capabilities with custom plugins written with Shell, PowerShell, Batch, VB, Python, and more.
Pros
- Real-time tracking of Windows/Linux services and processes, as well as cloud services and applications
- Automated discovery, mapping, and monitoring of network devices
- AI-powered application performance monitoring (APM) across the application architecture
- 100+ plugin integrations
Cons
- Complex setup
- Server monitoring limited to a few technologies
Pricing
Site24x7 offers a free 30-day trial. After that, monthly prices range from $9–$449, based on the scope of system components you want to monitor.
Want to see how Sematext stacks up? Check out our page on Sematext vs Site24x7.
6. Paessler PRTG Network Monitor
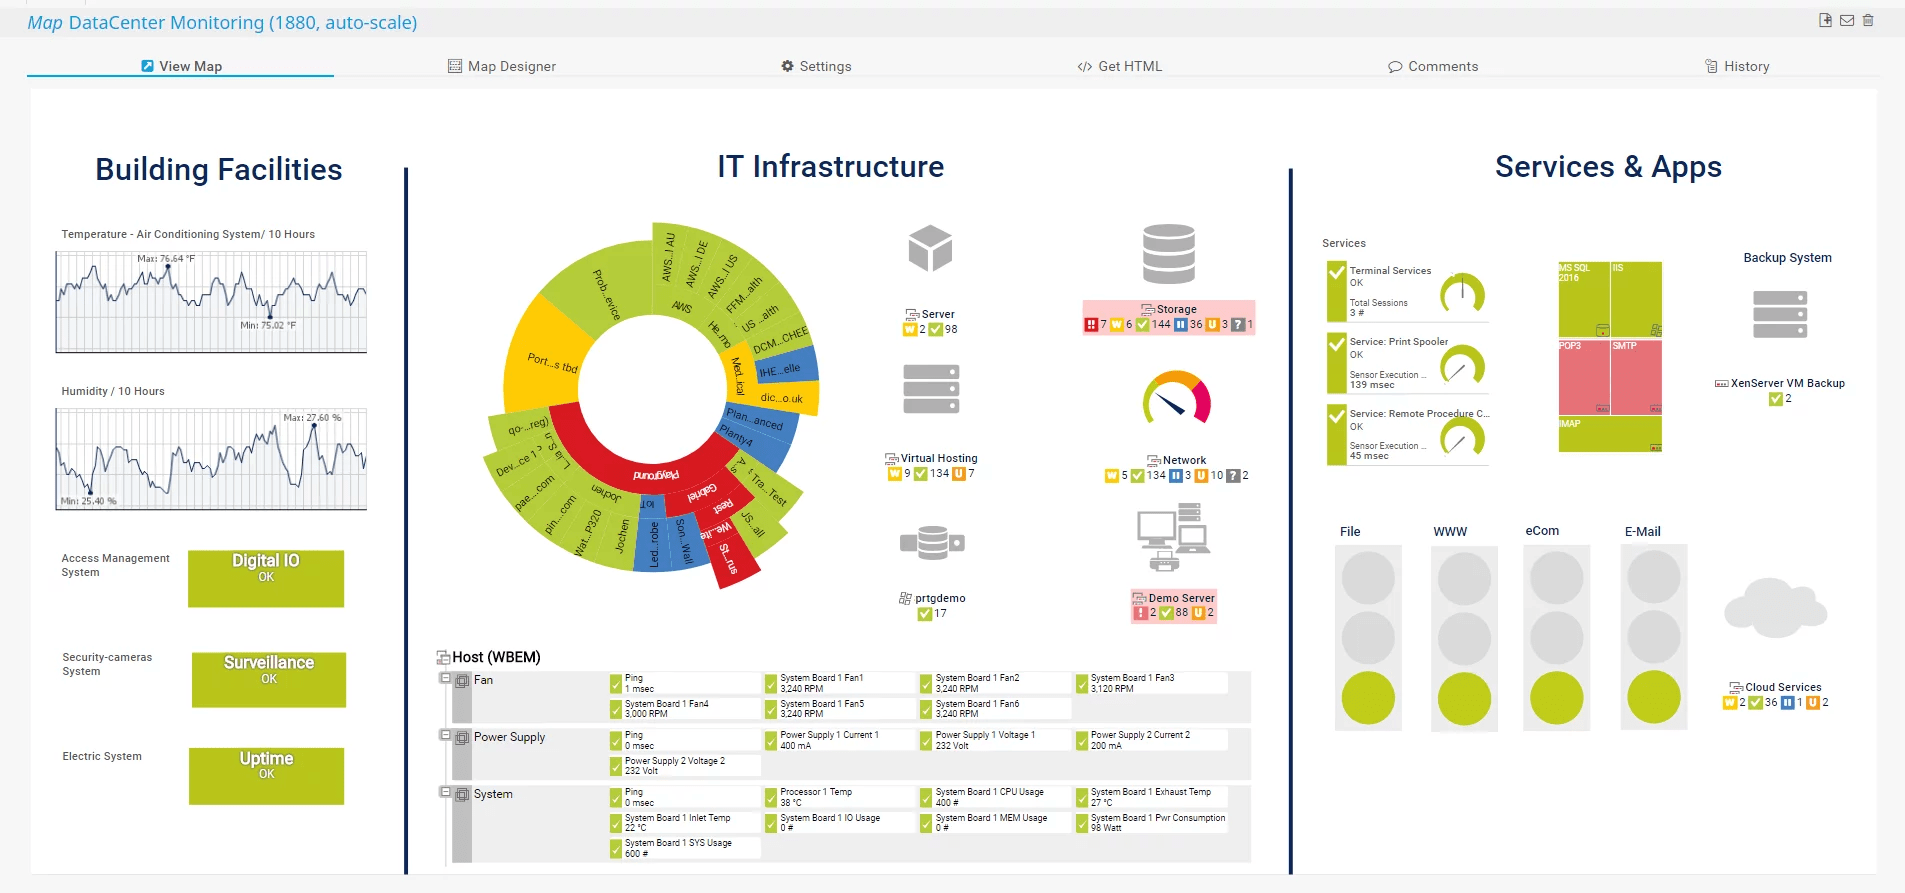
PRTG Network Monitor is a system monitoring tool that covers applications, databases, networks, servers, and virtual machines. It offers you both agent-based and agentless monitoring and can be installed locally or hosted.
With PRTG’s dashboard, you get a centralized and consolidated view of alerts, outages, and warnings. Sensors intuitively track all the system elements involved in specific business processes. PRTG’s infrastructure monitoring tool detects bottlenecks to optimize system capacity.
Pros
- Simple and quick setup
- Network and its connected components automatically visualized by map designer
- Ready-to-use and user-built reports to highlight performance issues
- Flexible alerts delivered across multiple channels
Cons
- No native support for Linux
- Licensing model (based on sensors) can be costly at scale
Pricing
There is a 30-day free trial, after which prices start at $1,750 for 500 sensors. PRTG also offers a perpetual payment license with a renewable maintenance and support plan.
7. ManageEngine Applications Manager
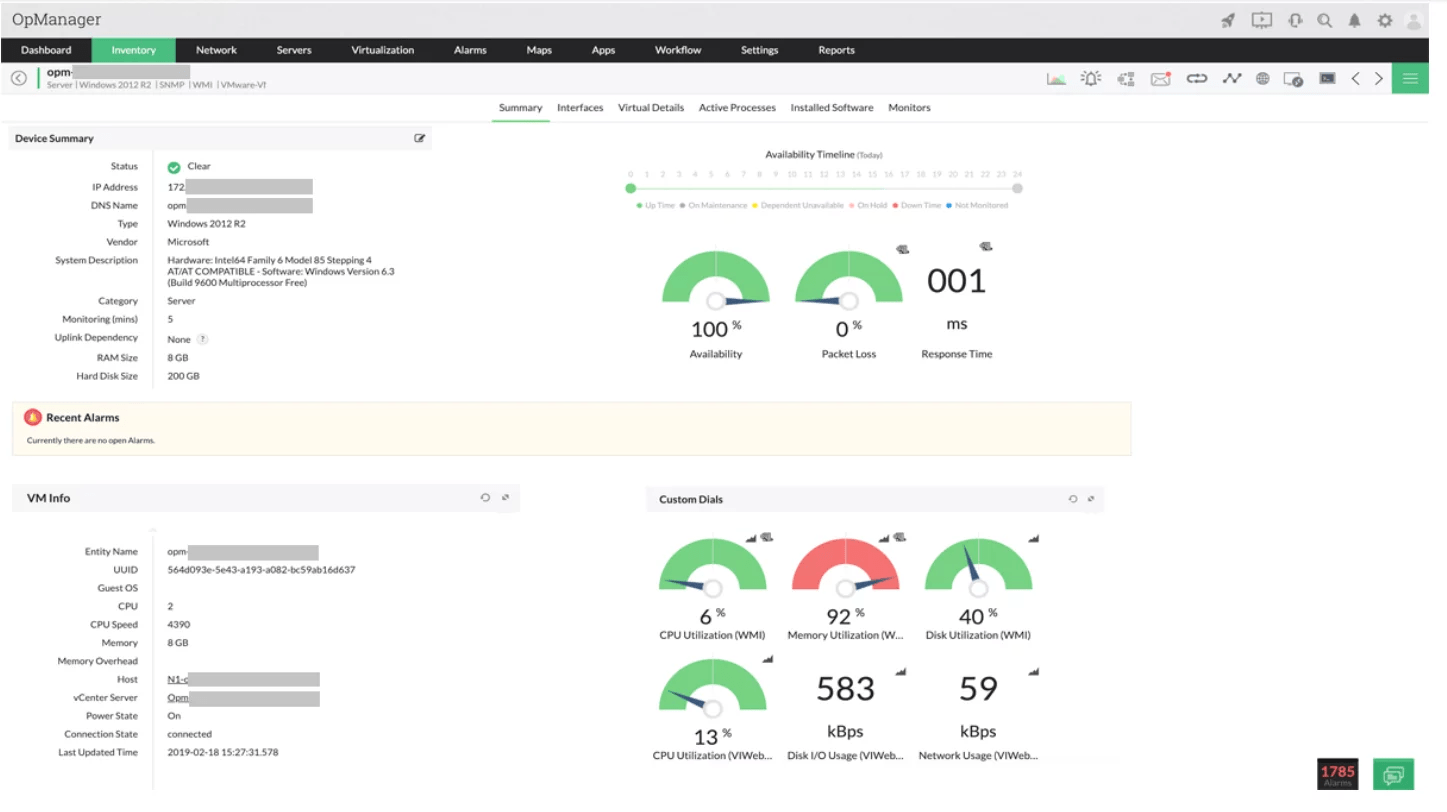
ManageEngine is a suite of enterprise-grade system monitoring and management software for real-time monitoring of networks, physical and virtual servers, endpoints (desktops, mobile devices, etc.), storage devices, applications, and more. With customizable dashboards and over 200 performance widgets, ManageEngine gives you a comprehensive view of overall system performance, along with smart alerts for quick root-cause analysis and self-healing automated actions.
With Applications Manager, you get real-time visibility into web application performance and UX across multi-cloud environments, including synthetic monitoring of business-critical transactions, monitoring/troubleshooting of physical and virtual server health and performance, container and database monitoring, and more.
Pros
- Automated and dynamic discovery and mapping of dependencies
- Advanced analytics, with 500+ pre-built reports
- Process and system health monitoring through SNMP/WMI/CLI
- Agentless monitoring for VMware and WMI-based monitoring for Hyper-V
Cons
- Optimized for network monitoring, with little support for other system components
- No hosted version
Pricing
ManageEngine offers a 30-day free trial and a free version for up to three devices. Pricing is tiered by feature bundle and number of devices: Standard ($245 for 10 devices), Professional ($345 for 10 devices), and Enterprise ($11,545 for 250 devices).
8. Nagios
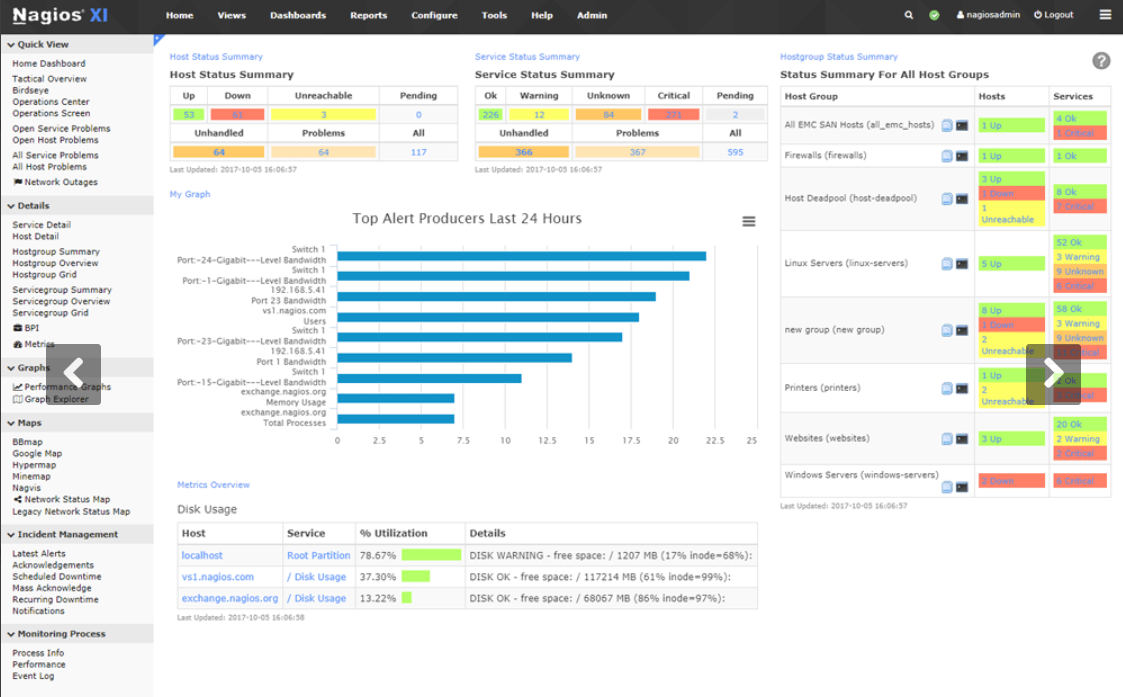
Nagios is a veteran system monitoring tool: Nagios Core is the open-source option, and Nagios XI is a commercial enterprise solution. You can use Nagios to centrally monitor networks, servers, applications, and other system components, gaining single-pane visibility into your IT environment status through a web interface.
Nagios also offers plugins that let you extend its core architecture to meet your unique system monitoring requirements. Its highly available deployment delivers continuous system monitoring.
Pros
- Extensive and extensible reporting capabilities
- Detects outages quickly, automatically issuing alerts
- Automated remediation capabilities through event handlers
- Full access to open-source code
Cons
- Free open-source version is feature-limited
- Multiple add-ons required for full capabilities
Pricing
Nagios Core is free. There are two versions of Nagios XI: Standard (starting at $1,995 per 100 nodes) and Enterprise (starting at $3,495).
9. Zabbix
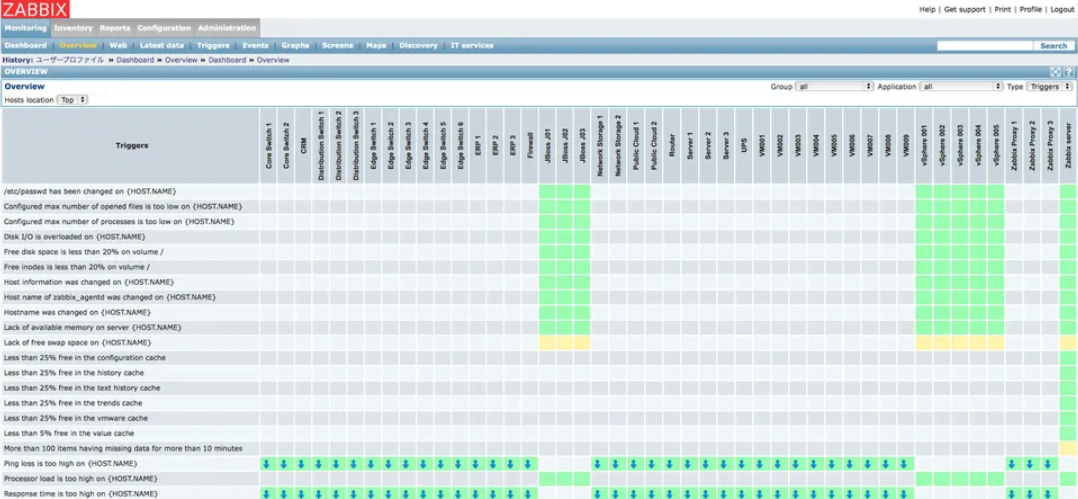
Zabbix is a versatile and popular open-source system monitoring tool that collects, aggregates, and analyzes metrics from networks, servers/VMs, clouds, applications, services, databases, and more. Its extensive visualizations give you insights into your system’s health, and out-of-the-box or user-customized templates automate the discovery of components to be monitored.
Zabbix’s lightweight and versatile metric collection agent is centrally managed from the Zabbix server. You will also benefit from Zabbix’s strong open-source community and commercial support.
Pros
- Easy API-based integration with existing applications
- Automatically detects anomalies and predicts trends using smart flexible thresholds
- Classifies detected problems for smarter alerting and accelerated root-cause analysis
- Single-pane visibility, with configurable dashboards, graphs, and reports
Cons
- Complex deployment and configuration
- No hosted solution
Pricing
Zabbix is open source and free, but you can supplement it with paid services, such as technical support, consulting, and upgrade/template-building support.
10. NinjaOne
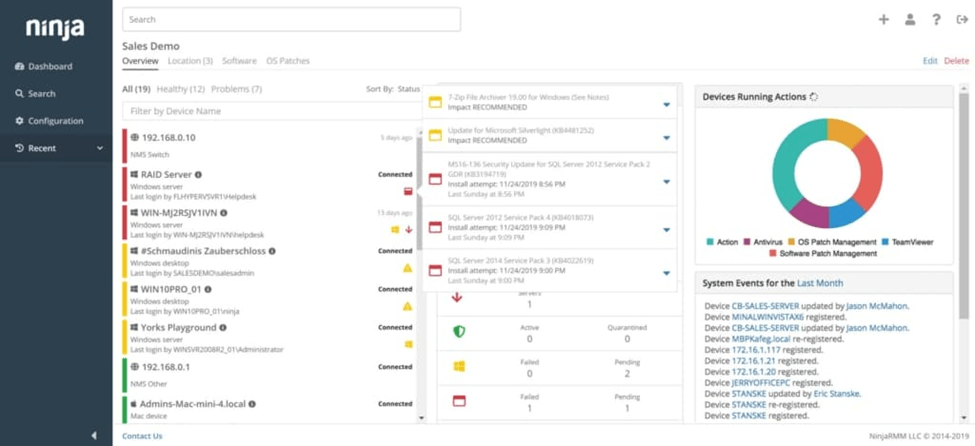
NinjaOne (formerly NinjaRMM) is an agent-based SaaS framework for remote monitoring and management of networks, endpoints, software, and other system resources. It can integrate with third-party tools to further enhance its capabilities. NinjaOne is suitable for organizations of all sizes, from managed service providers (MSPs) and other IT service businesses, to IT departments at SMB/mid-market companies.
NinjaOne automatically scans networks to log all connected devices and apps and maintain full hardware and software inventories. Its modules include a network traffic monitor, as well as device status and resource usage supervisors. It also standardizes and automates device deployment, configuration, management, and remediation processes.
Pros
- Ticketing system supports well-managed coordinated incident responses
- End-to-end centralized system monitoring with customized threshold-based alerts
- Monitors and secures endpoints, including a managed antivirus solution
- Cloud-native automated OS patching for Windows, Linux, and MacOS endpoints, as well as for 135+ applications
Cons
- Doesn’t support Linux devices
- Hard-to-navigate user interface
Pricing
NinjaOne offers a free trial. After that, it is priced per-device, based on the features you need. There is no published price list, so you’ll need to request a quote.
11. Spiceworks
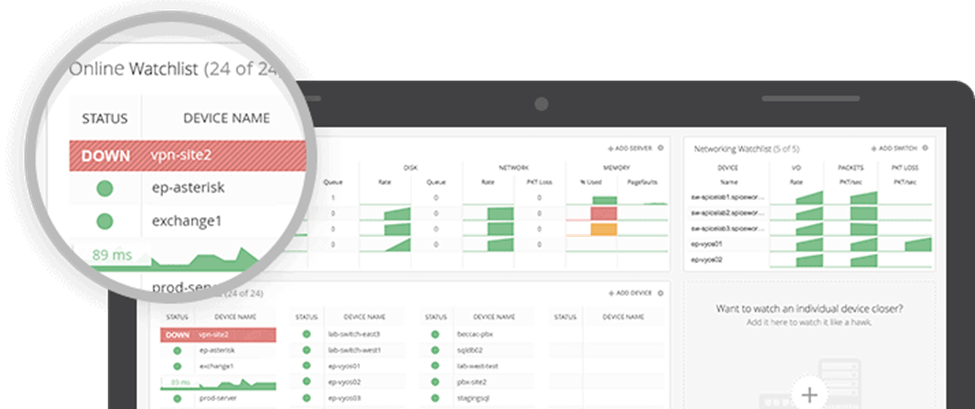
Spiceworks is a system performance monitoring software that monitors Windows environments in real time. With an easy-to-use interface, it’s optimal for companies that are monitoring up to 25 network-attached devices. Threshold-based customizable alerts quickly highlight system and device issues so that you can fix them before they cause end-user problems.
Spiceworks allows you to create network maps and drill down easily into node information. You can also use it to discover and manage cloud services, including those provisioned by shadow IT.
Pros
- Simple to install and set up
- Continuous verification that IP devices are online and responding
- Advanced network troubleshooting tools, such as IP Lookup, Website Down Checker, and Subnet Calculator
- Keeps you audit ready, with centralized tracking of software status, including licenses
Cons
- Complicated reporting
- Only offers basic automation
Pricing
Spiceworks is completely free, although some users complain about the ads.
What Is the Best System Monitoring Tool for You?
Here are some of the minimum requirements you should look for when choosing a system monitoring software:
- Support for complex environments: Your system monitoring tool must be able to monitor highly distributed applications, ephemeral components, and diverse hosts and devices across multiple public and private clouds and networks.
- Centralized management of metrics and insights: You need a reliable and easy-to-parse picture of system health, performance, and integrity. AI-powered analytics and strong visualizations in a consolidated dashboard can give you this.
- Notifications and alerts: The solution you choose must be able to detect anomalous system behavior anywhere in the stack that is, or could be, detrimental to system performance. It should also be able to notify the right personnel in real time.
- High levels of automation: Your system monitoring tool should be able to automatically open tickets with detailed information on system activities that led to a detected issue, as well as trigger automated workflows that mitigate, or even fix, the problem, such as shutting down a compromised service or deploying a patch. It should also be able to carry out preventive maintenance with little or no human intervention.
- Scalability and flexible pricing: Your solution should make it easy for you to scale up or down in response to dynamic system requirements—and to adjust pricing accordingly.
- Reporting: To help with budget and capacity planning, as well as compliance auditing, choose a tool that comes with a set of informative historical and real-time reports. Since every system is different, these reports should be customizable.
Conclusion
Today’s complex IT environments consist of intertwined layers of infrastructure and firmware, applications and services, and user software. Each layer generates its own metrics, which makes it critical to have good system monitoring tools, such as Sematext, in place. That way, everybody wins. Customers, employees, and partners will enjoy high-performing and always-available apps; DevOps will be able to debug and remediate system performance issues quickly and efficiently; security will rest easy knowing that all system assets and their dependencies are visible and properly configured, and lines of business will get maximum ROI on their products and services.
To see for yourself how Sematext’s industry-leading system performance monitoring software can help your organization, start a free trial today.
You might also be interested in:
Author Bio

Sunny Srinidhi
Sunny has been working in the data space for over seven years. He writes microservices to work with data at scale and has experience using a variety of databases, including MySQL, MongoDB, DynamoDB, Couchbase, Amazon Athena, and Apache HBase. He is currently working on a Customer 360 product that is intelligently unifying customer data from multiple sources at scale.