Following the addition of a bunch of new Kubernetes monitoring reports regarding our Kubernetes Monitoring integration, we are happy to introduce our newly revamped Kubernetes Overview. It features a fresh look and is packed with valuable information for fast troubleshooting and quick identification of potential issues within your Kubernetes environment.

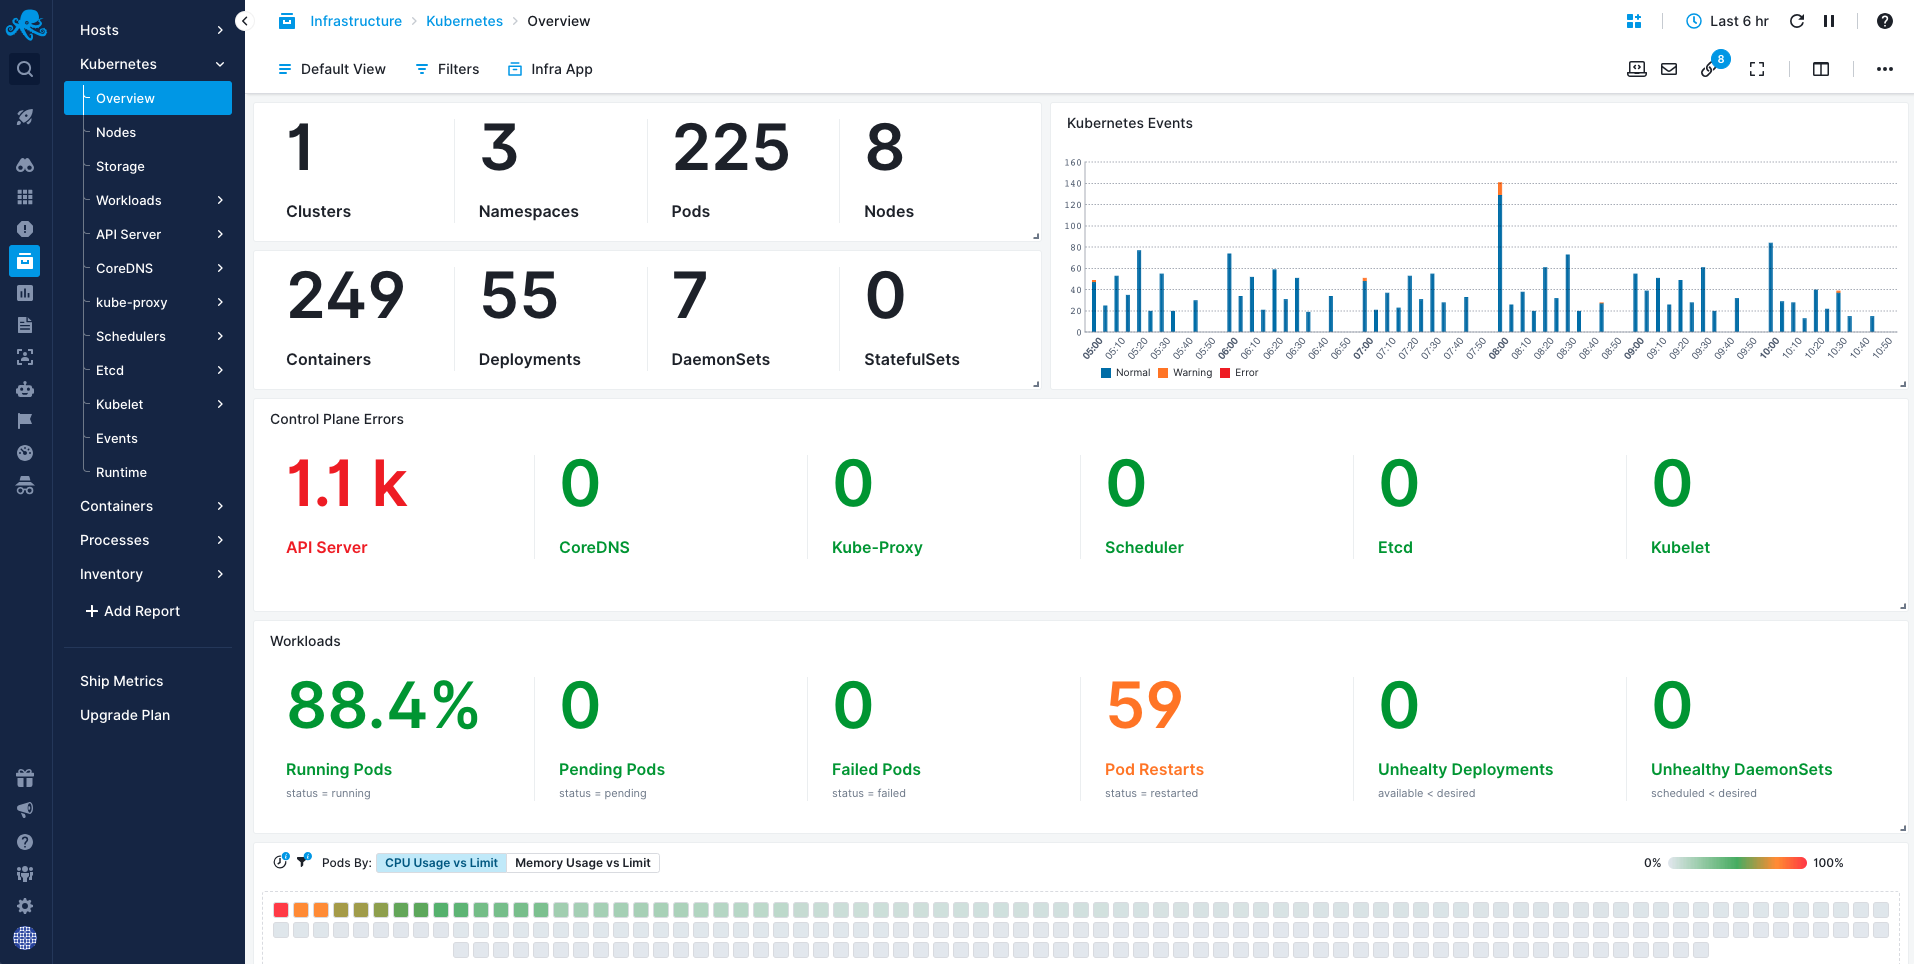
The page is organized into distinct sections allowing you to get a quick overall view of the current status of your Kubernetes environment.
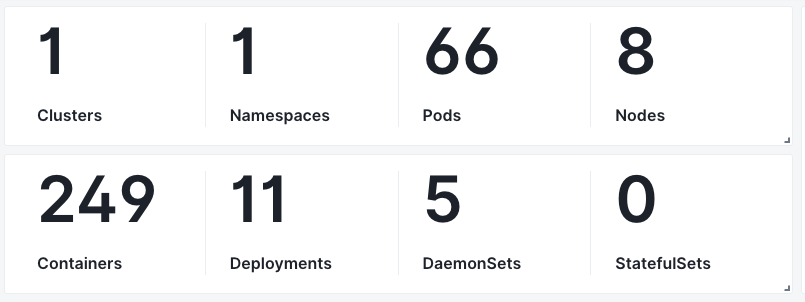
At the top of the page, you will find an overview of all your Kubernetes resources. This includes a summary of the total number of clusters, namespaces, Pods, Nodes, Containers, DaemonSets and StatefulSets. You can filter everything shown on this page by any of the above resources, enabling you to limit the scope of your observations.
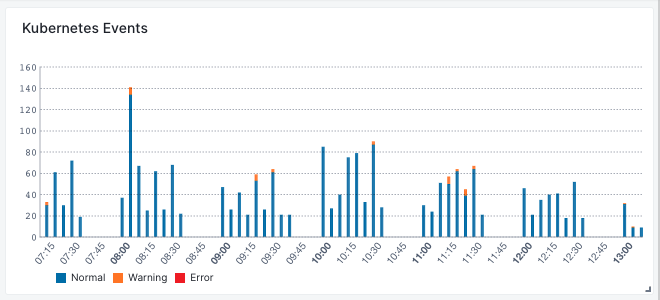
In the top-right corner of the page, you’ll find a chart with the distribution of all Kubernetes events, coloured by severity, within your selected time range. This is really useful to quickly pinpoint when an incident happened.
Moving on, we provide a panel that displays Control Plane component errors. This panel covers errors related to the API Server, CoreDNS, kube-proxy, Scheduler, Etcd and Kubelet. Given the wide range of errors that can be recorded in a Kubernetes cluster, this panel serves as the fastest way to understand the events that occurred. You can then visit the individual Control Plane component dashboards to access more detailed information.
Directly below, you’ll find an information panel dedicated to Kubernetes Workloads. This section includes the health status of Pods, Deployments, and DaemonSets. It is a valuable starting point for troubleshooting problematic Pods. Additionally, the various representations in the Pods heatmap below the Workloads panel let you drill into the details of each and every Pod.
Last but not least, there is a panel with all node conditions, offering a quick view of your node’s statuses.
For more information, please refer to Kubernetes Monitoring Integration and don’t forget to update to the latest version of Sematext Agent.


