When an application written for the Java Virtual Machine is running, it constantly creates new objects and puts them on the heap. Well, at least in the vast majority of the cases. Such objects can have a longer or shorter life, but at some point, they stopped being referenced from the code. Unlike languages like C/C++, we don’t have exact control over when the memory will be freed – freeing the memory is the garbage collector’s job. This is why the garbage collector’s performance is one of the crucial JVM metrics for the overall performance of the applications running inside the Java Virtual Machine.
To fully understand the garbage collector’s work, we need two things – the metrics that describe how and when it was running and the logs that tell you what was happening exactly. Having full visibility into both metrics and logs of the garbage collector gives you the necessary information to understand what is happening and react to that, to do garbage collector tuning.
There are tools that can enable you to analyze the garbage collector logs. Nothing is available out of the box in the standard Java Virtual Machine distribution, though.
To help you get started, in this blog post, we’ll review some of the best GC log analyzers out there.
GC Log Analysis Approaches: Logging, APM & Observability Tools
When it comes to the analysis of Java Virtual Machine Garbage Collector behavior, you take different approaches.
The first approach is to use the garbage collector tool that is dedicated to analyzing the logs and does only that. Such tools, like the GCPlot that we will be looking at later, are great for analyzing the logs. However, in the majority of cases, you won’t use them daily. You will use them for troubleshooting and tuning purposes, though.
The second type of tool is dedicated to logging centralization with the support of the garbage collection logs. Such solutions, like Sematext Logs, parse logs are parsed, and you can use the information provided to get insights on what is happening inside your garbage collector when it does its job.
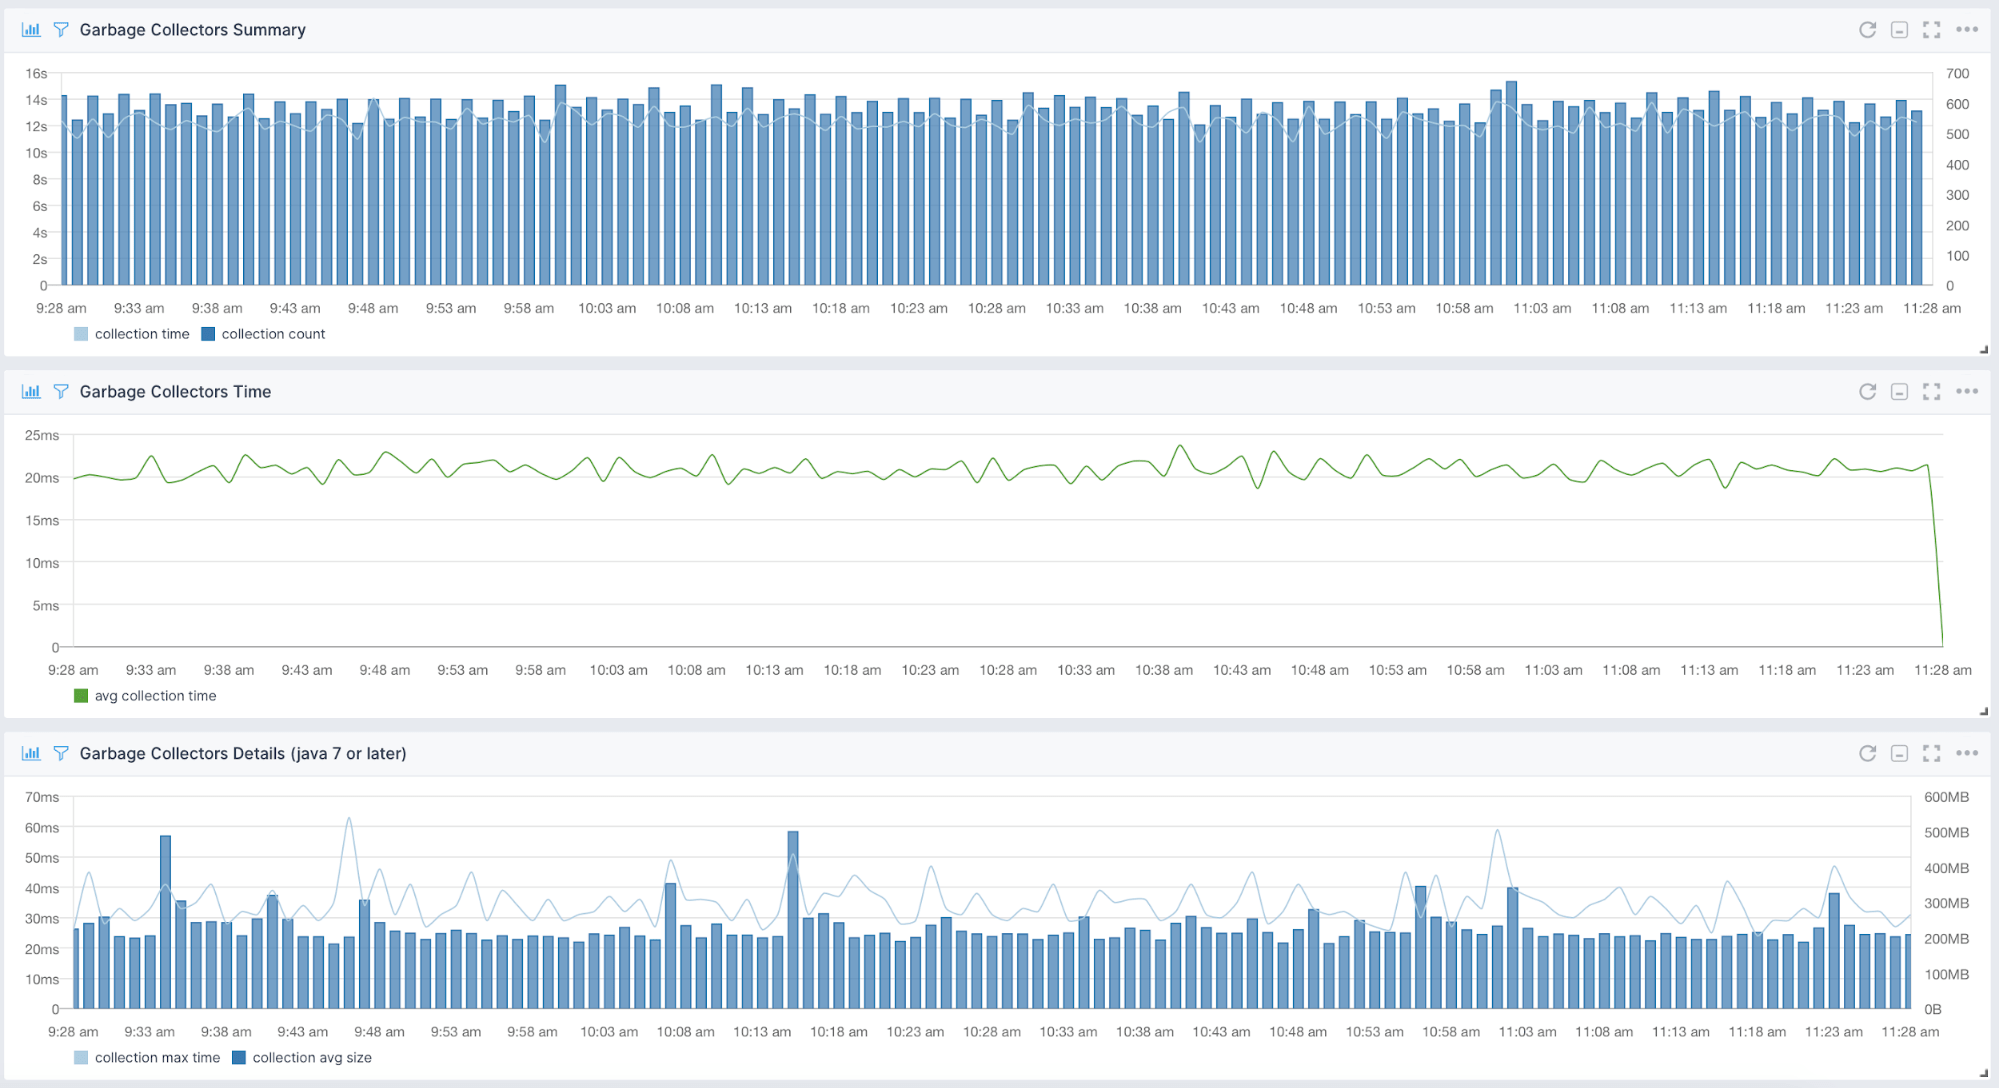
Finally, the third type of tool is the monitoring one. A Java Virtual Machine Monitoring tool like this should give you an overview of how the garbage collector works, the times, collection count, the maximum collection time, and the average collection size. In most cases, this is more than enough to spot issues with the garbage collection without going deep into the logs and analyzing them. An example can be the Sematext JVM Monitoring provided by Sematext Cloud.
Top Java GC Log Analyzers
In real-world scenarios, you want to have a tool that does everything mentioned above and, at the same time, enables log analysis with detailed reports and real-time monitoring with history and post-mortem analysis support. Let’s look at what tools can give the most when it comes to Garbage Collection logs analysis.
1. Sematext Logs
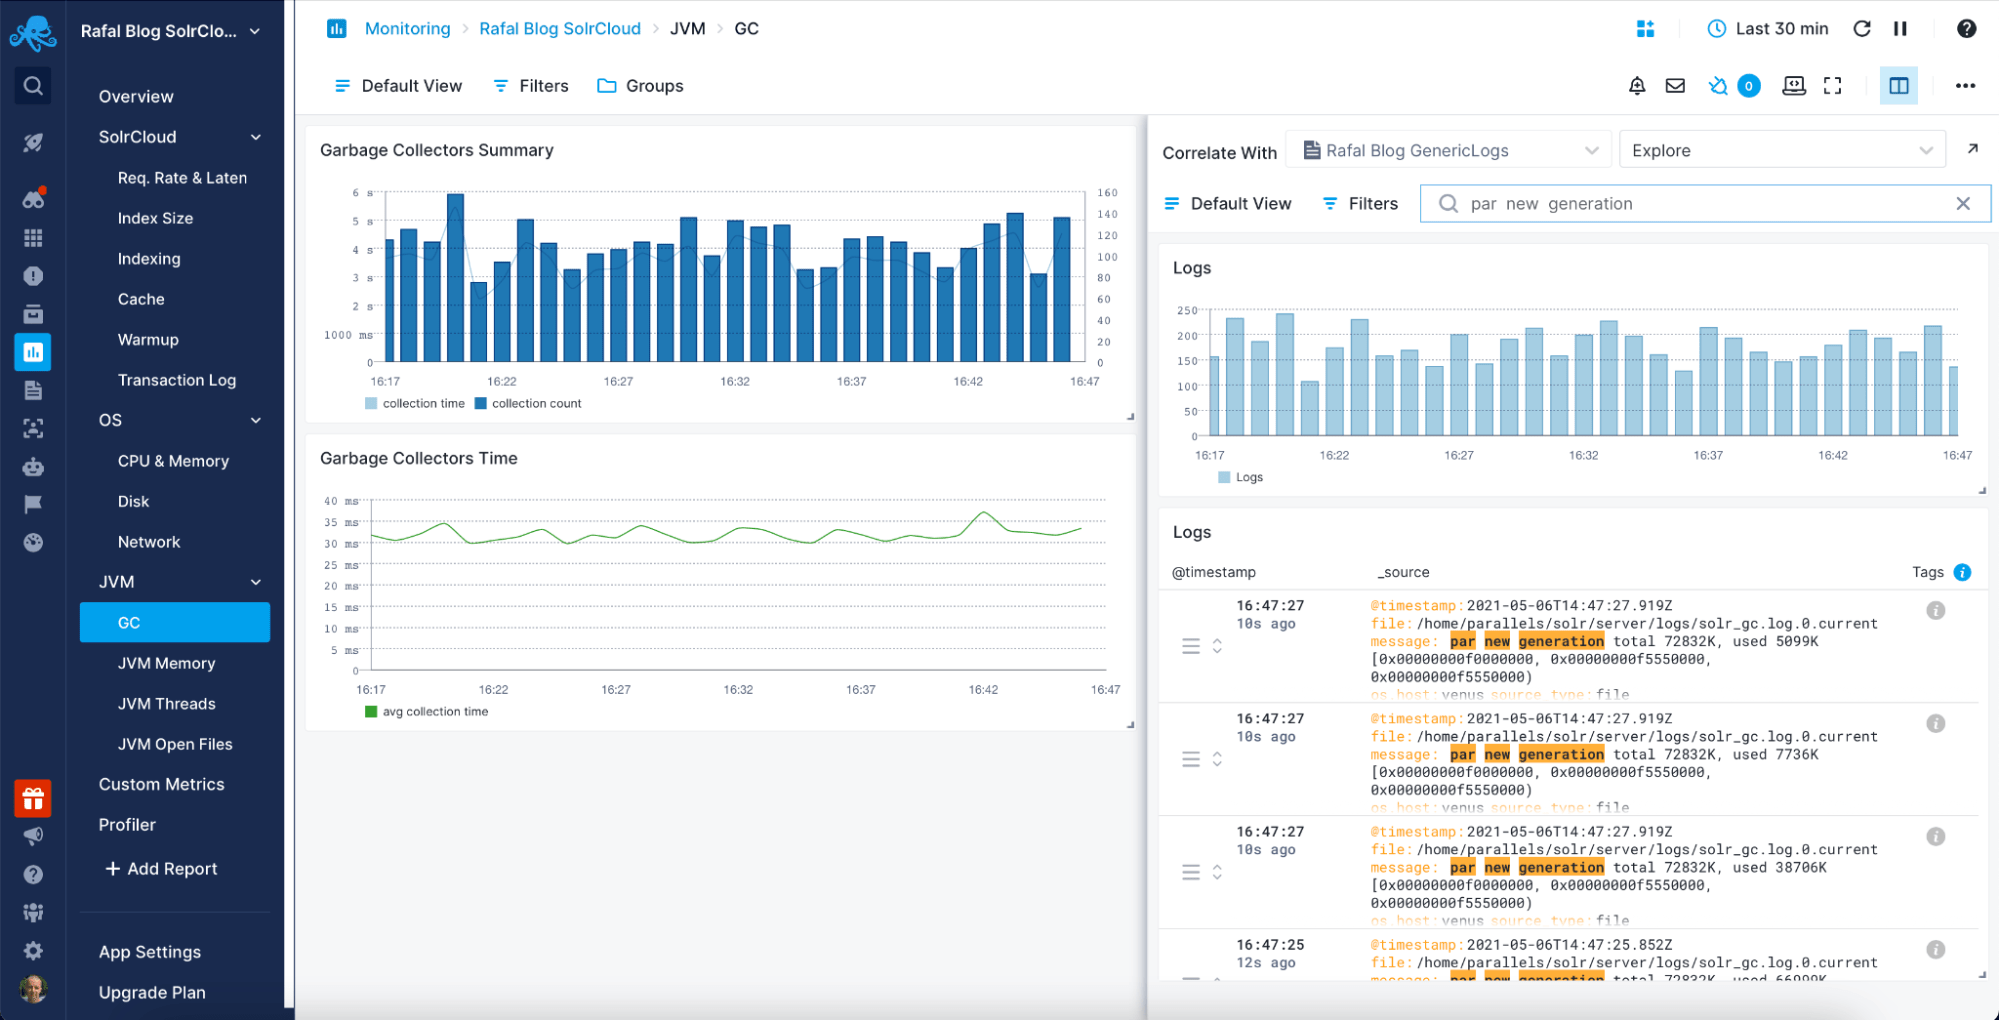
Sematext Logs is a logs centralization solution aimed at various logs-centric use-cases. Shipping your garbage collector logs is as easy as using the automatic logs discovery functionality from Sematext Agent and analyzing the data that will be in your Sematext Logs App in no time. Your logs will be automatically parsed and read for being used.
Use the shipped data to create rich dashboards, use alerting on top of your JVM application garbage collector logs with anomaly detection, and be notified using your favorite ChatOps tool via Alerts Notification Hooks. Invite your teammates and give them access to the information that you want with the per-app access.
Sematext Logs is also a part of the Sematext Cloud platform, which provides Infrastructure Monitoring, Application Performance Monitoring, Real User Monitoring, and Synthetic Monitoring. Sematext Logs combined with the JVM Monitoring give you a comprehensive view of your applications running in the Java Virtual Machine environment, giving you both logs and metrics.
[review_banner cite=”G2 Reviewer – Software engineer” negative=”true”]Super straightforward insights on your logs.[/review_banner]
Sematext Logs is a SaaS platform with a basic free plan, and the log pricing is organized around the amount of data you send daily and the data retention if you are interested in the detailed pricing for Sematext Logs, head over to the pricing page.
2. GCViewer
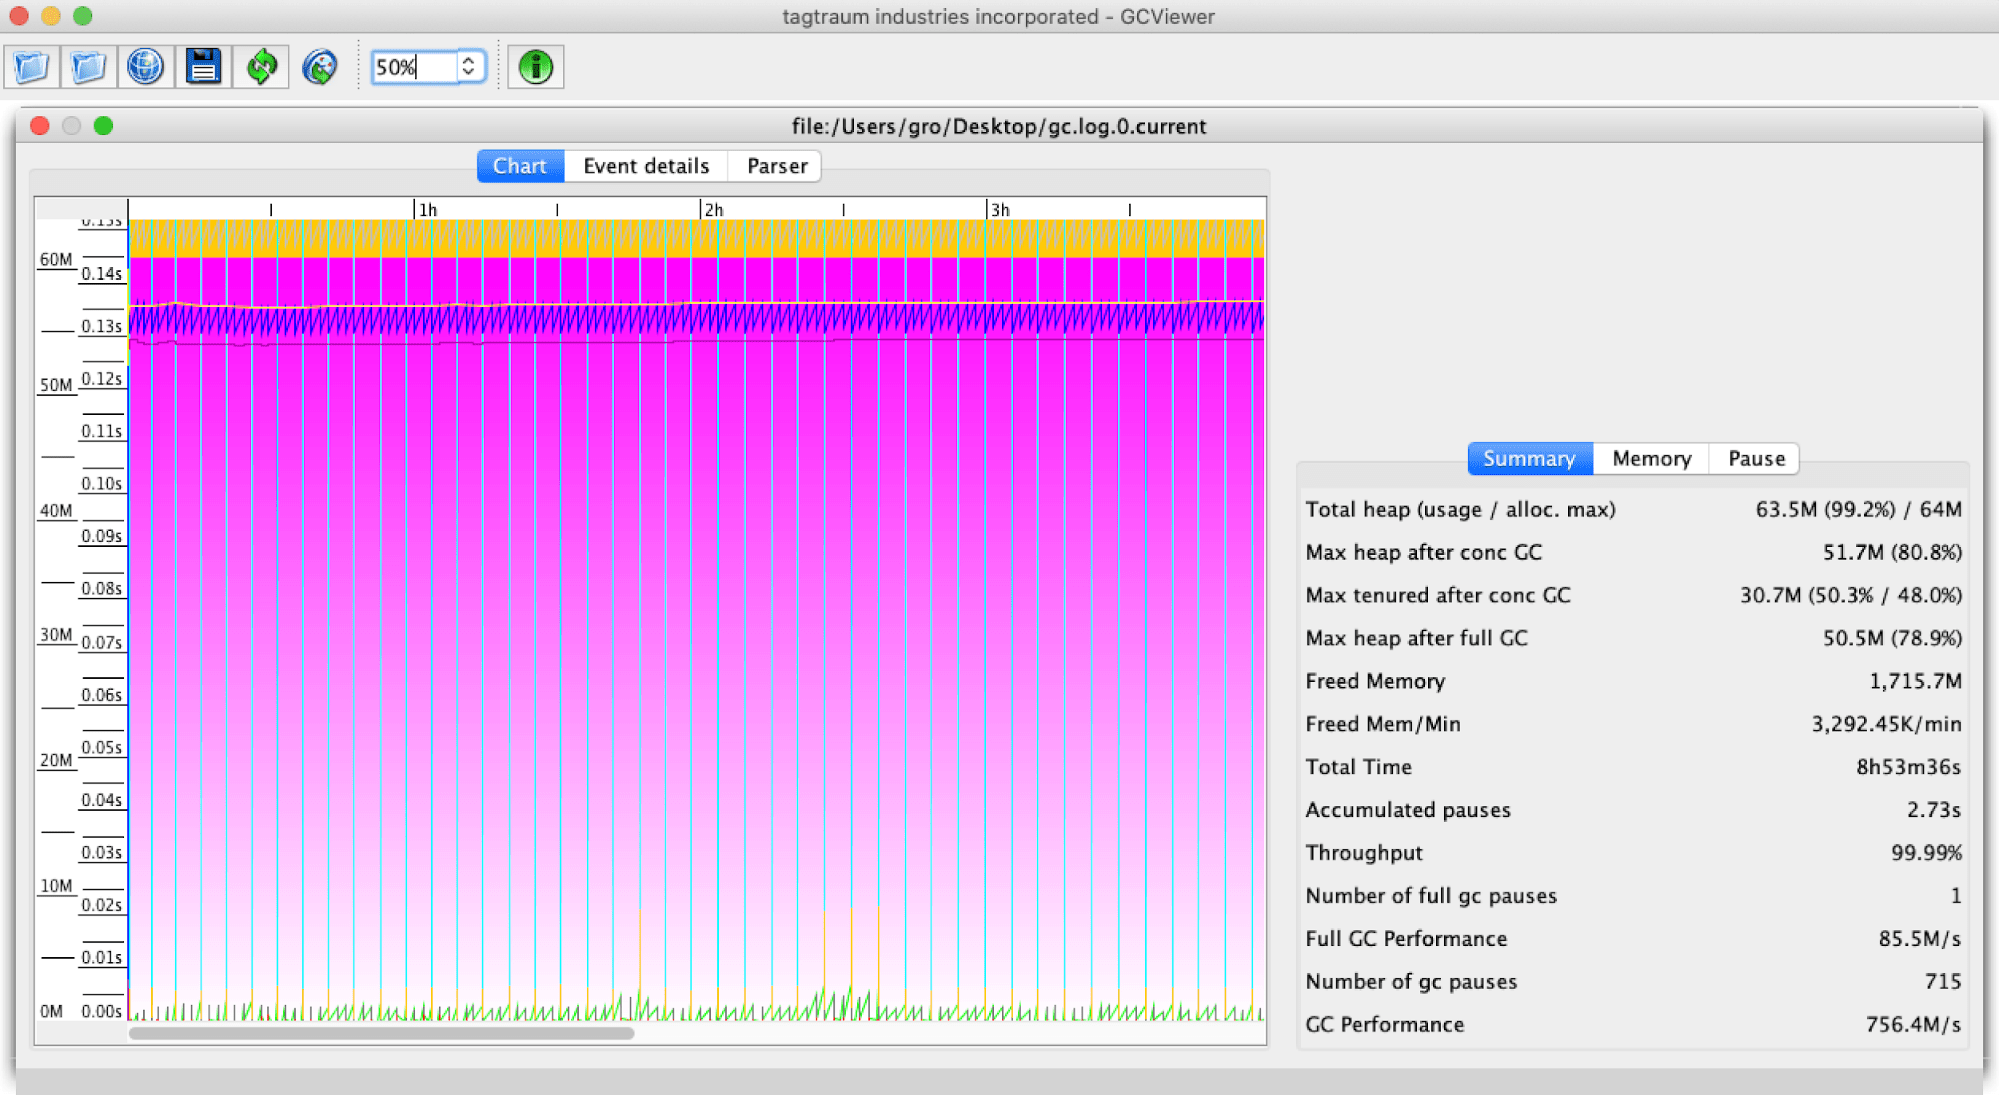
GCViewer is one of the tools that aim to help in analyzing garbage collector logs. It allows analysis of garbage collector logs up to Java 1.5, and its continuation aims to support newer Java versions and the G1 garbage collector.
The GC Viewer provides comprehensive information about memory utilization and the garbage collector process overall. It’s open-sourced and entirely free for personal and commercial use, aiming to provide support up to and including Java 8 and with unified logging for OpenJDK 9 and 10.
3. GCPlot
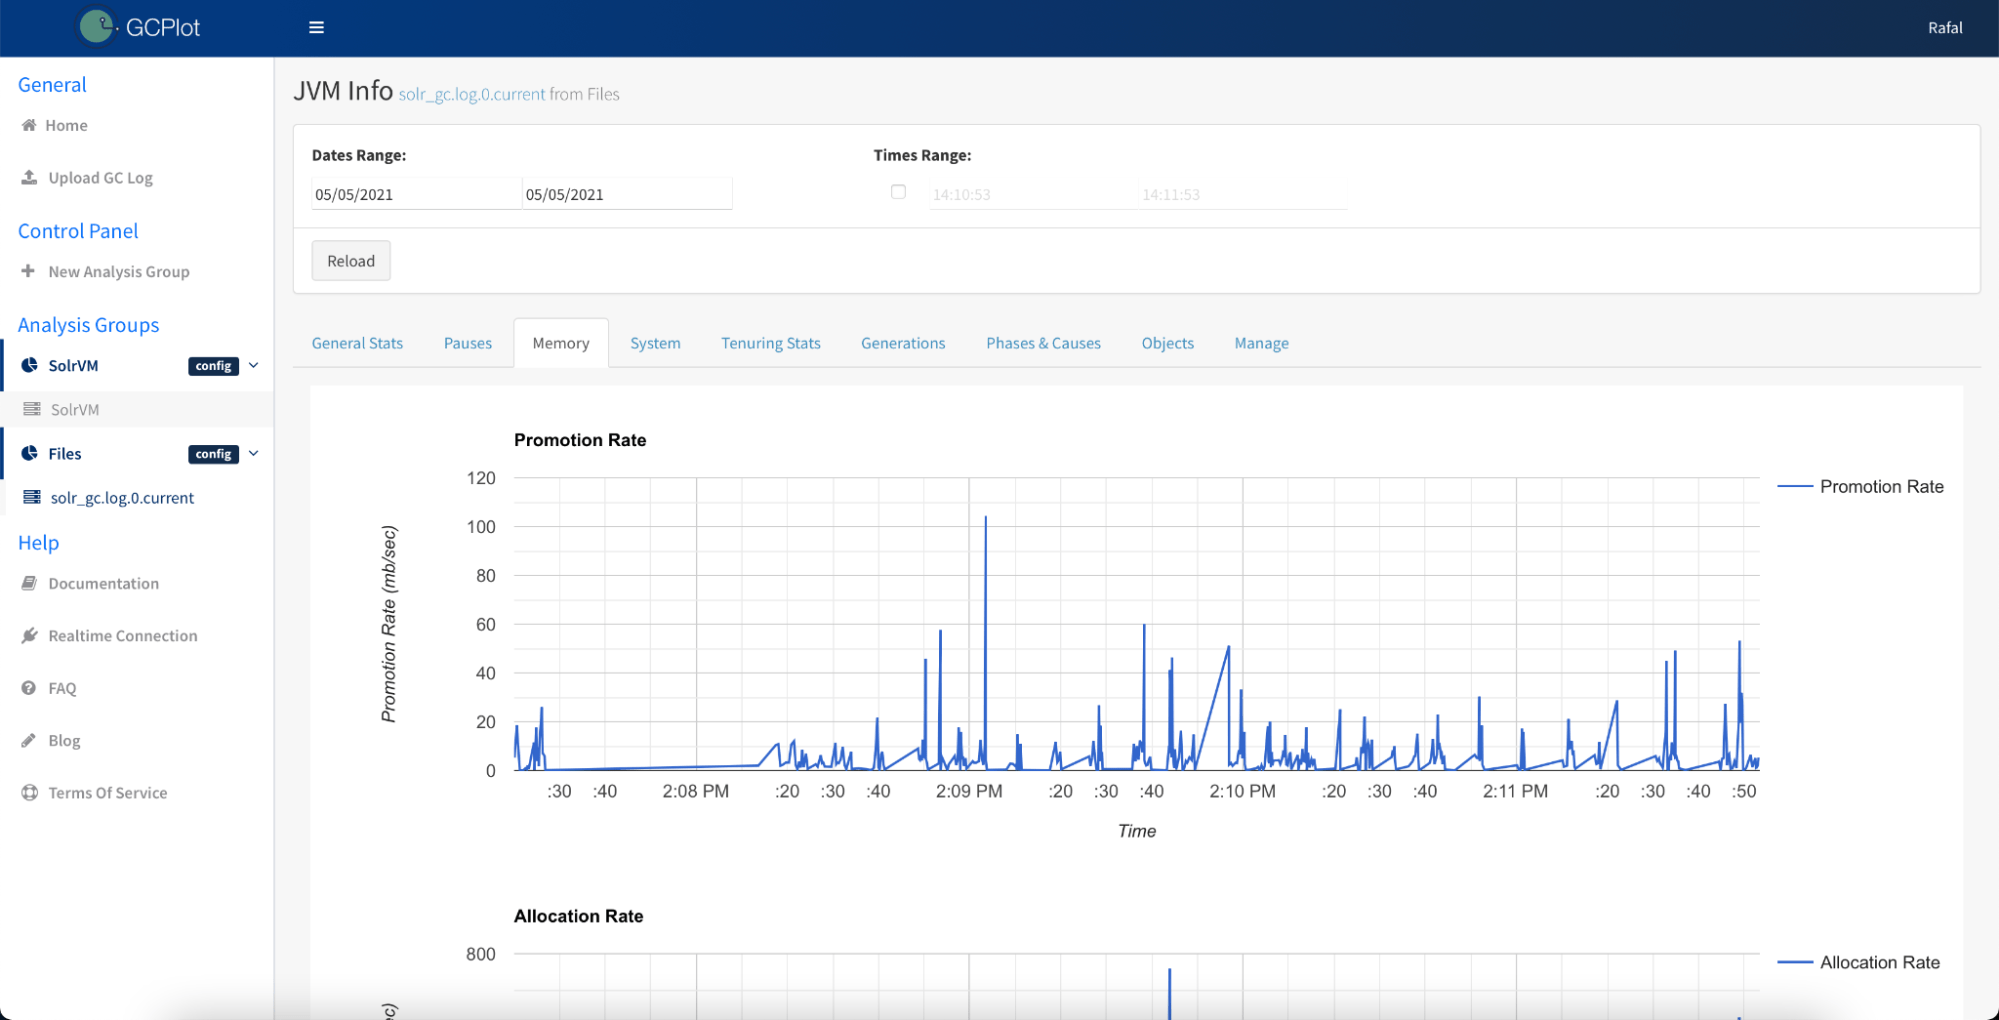
The GCPlot is a tool that allows you to analyze the garbage collector work using logs and a lightweight agent to get insightful information on what is happening inside the JVM.
After uploading the garbage collector log to GCPlot, the tool provides general JVM-related information with additional statistics available. You get data about garbage collection pauses, memory-related information with promotion and allocation rates, and the before and after garbage collector information about the young generation memory space, tenured generation memory space, and heap.
GCPlot paints a detailed picture about memory generations, including tenuring statistics and, most importantly, garbage collection phases and causes. In addition to that, you also get information about kernel and user-space timings and object creation statistics.
GCPlot allows you to define connections to multiple JVMs and take a look into the desired garbage collector metrics at any given time.
At the moment of writing, GCPlot was in transition from a cloud-based product into an open-source one. Its code is already on Github and the working version is available in the form of a Docker container. It was also able to analyze garbage collector logs for Java 9 and older.
4. IBM Garbage Collection and Memory Visualizer
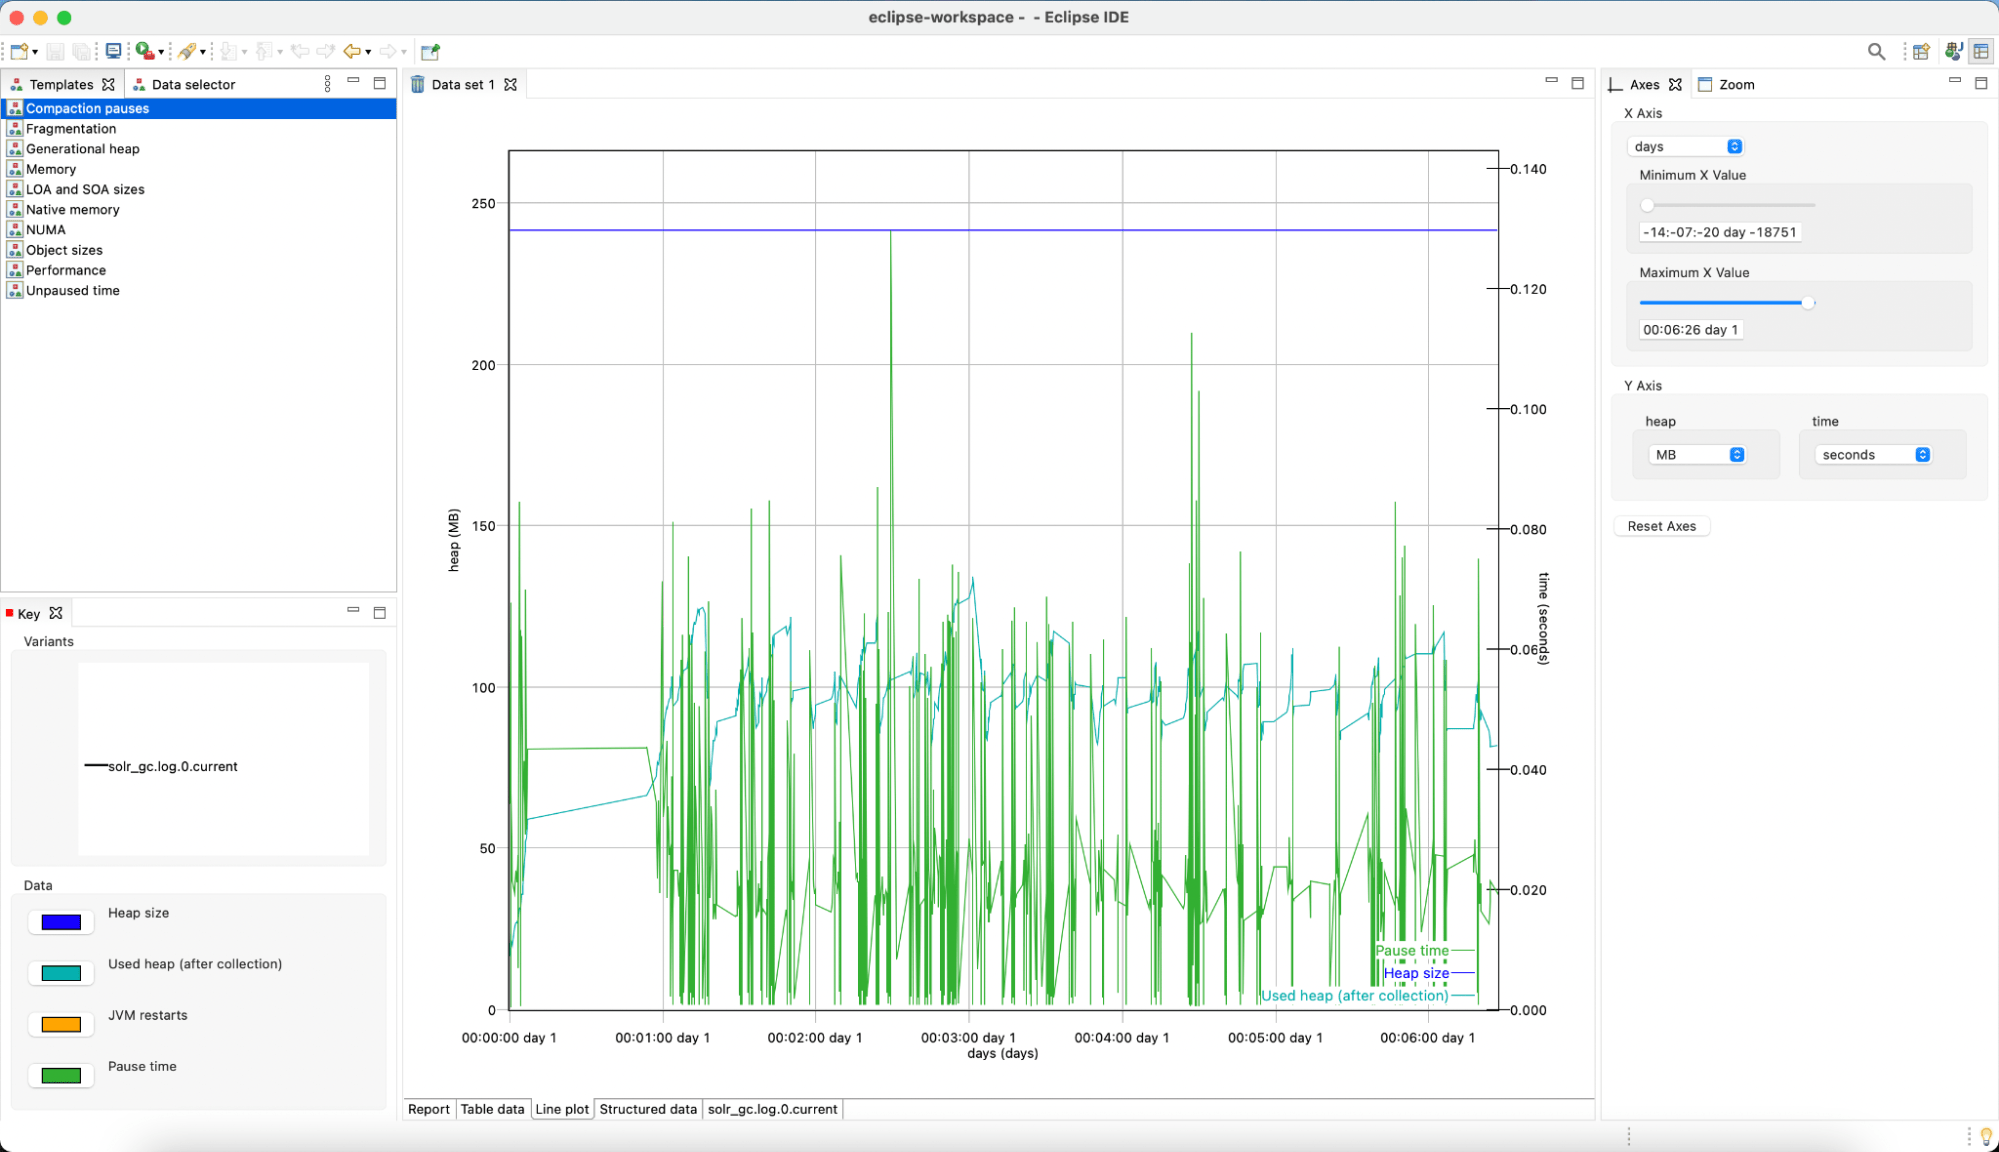
As part of IBM Monitoring and Diagnostic Tools, the Garbage Collection and Memory Visualizer (GCMV) can help in analyzing the Java Virtual Machine and Node.js garbage collector logs. As a plugin for Eclipse, it is freely available for use but covered with a commercial license.
After loading the garbage collector logs to the Garbage Collection and Memory Visualizer gives you information about pause times, compaction times, heap occupancy before and after garbage collection, heap generation sizes, heap usage, small and large object area sizes, object sizes, and finally, the garbage collection pauses.
All that makes IBM GCMV a viable tool for digging into any issue with the garbage collection as long as we have the logs. The support for Node.js garbage collector logs is just another bonus for those who have different runtime environments in their technology stack.
5. GCEasy
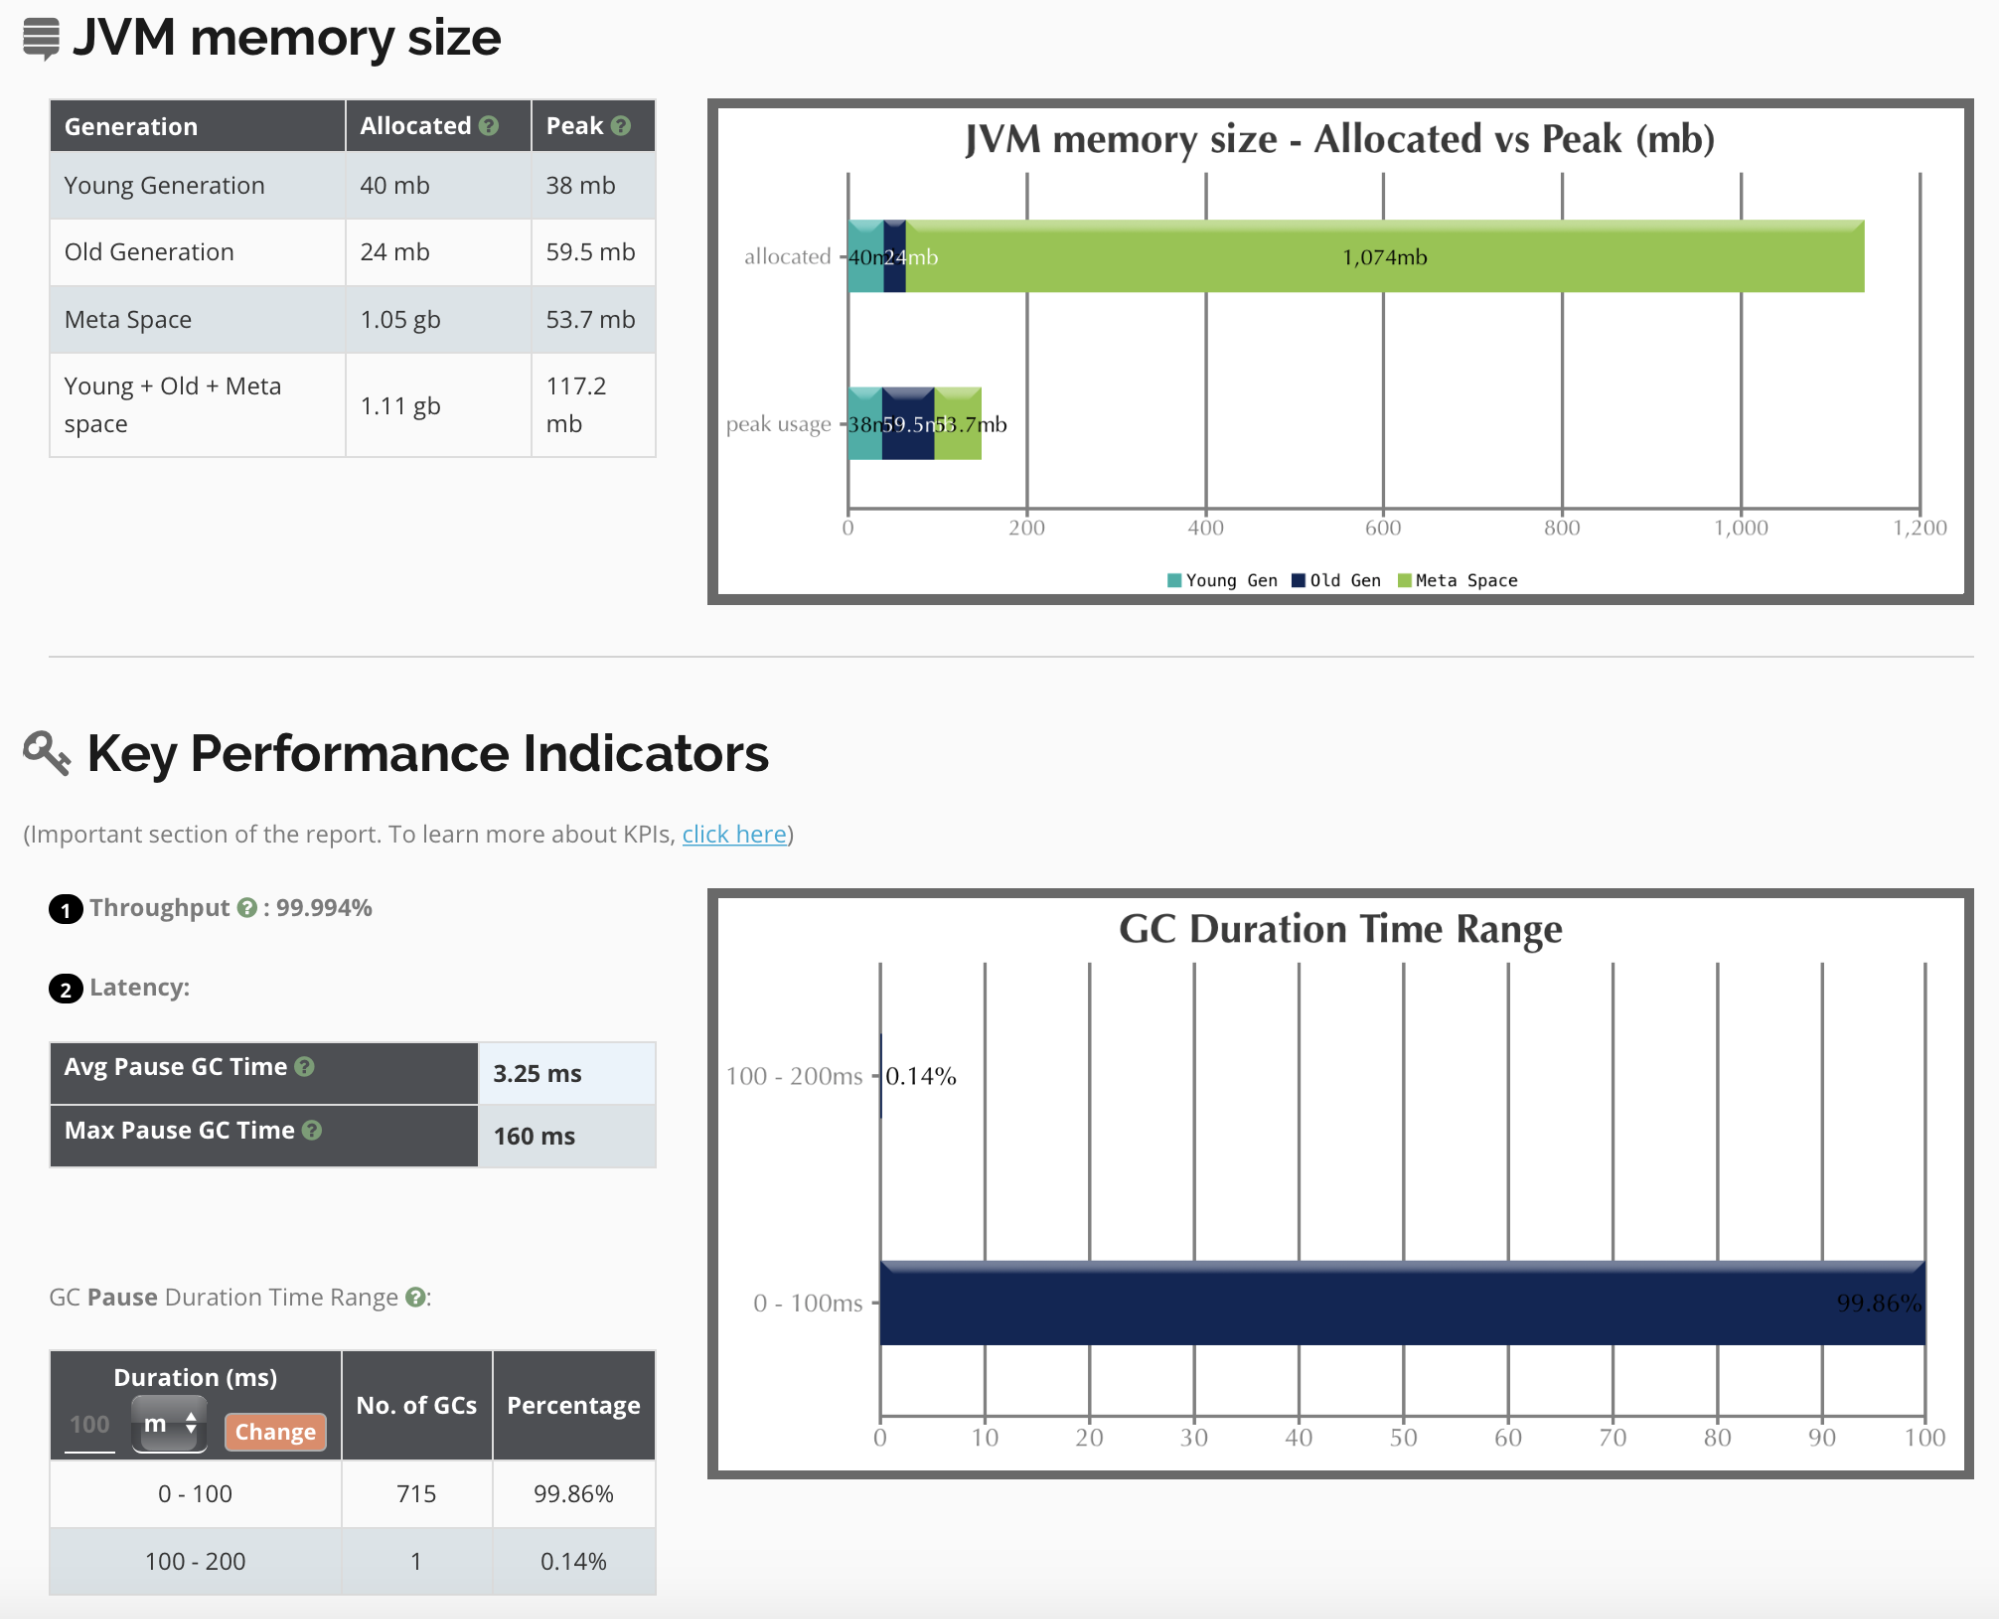
One of the tools that fully relies on the JVM garbage collector logs is GCEasy. This is an online GC log analyzer tool where you can upload the garbage collection log and get the results in the form of an easy to read log analysis report:
The report will include information like generation size and maximum size, key performance indicators like average and maximum pause time, pauses statistics, Java memory leak information, and interactive graphs showing each heap memory space. All this data is calculated based on the log file that you provide.
GCEasy offers a free plan, but it has limitations. At the time of writing, a single user could upload 5 GC log files a month with up to 10mb per file. There are additional plans available on the pricing page if you are interested in using the tool.
6. Garbagecat
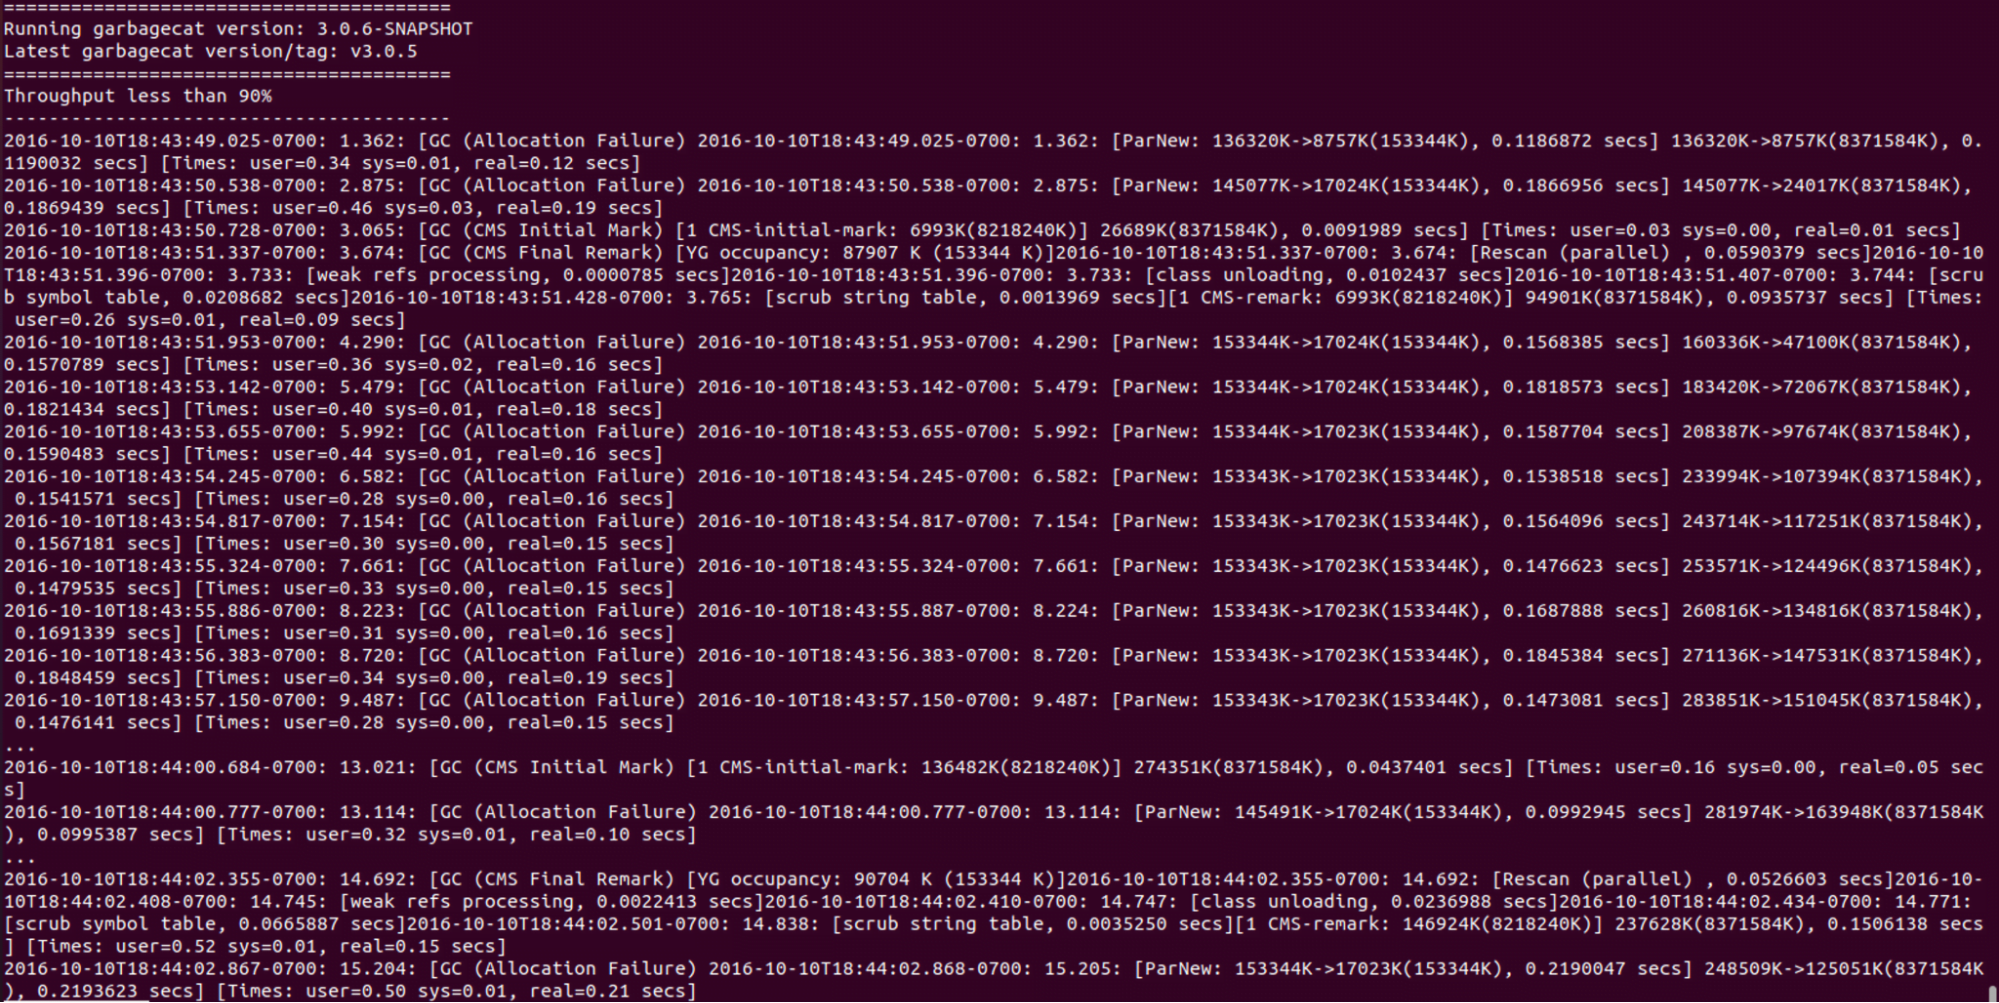
Garbagecat is an open-sourced command-line tool developed in Java that parses the garbage collector logs and analyzes the information provided in it. It includes data about collectors, triggers, the version of the JVM, its options, operating system information, and details and suggestions on various severity levels. It goes beyond just timings. It provides in-depth information and not only the simplest garbage collector pause times and throughput.
The information provided as the output is targeted to help troubleshoot and tune the Java Virtual Machine – both the OpenJDK and Oracle distributions. And when saying OpenJDK, we also mean other implementations that use OpenJDK as the base, such as Azul, AdoptOpenJDK, etc.
7. Solarwinds Loggly
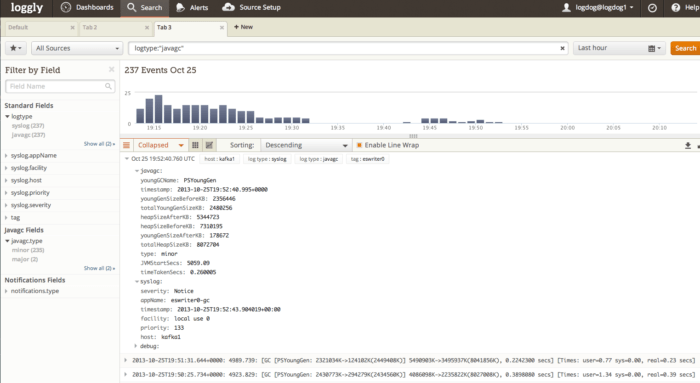
SolarWinds Loggly is a SaaS log centralization solution that you can use to analyze Java Virtual Machine garbage collector logs. Once you set up the GC logging correctly and start sending your logs to Loggly, they will be automatically detected and parsed. That gives an option to look into the garbage collector logs in a human-friendly format and build dashboards that include graphs for whatever part of the logs are relevant for you.
You can search through logs to find events that were taking longer than a given threshold, graph the data like a full garbage collector or minor garbage collector, and compare them in a given period. Loggly provides information about the heap before and after the garbage collection, and of course, enables you to visualize the time of garbage collection, both minor and full.
For an even broader view of the performance and potential problems, you can combine all of that with out-of-the-box alerting and connect it with the application performance monitoring.
Keep in mind that Loggly is a SaaS product, so it‘s not free, though it has a free plan. Have a look at their pricing page if you want to learn more.
Want to see how Sematext stacks up? Check out our page on Sematext vs Loggly.
What GC Log Analyzer Will You Use?
Choosing the perfect solution is not easy. It all comes down to the needs. Some of the tools that we’ve looked at rely mainly on the garbage collection metrics and provide additional support for garbage logs. By comparison, others are perfect for strict garbage collection logs analysis while not providing the possibility to look into the metrics produced by the JVM and its garbage collector. Are they flawed? No, they are just targeted to solve a different solution. However, in the end, you will probably need the functionality from both worlds – solutions that provide metrics and ones that offer log monitoring and analysis or both in the same tool.
If you are looking for one that provides both worlds, you can stop searching and look at Sematext Logs and Sematext Cloud in general. Using Sematext Cloud and all its JVM-related goodies is as simple as installing the agent and using the automatic monitoring and logs discovery. From there, everything will happen automatically. Start your free trial today!