NGINX is a popular web server featuring a wide range of capabilities, including reverse proxy, mail proxy, HTTP cache, and load balancing. It offers TLS offloading and a health check of the backends and supports gRPC, WebSocket, and HTTP/2. In short, NGINX is a one-stop solution for most of your web server needs. When using NGINX, monitoring its metrics is crucial for tackling issues. In this article, I’ll cover the key NGINX metrics you should measure and the best monitoring tools on the market that can help you improve your web server’s performance.
Why Monitor NGINX Performance
There are many factors that can cause NGINX performance issues, such as an increase in throughput of requests, increased network or disk IO, saturation on disk, CPU, memory, and application errors. Since NGINX acts as an entry point for applications, any performance issues or errors it lets through could lead to significant revenue loss or violate your application’s SLI and SLO. NGINX monitoring is therefore crucial. By setting up alerts for issues as they arise, you’ll be able to debug or mitigate problems. Plus, while monitoring NGINX metrics, access and error logs will give you better visibility into your systems, enabling you to take preventive measures and protect your bottom line.
Enabling the NGINX Metrics Page
If you want your NGINX monitoring tools to start consuming metrics, you’ll first need to enable the NGINX stub_status module. Once you do this, NGINX will expose a URL for metrics which can then be consumed by different monitoring solutions. Add the following snippet in your nginx.conf file to enable the metrics:
location /nginx_status {
        stub_status;
        allow 127.0.0.1;
        deny all;
}
How to Monitor NGINX
Now that you’ve enabled your NGINX metrics page, let’s talk about how to actually monitor NGINX. Monitoring NGINX means keeping a watch on your NGINX responses and performance, as well as your system and network metrics, in order to gain a holistic view of what is going on in your NGINX infrastructure. There are many NGINX metrics that are especially important to monitor. They fall under two categories: system metrics and dedicated NGINX metrics.
System Metrics
Monitoring your basic system resources ensures that your underlying infrastructure and operating system are working as they should. It also helps you track system performance and determine whether an NGINX error is caused by a saturation of any of these resources. Key system metrics include load average, disk I/O, memory, storage, and network I/O.
Load Average
Load average is the average load your system is running. It has three values: 1-minute, 5-minute, and 15-minute averages. If the load average is high for any of these values, your CPU is being strained during that interval. Thresholds: As a general rule of thumb, load averages should be less than 1.5–2 times the number of cores. Anything exceeding this means utilization is high. If you see a consistent load of ~2, you may need to increase the number of cores on your machine.
Disk I/O
The disk I/O includes read and write operations from disk. This is essentially the speed at which data is being transferred between the RAM and the disk. Thresholds: If your I/O wait percentage is greater than 1/the number of CPUs, your CPU is waiting a notably long time for your disk to catch up.
Memory
Memory refers to the amount of RAM used, indicating whether there is a high memory requirement for the application to run. Thresholds: Memory usage around 100% will negatively impact your system.
Storage
Storage is the amount of disk being used in the system and how much more data can be stored. Thresholds: If your disk consumption percentage is high (close to 100%), watch out. Your system may stop working if it reaches 100%. Alerts are generally set at 90% of usage.
Network I/O
Network I/O is the rate at which the data is transmitted and received by the system. Thresholds: This may depend on your system bandwidth. Network I/O should not reach the upper limit of the network bandwidth your machine supports.
Dedicated NGINX Metrics
Monitoring NGINX-specific metrics will allow you to catch and debug issues while ensuring that your infrastructure is running smoothly and is easy to maintain. There are quite a few dedicated NGINX metrics that you should be monitoring, including:
Requests Per Second
In short, requests per second (RPS) is the throughput on the NGINX server. Impact and remediation: An increase in RPS indicates an increase in throughput, meaning you may have to scale up your NGINX instances. Thresholds: This will vary according to your machine configuration, but if you see a sudden increase in RPS, you should look into the cause. It could be due to increased throughput or retries resulting from an error.
Response Time or Request Processing Time
The response time is the interval between a request arriving and the response—basically, how long it takes to serve each request. It also functions as a key indicator of your application’s performance. Impact and remediation: An increase in response time means there is an issue with your application or an upstream service, leading to a long request processing time. This could be a sign of a change or a new deployment causing issues. Thresholds: This will depend on your application performance. If the threshold increases after a deployment, you can assume something in the new deployment is causing the problem. This is one reason response time metrics can be useful in canary deployments.
Active Connections
Active connections are the total number of connections or requests currently served by the NGINX instance. There is a maximum number of connections that can be active at any time. If the total active connections exceed this limit, the connections will start dropping. Impact and remediation: Reaching a maximum number of connections will cause the connections to go into backlogs and to drop if the backlog is filled. If this happens, you need to scale your NGINX machines. Thresholds: This depends on your machine’s configuration, which you can adjust to optimize the maximum connection variable.
Connection Backlogs
Connection backlogs are the connection requests in queue because they cannot be served right away. Even though NGINX accepts connections quickly, they might go into a backlog queue in some high-traffic situations. The size of this queue can be configured via the NGINX configuration file. Once the backlog fills up, the NGINX instance will not accept new connection requests. Impact and remediation: Connection backlogs are an indication that you need to increase the number of NGINX boxes. Thresholds: Ideally, this should be zero. You don’t want your connections to go to the backlog queue, as this will increase response time.
Server Errors
NGINX server errors are the server status codes that can be recorded. They represent error classifications, such as server-side error, client-side error, permission errors, or redirections. 5xx are internal server errors. 4xx are client-side errors, meaning the client made an error while sending the request to the server. Impact and remediation: This tells you the number of requests that failed due to client or server errors. A few errors are not uncommon, but a sudden increase could indicate an issue from either the application or the client-side. Thresholds: These are generally around 1%, but it depends on your application. If thresholds increase instantly, there is almost certainly an issue with your application.
Dropped Connections
These connections are dropped due to full backlogs and maximum active connections. Impact and remediation: If you have dropped connections, you may need to increase your maximum active connections or connection backlogs, or scale up your NGINX machines. Thresholds: This should be zero, as you don’t want your connections to be dropped.
Available Upstream
This indicates the number of upstream servers available to serve the requests in case NGINX is working as a reverse proxy. Impact and remediation: This tells you whether your upstream servers are working or not. If these go down, your request serving capacity will likely decrease due to the loss of an upstream server. Thresholds: Any decrease in the number of upstreams indicates that your upstream server is down.
Active Upstream Connections
Active upstream connections are the total active connections with the upstream servers in case of a reverse proxy. Impact and remediation: A change here indicates that there is a high number of connections with an upstream server. This could mean that your connections are not getting served properly. You may also see an increase in response time due to the added latency. An increase in RPS also means that throughput has increased and your NGINX servers need to be scaled. Thresholds: This will depend on your machines and the number of upstream servers. Look out for any sudden spikes.
Upstream Errors
This alerts you to errors coming from upstream servers if NGINX is working as a reverse proxy. Impact and remediation: An increase in this value indicates that there are errors from upstream servers that may need to be dealt with. Thresholds: This will depend on your application, as with server errors.
Open Files
NGINX opens a system file descriptor for every connection it handles. Since there is a limit to the number of open files you can have on a system, there is also a cap on the number of simultaneous connections a NGINX instance can handle. This setting is in the operating system configuration. You can check this with the ulimit command in Linux. Impact and remediation: NGINX opens a file for every new connection. An increase in the number of connections could lead to an increase in the number of open files. Thresholds: The standard limit is set to 65,536, but you can increase this if you expect a high number of connections.
The Top 7 NGINX Monitoring Tools
There are many solutions available for visualizing NGINX metrics. To help you determine which one offers the best ROI and caters to your specific monitoring needs, I’ll compare some of the top tools on the market.
1. Sematext
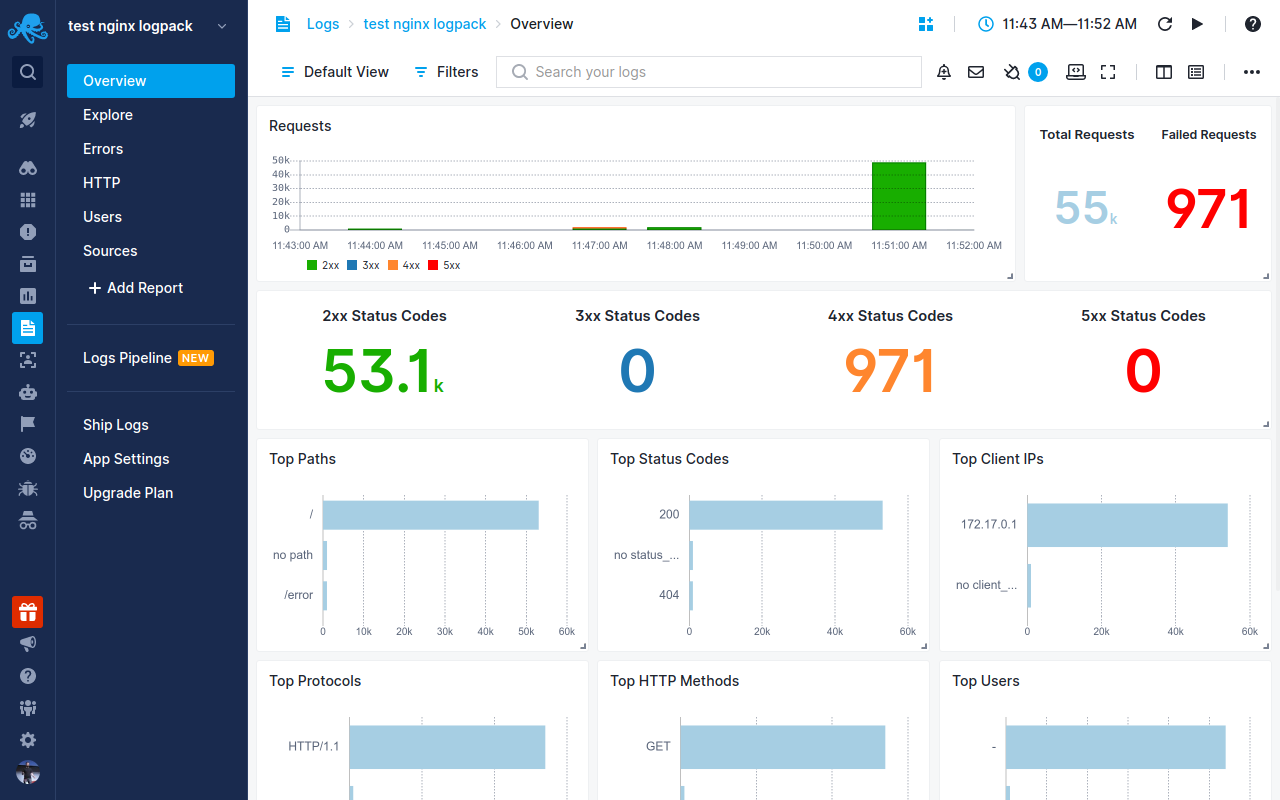 Sematext Monitoring is an infrastructure monitoring tool with support for real-time NGINX performance monitoring. It covers most of the metrics exposed by NGINX and NGINX Plus, including request per second, response information to upstream, caching, and SSL offloading. Sematext has advanced features that enable faster troubleshooting like alerting, anomaly detection, and log correlation. The solution integrates very easily with Kubernetes, containerized environments, cloud solutions like Amazon ECS, and alerting solutions such as PagerDuty. It can send alerts to Slack and e-mails. With Sematext, you can also monitor databases, applications, and servers. If you’re looking for a one-stop infrastructure monitoring tool, Sematext’s monitoring and alerting capabilities have you covered.
Pros
- Auto-discovery for NGINX boxes within a large-scale infrastructure
- Support for Elasticsearch API for logs and InfluxDB API for metrics integration
- Out-of-the-box dashboards backed by NGINX metrics and logs
Cons
- No self-hosted solution
- Lack of eye-candy network maps where one could see all of the NGINX instances
Pricing
The price for metrics collection is $3.6 per container host per month. Pro pricing is $5.76 per container host per month. Standard pricing for integrations is $10.08 per agent per host, while the Pro tier stands at $15.12 per agent per host.
2. Prometheus and Grafana
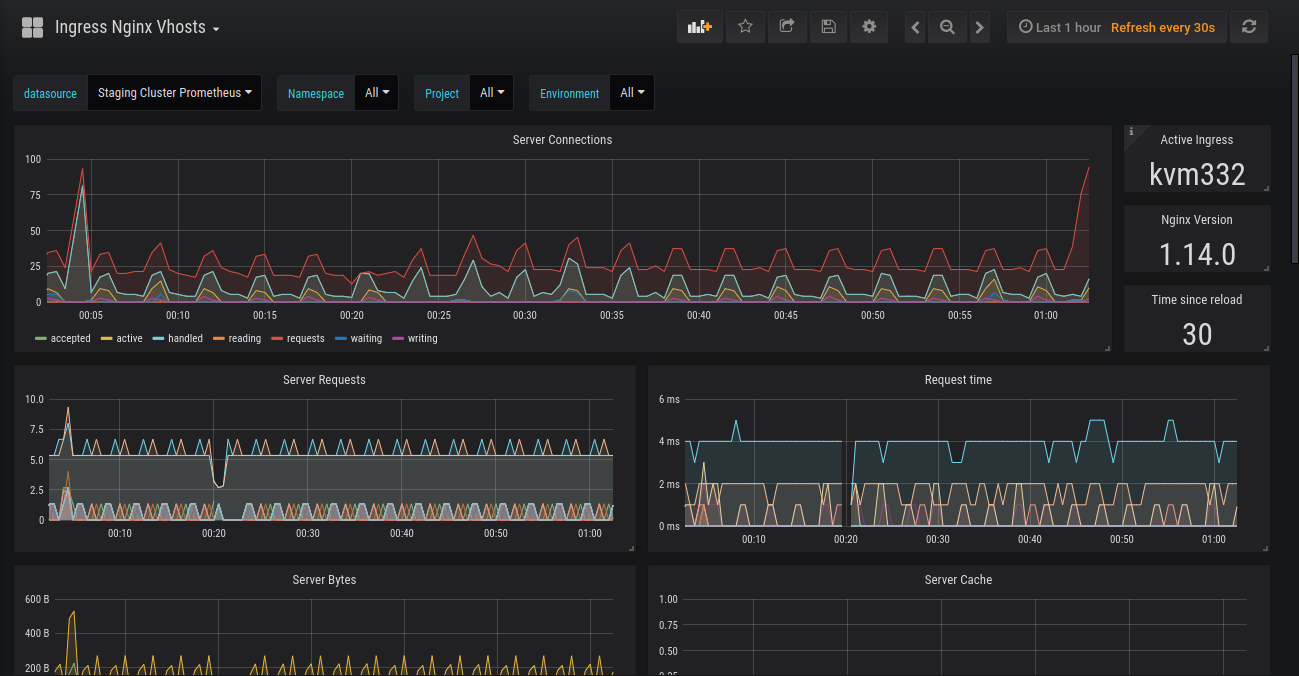 Prometheus and Grafana are both open-source solutions you can use to monitor NGINX and NGINX Plus metrics, such as requests information, upstream, and cache. Prometheus is a time-series database and requires a visualization tool, with Grafana being the most popular. You can also install an open-source NGINX exporter to expose metrics for Prometheus to consume. Prometheus can be easily integrated with a wide variety of tools. To generate alerts for NGINX issues from Prometheus, set up a custom dashboard and run Alertmanager. You can also use Grafana to create alerts and send them to different channels. There are a lot of open-source dashboards out there for you to import and use.
Pros
- Auto-discovery of NGINX with regex and other options
- Free and open-source, apart from the cost of hosting Prometheus and Grafana
- Good query language and alerting support; can write custom alerts using PromQL
Cons
- No correlation between NGINX logs and metrics
- Multiple components to self-manage (a possible issue for small teams); tough to manage at large scale with other tools’ support
Pricing
Prometheus and Grafana are free, aside from the cost of the machines used to host them.
3. New Relic
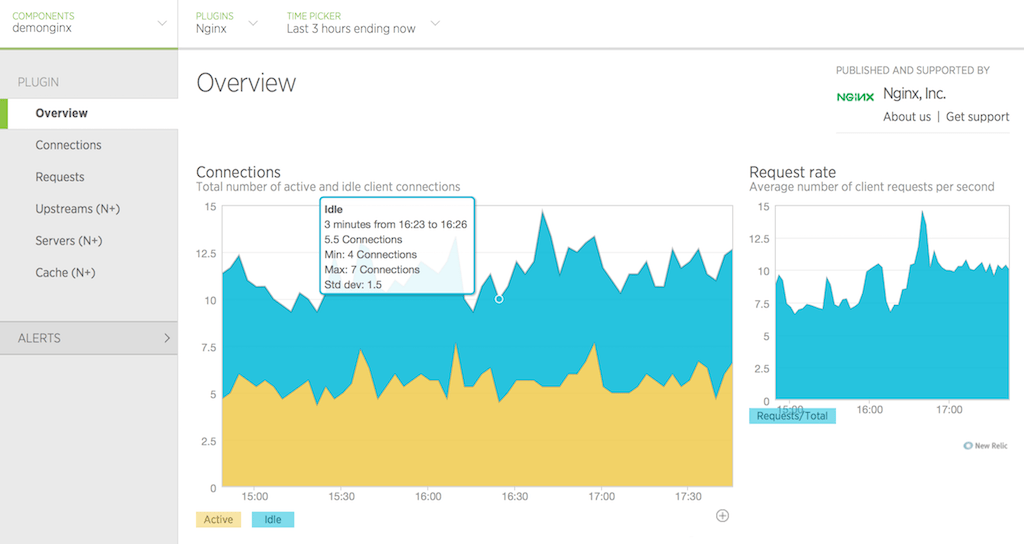 New Relic is an application performance management tool that offers NGINX and NGINX Plus monitoring capabilities. With the help of a plugin, it can collect a number of metrics, including requests, responses, caches, and SSL metrics. New Relic has good integration with Prometheus, major cloud providers, and containerized solutions like Docker and Kubernetes. It also supports sending alerts to many channels, including Slack, e-mail, PagerDuty, and Webhooks. To enable NGINX metrics, you’ll need to install a New Relic agent on your hosts. If you’re running NGINX on Amazon ECS or Kubernetes, you’ll have to follow a different integration procedure. New Relic provides two types of agents: one for APM, which is present in many languages, and another that can be used for infrastructure monitoring (like NGINX, MySQL, and Redis).
Pros
- Pre-built dashboards to monitor NGINX performance
- Auto-discovery of NGINX boxes
- SSL handshake metrics for issues like failures due to certificate rotations
Cons
- No self-hosted solution; must rely on their UI, so giving access to more users costs more
- No upstream metrics; uncertain visibility on connections to upstream servers if you’re running NGINX as a reverse proxy
Pricing
New Relic offers a tiered pricing model: Free, Standard, Pro, and Enterprise. The Free tier includes 100 GB per month of free data ingest, one free full-access user, and unlimited free basic users. Costs are based on data volume, with a standard rate of $0.25 per GB per month beyond 100 GB. Want to see how Sematext stacks up? Check out our page on Sematext vs New Relic.
4. Datadog
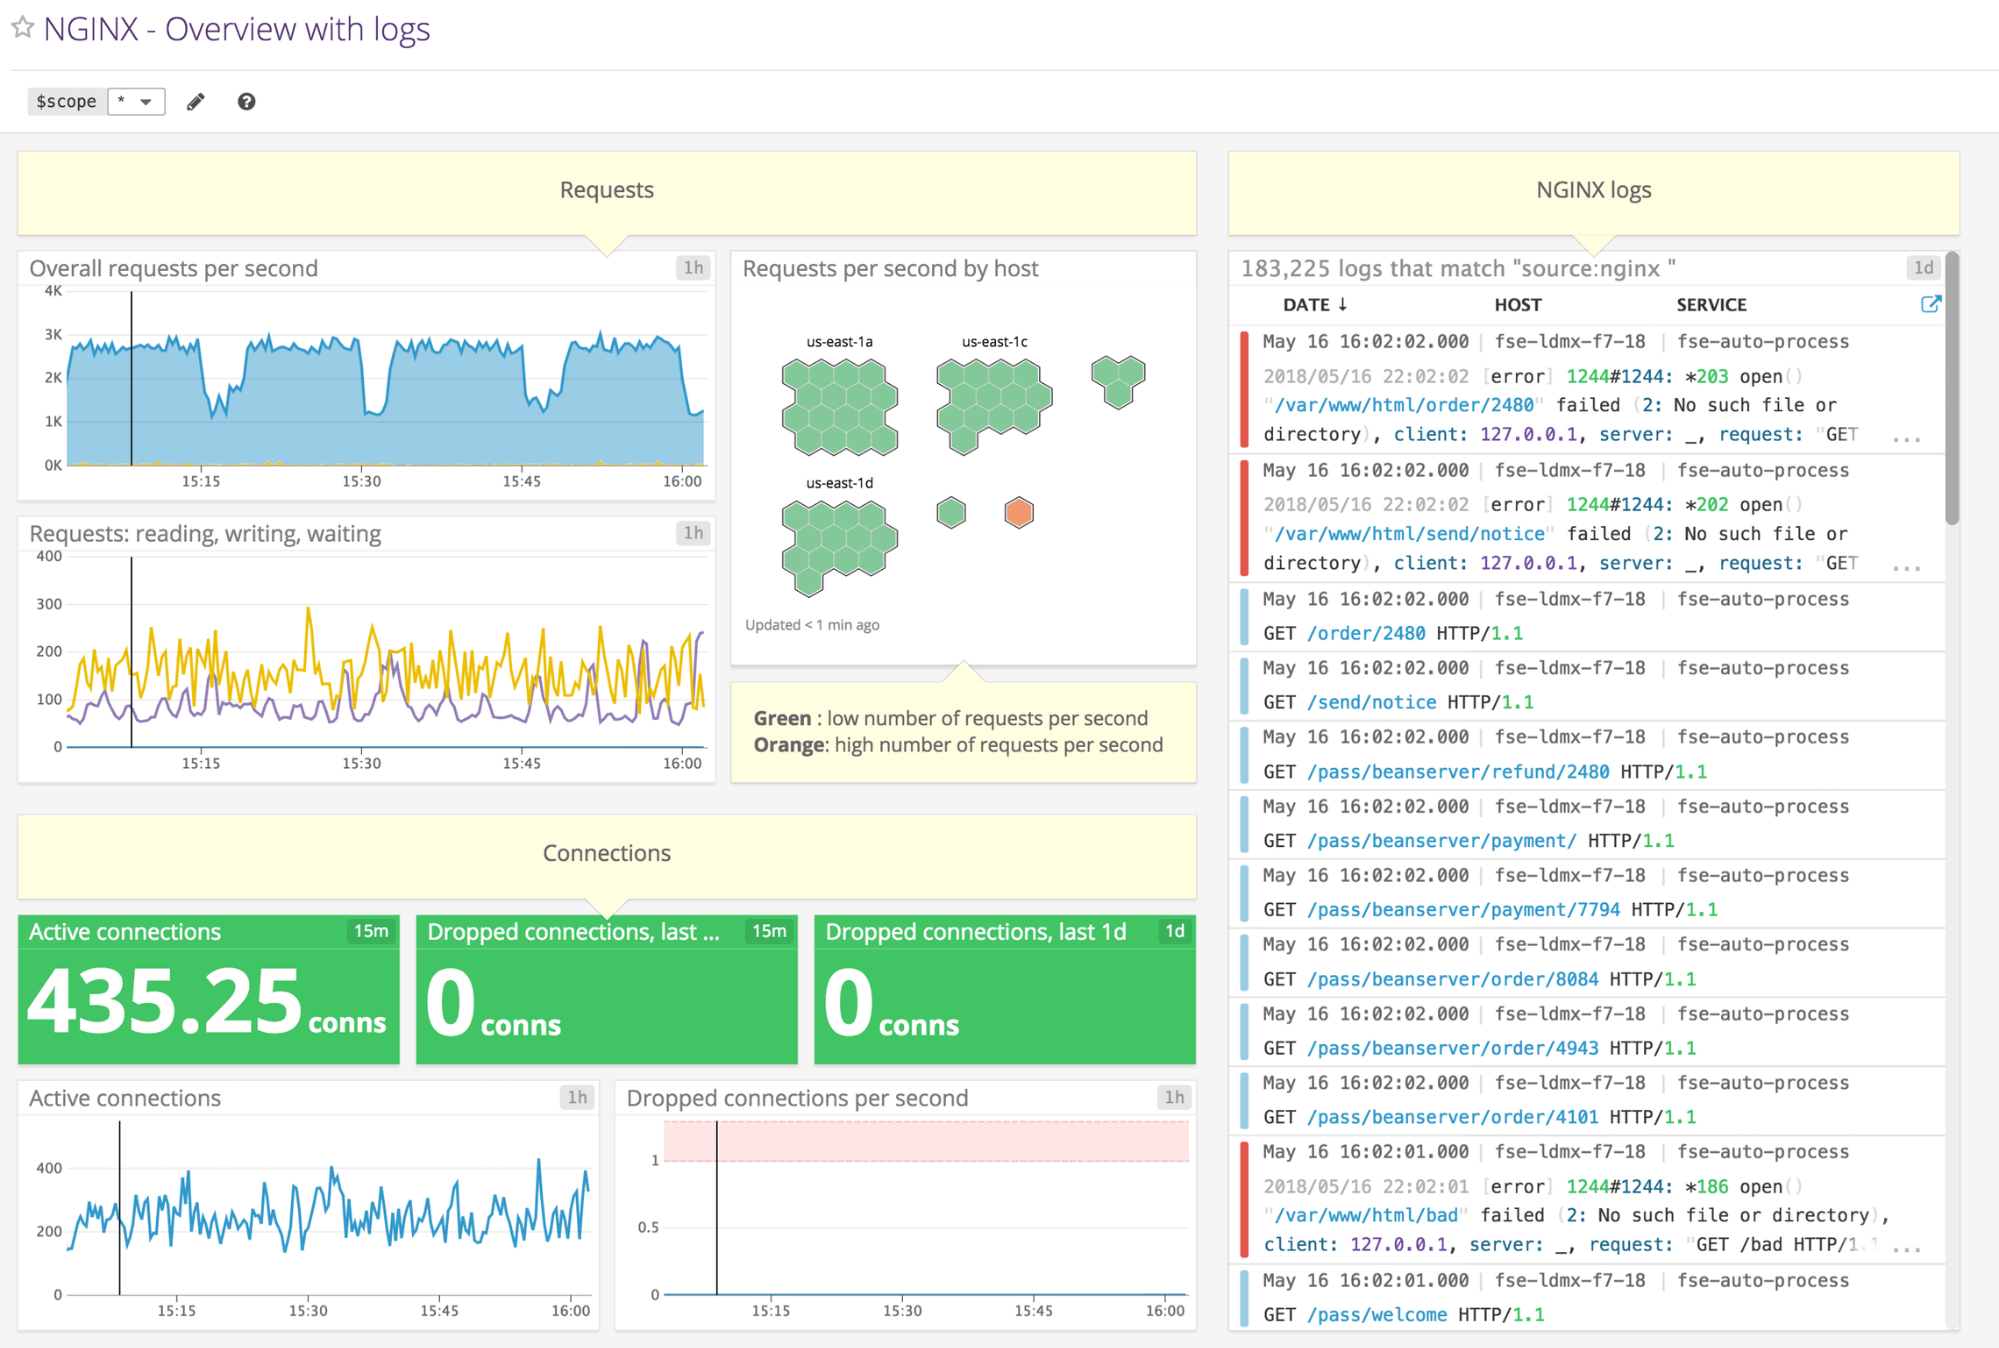 Datadog is a SaaS-based monitoring analytics platform that you can use for real-time NGINX monitoring. It supports more than 180 NGINX metrics, as well as anomaly detection and service-map generation, which can help track down the impacted services. With Datadog, you get a bird’s-eye view of all NGINX instances, which helps you see the overall summary. Datadog supports integration with containerized solutions like Amazon ECS, Kubernetes, and Docker. This makes it future-proof if you want to use it to monitor your NGINX ingress controller or run NGINX in containers. Datadog also provides custom alerts and correlation with NGINX logs and facilitates faster troubleshooting. It can send notification events to e-mails, Slack, PagerDuty, Jira, and more.
Pros
- Higher-level view of all NGINX instances; useful for viewing status or identifying potential hotspots with pre-built dashboards
- Can correlate metrics with NGINX logs for better troubleshooting
- Support for AWS Lambda
Cons
- Possible increase in agent resource consumption as you activate more features; expensive, with a limited number of custom metrics
- Complex to use; a steep learning curve for new users
Pricing
Datadog offers a 14-day free trial. Its pricing model depends on the number of hosts per month. The Pro tier costs $15 per host per month. Logs are charged based on ingestion volume at $0.10 per GB per month. Want to see how Sematext stacks up? Check out our page on Sematext vs Datadog.
5. AppDynamics
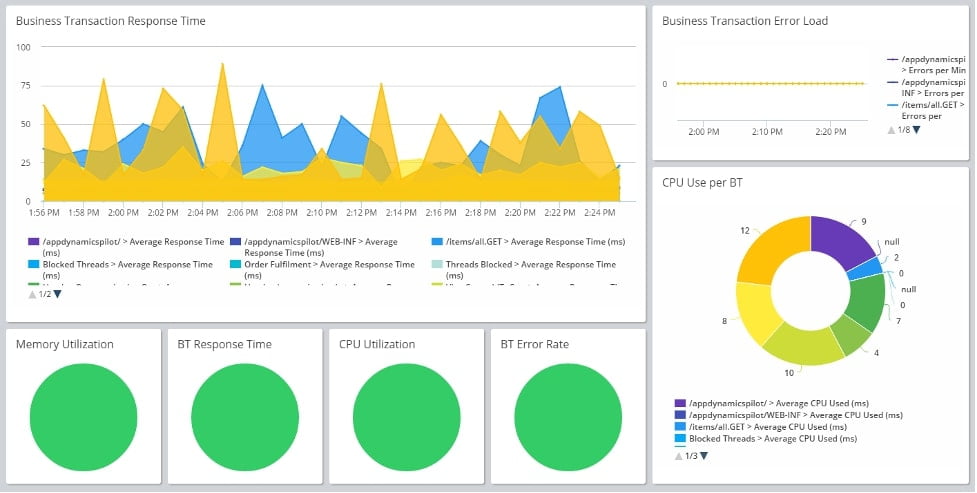
AppDynamics is an application performance management tool for both on-premises and cloud systems. It includes NGINX and NGINX Plus monitoring integration and uses machine learning to identify anomalies in your system. AppDynamics can issue fine-grained alerts that can be sent across different channels, including e-mail, PagerDuty, and Webhook. It can also integrate with Elasticsearch API and AWS Lambda to consume metrics.
Pros
- Pre-built dashboards for NGINX, available once agents are installed
- Anomaly detection is helpful for faster troubleshooting
- Mobile app for monitoring NGINX while you’re on the move
Cons
- No native support for NGINX on Kubernetes or Amazon ECS
- No documentation around auto-discovery; a steep learning curve
Pricing
AppDynamics offers a 15-day free trial. The paid pricing model has tiered: Infrastructure Monitoring ($6 per CPU core), Premium ($60 per CPU core), and Enterprise ($90 per CPU core). Want to see how Sematext stacks up? Check out our page on Sematext vs AppDynamics.
6. SolarWinds Server & Application Monitor
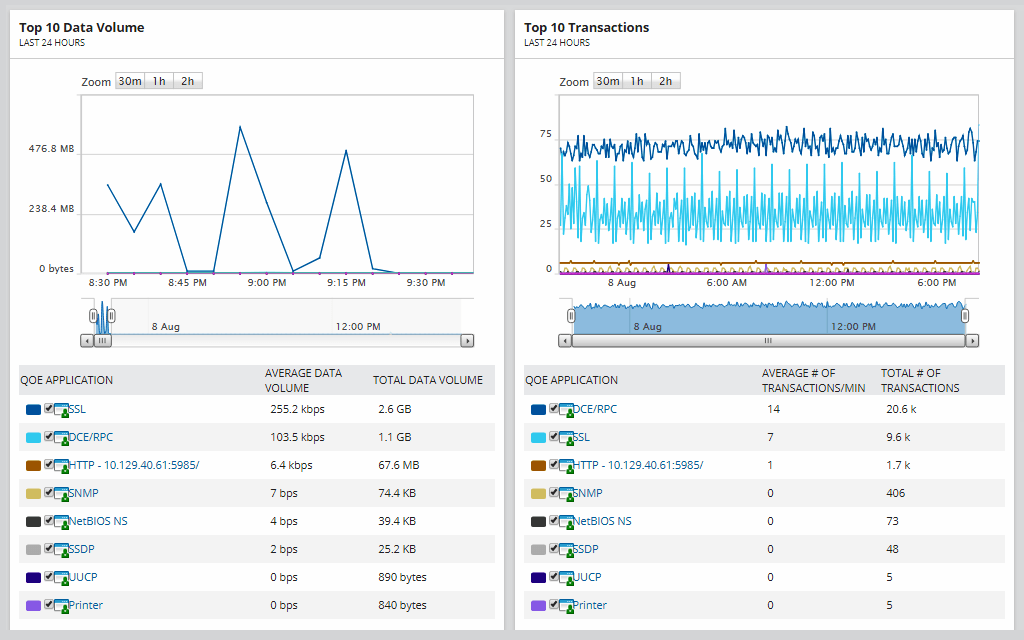 SolarWinds Server & Application Monitor (SAM) helps enterprises manage their networks, systems, and IT infrastructure. SolarWinds can monitor NGINX and NGINX Plus and present metrics such as requests, upstream, SSL, and cache information. Whenever they go beyond the limit range, the tool alerts you via a number of notification channels, including e-mail, PagerDuty, Slack, ServiceNow, and SMS. You can use SolarWinds to map applications and dependencies in order to identify the cause of issues and impacted applications. It also has capabilities that help with capacity planning. One of the tool’s primary features is software inventory management via remote control, which helps minimize vulnerabilities.
Pros
- Application and dependency maps for faster troubleshooting
- Supports auto-discovery of NGINX boxes
- Pre-built NGINX monitoring dashboard and templates
Cons
- No native support for Kubernetes or container platforms; no integration with Elasticsearch APIs
- No support for anomaly detection
Pricing
Pricing information is not readily available, but there are free trials for each product, ranging from 14–30 days.
7. Dynatrace
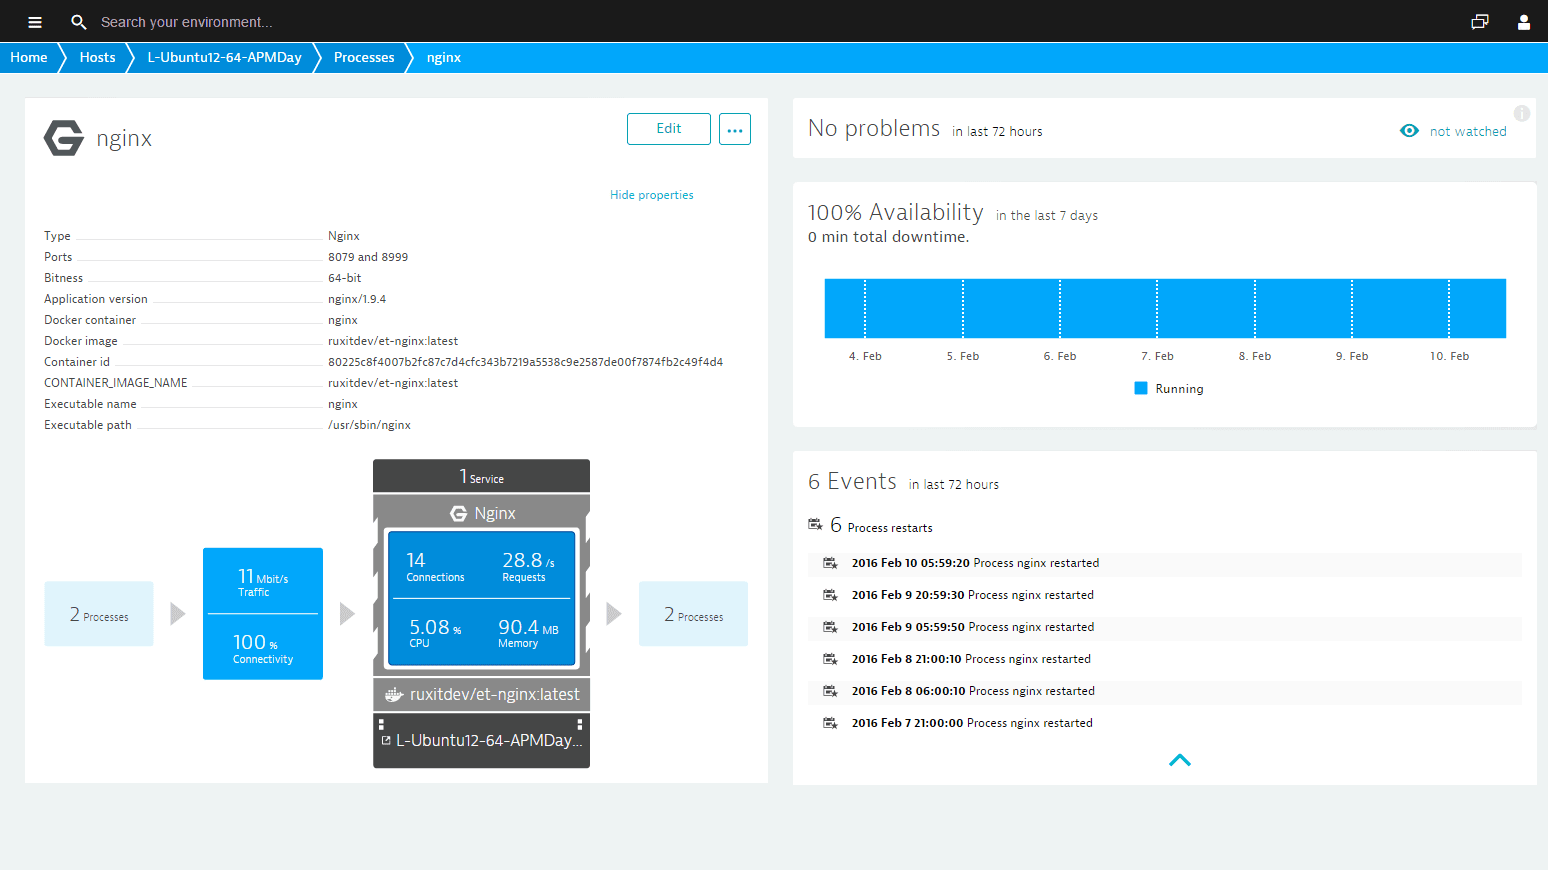 Dynatrace is a software platform for application performance and infrastructure monitoring, with AI capabilities to identify anomalies in your system. It can monitor NGINX and NGINX Plus, and present metrics like request information, performance, request zone, caches, upstream, and SSL details. The tool automatically detects network topology and presents it in dashboards. One of Dynatrace’s greatest features is that it can be hosted on-premises. It’s also relatively easy to deploy: You can usually get it running in a few minutes, after which the pre-built NGINX monitoring dashboard will start retrieving your data. Dynatrace sends alerts through PagerDuty, Slack, e-mail, Webhook, ServiceNow, and more.
Pros
- Requires only one agent to collect NGINX and other infrastructure metrics
- Ability to add custom NGINX dashboards and flows
- Ability to send Dynatrace data to Elasticsearch via API integration
Cons
- No SSL offloading metrics
- Unclear documentation; difficult to find out how to enable auto-discovery and other advanced features
Pricing
Dynatrace offers a 15-day free trial, as well as a per-host pricing model. Infrastructure monitoring costs $21 per month per host for 8 GB of data, while full-stack monitoring costs $69 per host per month for 8 GB of data. Want to see how Sematext stacks up? Check out our page on Sematext vs Dynatrace.
Correlating NGINX Metrics with Logs for Easier Troubleshooting
As you can see, there are tons of great options for monitoring NGINX metrics. This leads us to the importance of correlating NGINX metrics with logs. When NGINX logs are combined with metrics, they present significant value to the end-user, as you can collect logs separately and use them to generate custom metrics. NGINX features two types of logs: access and error. With access logs, you can see the latency of applications and upstream servers, while error logs show you the errors in the applications. These two types of logs, together with metrics, provide a more holistic view of what is happening in your infrastructure. Most of the tools discussed in this post have the ability to export and parse NGINX logs for improved visibility. Sematext, AppDynamics, and Datadog offer better support for NGINX log parsing, visibility, and metric correlation—and Sematext has superior support for correlating logs and metrics for troubleshooting. New Relic is a bit more complex and uses a separate dashboard for logs and metrics. Note: You will need to enable NGINX access and error logs for any of these tools to be able to extract them.
What Is the Right NGINX Monitoring Solution for You?
Choosing the right NGINX monitoring solution can be tricky, as there are many similarities between the solutions covered in this post. For example, they’re all restricted by the number of metrics they can show based on the NGINX solution you’re using, although you’ll get more metrics with NGINX Plus. So where do you go from here? Start by thinking about your specific use case. Prometheus and Grafana are great for beginners who have small infrastructures and are monitoring fewer machines. New Relic offers good APM support, while AppDynamics and Datadog provide a holistic view of logs and metrics (although they can be pricey). Sematext is a great choice if you want to monitor NGINX performance and metrics at an affordable cost, due to features like:
- Anomaly detection for any unwanted patterns
- Correlated metrics
- Native container and Kubernetes support
- Auto-discovery of NGINX boxes and the ability to run event-driven infrastructure
Check out our 14-day free trial to see how these features can improve the observability and monitoring of your NGINX infrastructure. Author Bio  Gaurav Yadav Gaurav has been involved with systems and infrastructure for almost 6 years now. He has expertise in designing underlying infrastructure and observability for large-scale software. He has worked on Docker, Kubernetes, Prometheus, Mesos, Marathon, Redis, Chef, and many more infrastructure tools. He is currently working on Kubernetes operators for running and monitoring stateful services on Kubernetes. He also likes to write about and guide people in DevOps and SRE space through his initiatives Learnsteps and Letusdevops.