Monitoring systems help DevOps teams detect and solve performance issues faster. With Docker and Kubernetes steadily on the rise, it’s important to get container monitoring and log management right from the start.
This is no easy feat. Monitoring Docker containers is very complex. Developing a strategy and building an appropriate monitoring system is not simple at all.
In this post, we’re going to delve deep into what container monitoring is and why you need it, and compare the best container monitoring tools available today. Some may not have full-blown features like the Sematext’s Docker monitoring solution, such as a few open-source products.
I’m here to explain the tradeoffs between using CNCF products and SaaS tools. So you can make an educated estimate of your needs and expenses.
But first, let me quickly walk you through the basics of container monitoring.
What Is Container Monitoring
Container monitoring is the process of tracking the performance of applications built on microservice architectures by collecting and analyzing performance metrics. Due to their ephemeral nature, containers are rather complex and more challenging to monitor compared to traditional applications running on virtual machines or bare metal servers.
What does this mean in plain English? Containers are ephemeral, meaning stateless. You need to collect the metrics and logs and send them to a centralized location right away for safekeeping. Otherwise, they’ll get deleted once the container is deleted. Hence why it’s more challenging than conventional VMs and servers.
Monitoring such an infrastructure setup is a must and a critical step in ensuring the optimal performance of your containers.
We talked more about this in our article about Docker container management challenges. Definitely check that out.
Why Should You Monitor Docker Containers
Monitoring your containers in real time is essential to ensure peak app performance. When it comes to Docker containers, however, monitoring helps you to:
- Detect and solve issues early and proactively to avoid risks in production
- Implement changes safely as the entire environment is monitored
- Fine-tune applications to deliver improved performance and better user experience
- Optimize resource allocation
How Does Container Monitoring Work: 12 Best Monitoring Tools for Docker
Monitoring containers is not that different from monitoring traditional deployments as in both cases you needed metrics, logs, service discovery, and health checks.
However, it’s more complex due to their dynamic and multi-layered nature. But a good container monitoring solution can navigate through all the layers within a stack. You just have to choose the one that fits your specific use case. Here are the best Docker monitoring tools you should consider using for better operational insights into container deployments.
1. Sematext
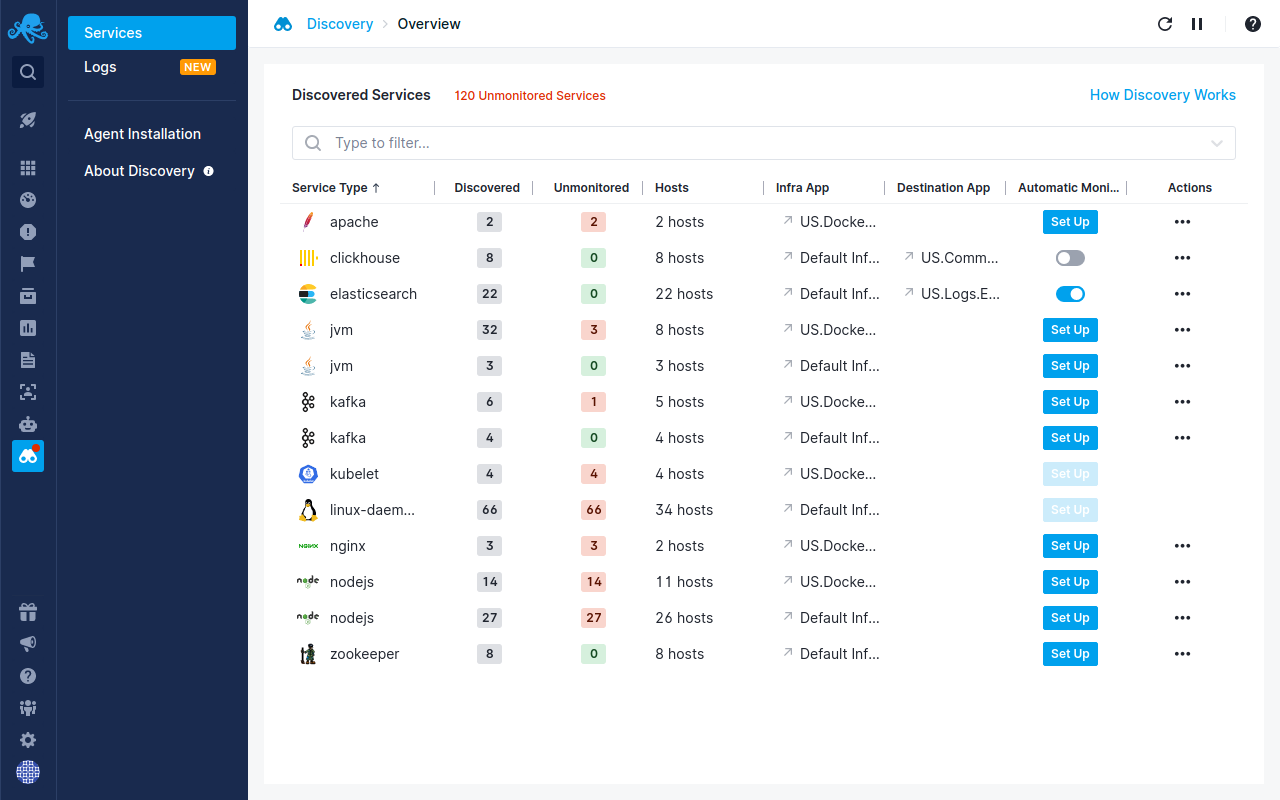
Sematext Monitoring is a full-stack observability solution with Docker monitoring capabilities. It provides a more comprehensive, and easy-to-set-up, monitoring dashboard for metrics, events, and logs, giving you actionable insights about containers and infrastructure.
With anomaly detection, alerting and correlations between all parts of your infrastructure, clusters, and containers, you get everything you need in one place, for better and faster troubleshooting.
Sematext’s auto-discovery automatically detects new containers and containerized applications running in them, and lets you start services and log monitoring directly through the user interface without extra steps. Very magical! 🤯
You get full visibility and insight into your infrastructure. It doesn’t matter what platform you are running on – whether it’s bare metal, VMs, or an orchestrated container environment like Docker Swarm, Rancher, or Kubernetes.
Combining all of this with alerting and anomaly detection with the option to use dozens of different notification destinations gives a well-rounded observability platform. For a quick overview of how to monitor Docker container logs in Sematext, then check out the video below.
2. Dynatrace
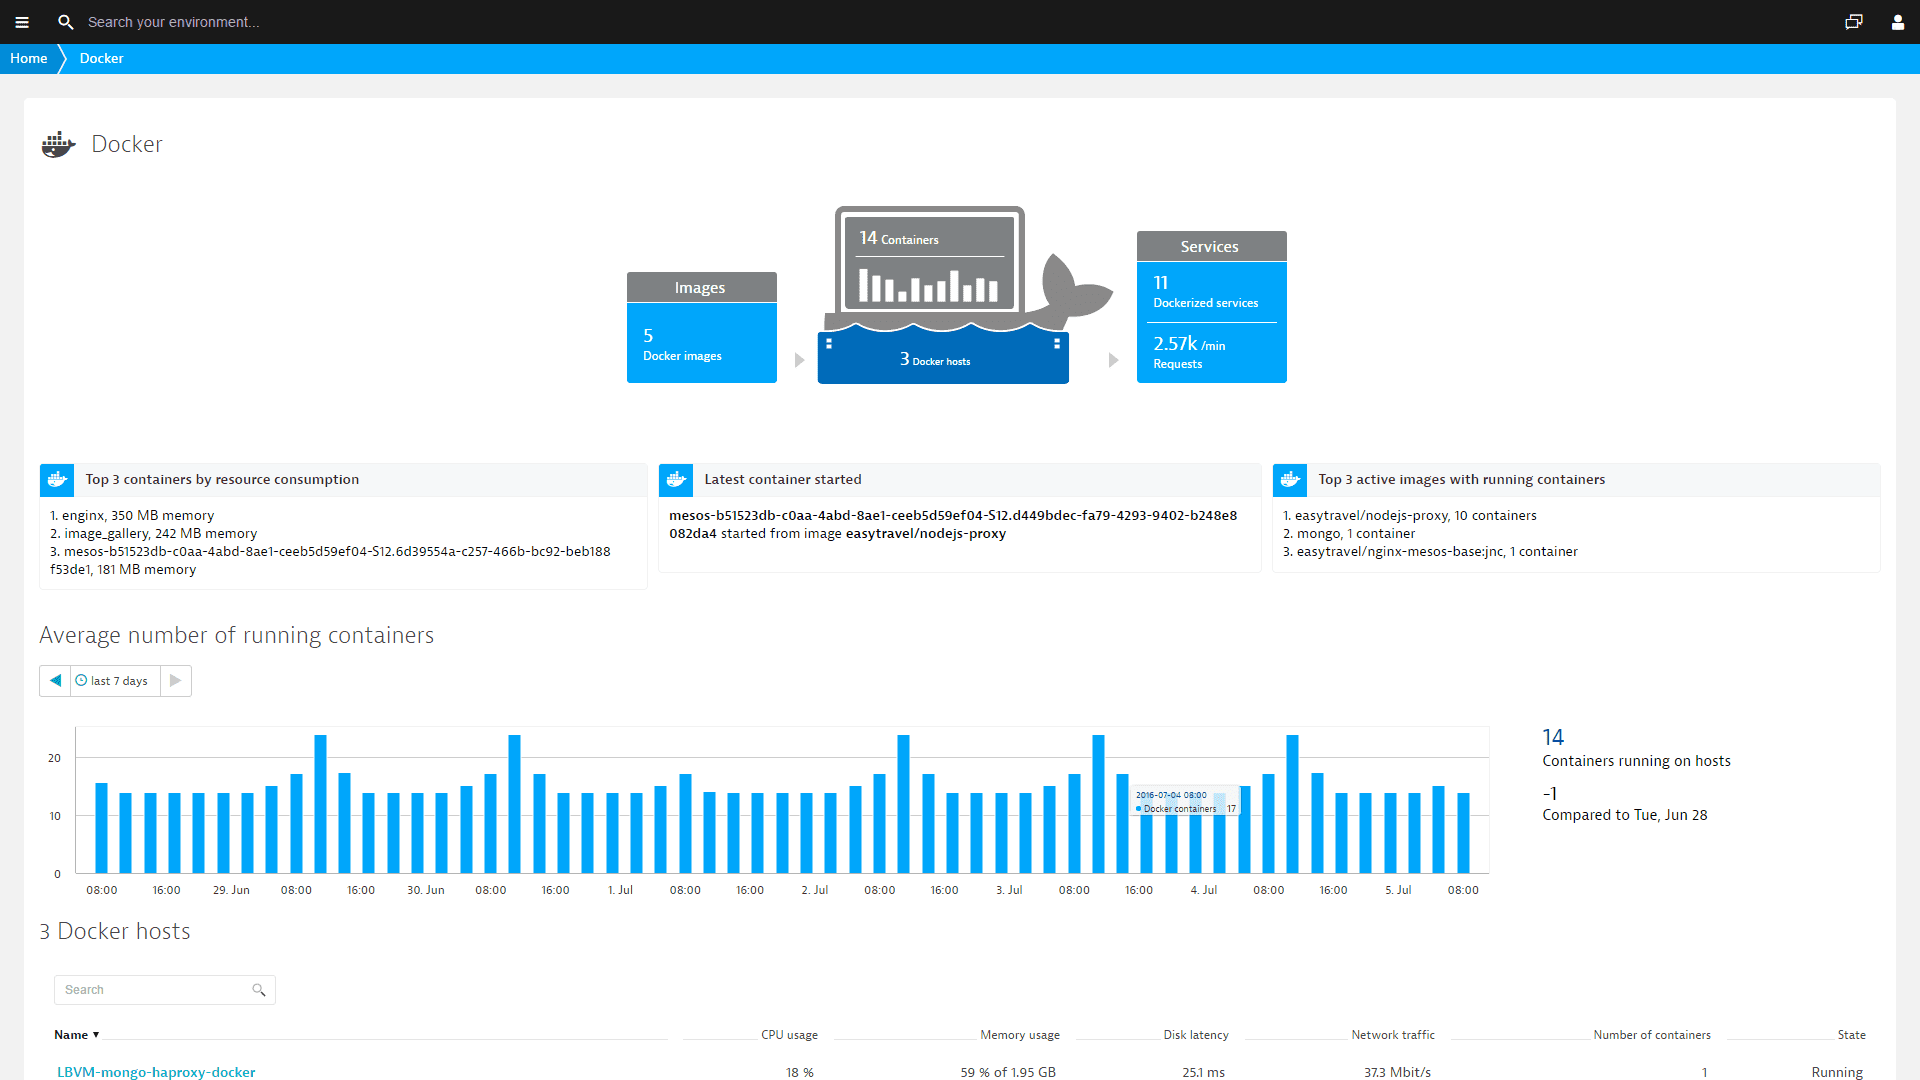
Dynatrace is also a full-stack observability solution that provides a user-friendly approach to monitoring your Docker container metrics and logs.
Available in both software as a service (SaaS) and on-premise models it will fulfill most of your monitoring needs when it comes to Docker, its logs, and the infrastructure it is running on.
Dynatrace lets you explore container resource usage of distinct hosts in the same way you could otherwise only get by executing a docker stats command.
You get access to Docker metrics like CPU usage, RSS and cache memory usage, both incoming and outgoing network traffic, and total time that a container’s CPU usage was throttled. Pretty neat!
Want to see how Sematext stacks up? Check out our page on Sematext vs Dynatrace. If you want an even broader comparison between Dynatrace and its alternatives, read our dedicated article.
3. Datadog
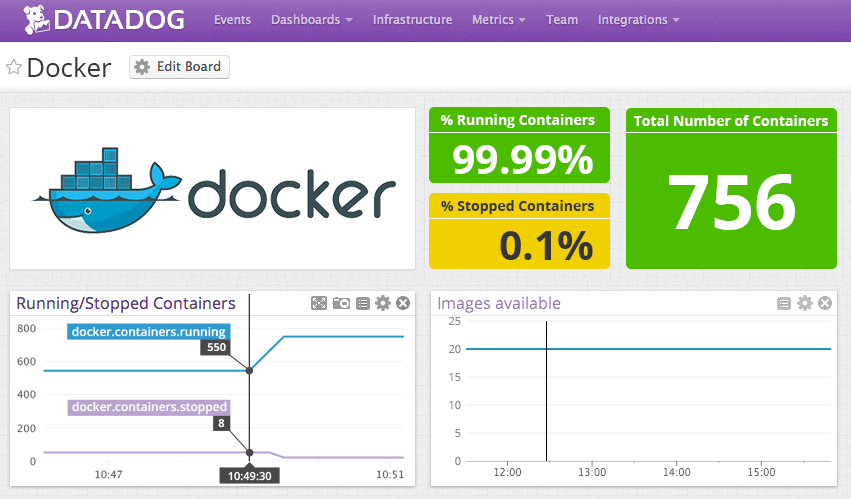
Datadog provides a robust monitoring system for your infrastructure, applications, network, and logs, while also offering support for Docker containers.
All that is needed is installing the Datadog agent. If you already have the agent installed you are good to go. If you don’t, just download the agent package and follow the instructions. The only thing to keep in mind is that the default limit is 350 metrics per monitored instance. You can also automatically gather Docker logs if you want to have full visibility into your containers.
Want to see how Sematext stacks up? Check out our page on Sematext vs Datadog. You can also find more details on how they compare in our top alternatives to Datadog article.
4. Prometheus & Grafana
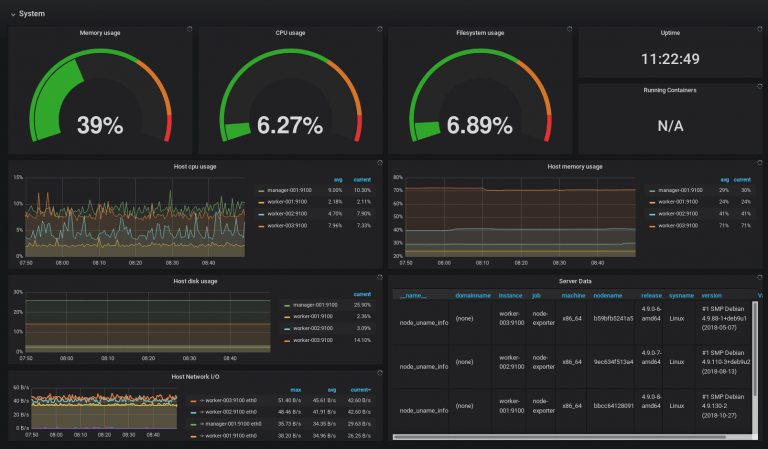
Several open-source tools are available for DIY-style container monitoring and logging. Typically container logs and metrics are stored in different data stores.
The ELK stack is the tool of choice for logs while Prometheus is popular for metrics.
The most well-known and widely-used popular dashboard tools are Grafana and Kibana. Grafana does an excellent job as a dashboard tool for showing data from a number of data sources including Elasticsearch, InfluxDB, and Prometheus.
However, in general, Grafana is really more tailored for metrics even though using Grafana for logs with Elasticsearch is possible, too. Grafana is still very limited for ad-hoc log searches but has integrated alerting on logs.
Depending on your metrics and logs data store choices you may need to use a different set of data collectors and dashboard tools. Vector and Prometheus are the most flexible open-source data collectors I’ve evaluated. Prometheus exporters need a scraper (Prometheus Server or alternative 3rd party scraper) or a remote storage interface for Prometheus Server to store metrics in alternative data stores.
Prometheus and Grafana is a powerful open-source combo that marries great flexibility with a backend providing great monitoring for Docker container metrics. However, keep in mind that an initial setup and configuration step – as well as ongoing upgrades, maintenance, etc. – will be required and may be time-consuming and thus costly, especially if you are not familiar with the tools.
[sematext_banner type=”infrastructure”]
5. Elasticsearch & Kibana
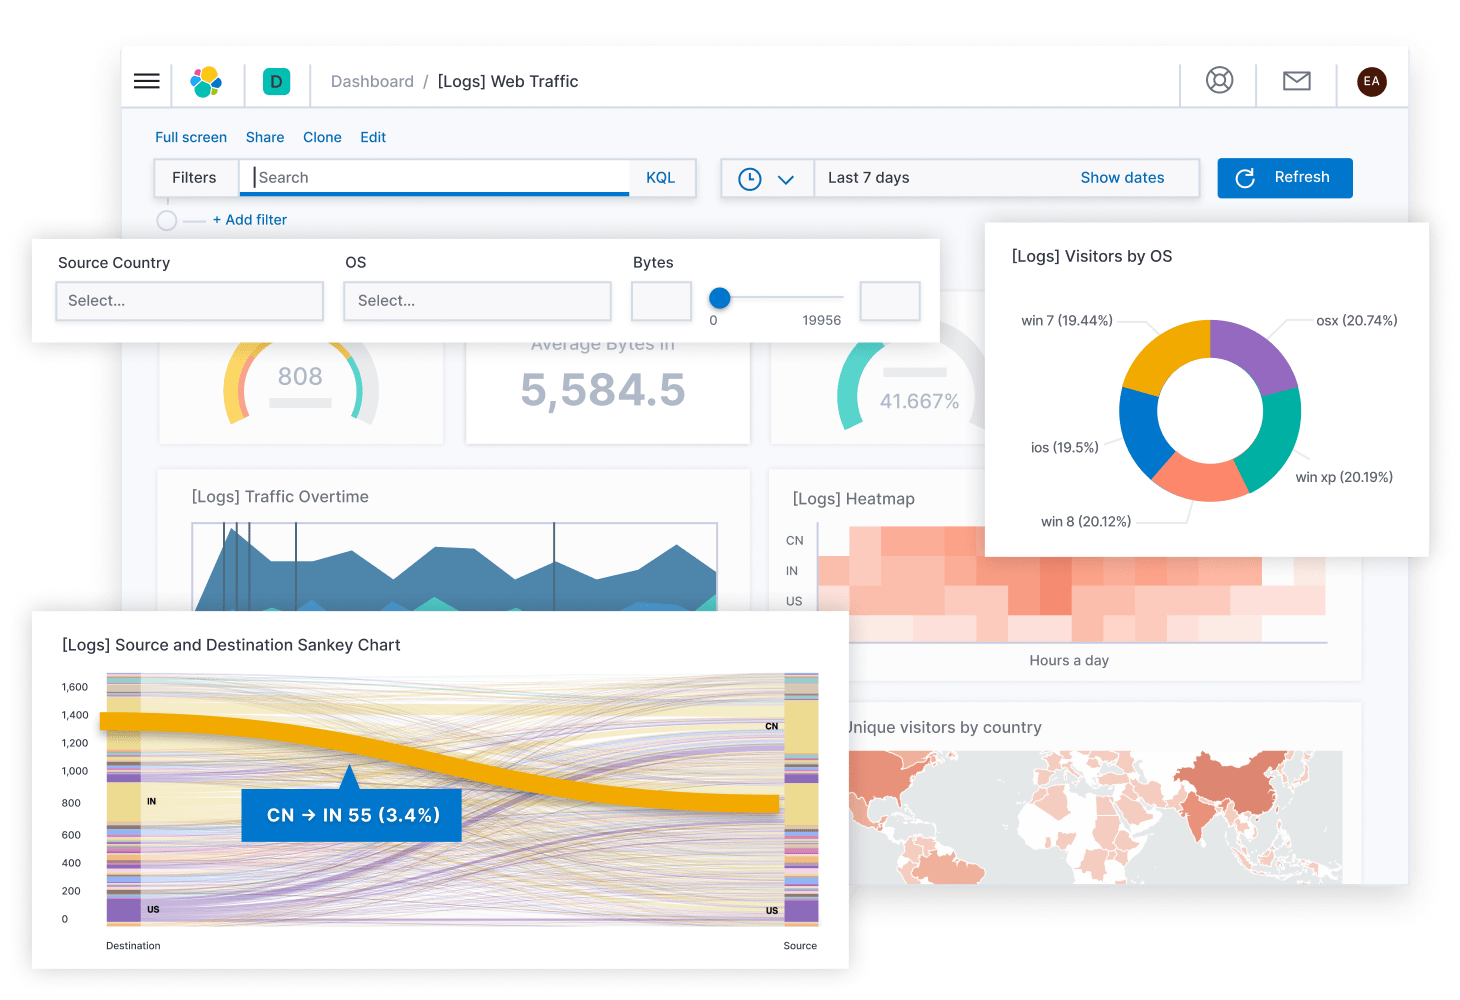
As mentioned above, while Prometheus is popular for metrics, the ELK stack is the tool of choice for logs.
Elasticsearch is a search engine based on the Lucene library. It provides a distributed, multitenant-capable full-text search engine with an HTTP web interface and schema-free JSON documents. Elasticsearch is developed in Java. Elasticsearch lets you store, search, and analyze with ease at scale.
Kibana is a free and open user interface that lets you visualize your Elasticsearch data and navigate the Elastic Stack. Do anything from tracking query load to understanding the way requests flow through your apps.
Kibana core ships with the classics: histograms, line graphs, pie charts, sunbursts, and more. And, of course, you can search across all of your documents.
Another powerful open-source combo – Elasticsearch and Kibana combine great flexibility with a backend providing monitoring for Docker container logs. However, just like with Prometheus and Grafana, the initial setup and configuration step – as well as ongoing upgrades, maintenance, etc. – will be required and may be time-consuming and thus costly, especially if you are not familiar with the tools.
6. SolarWinds Server & Application Monitor
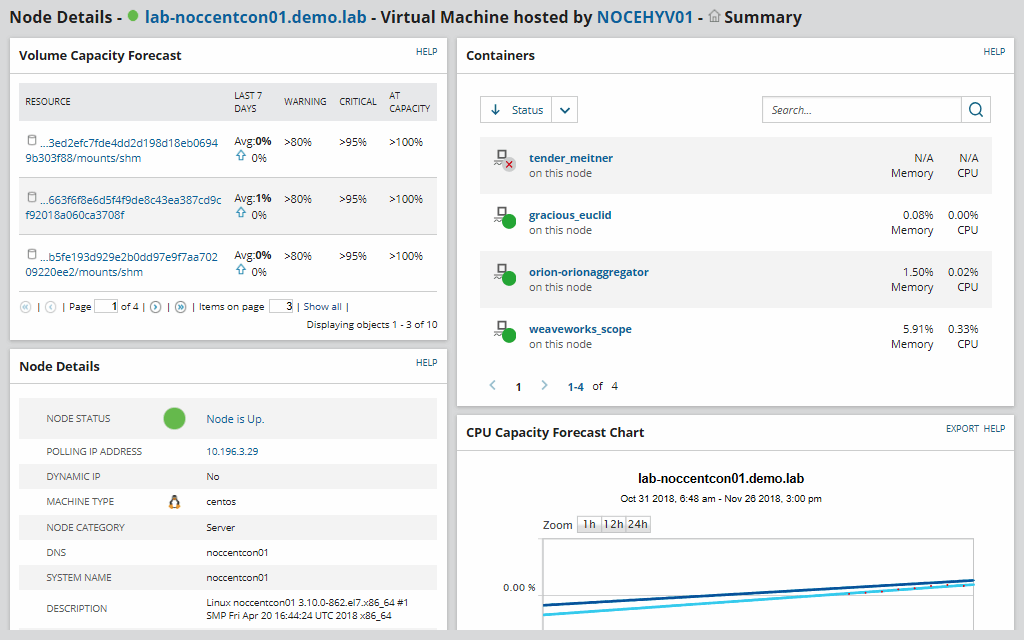
SolarWinds Server & Application Monitor provides monitoring for Docker containers. It gives you insight into Docker metrics alongside Windows and Linux metrics depending on the environment of your choice.
With alerting supported out-of-the-box and dashboarding capabilities the solution is a good candidate for monitoring not only Docker but your entire infrastructure.
7. AppOptics Docker Monitoring with APM
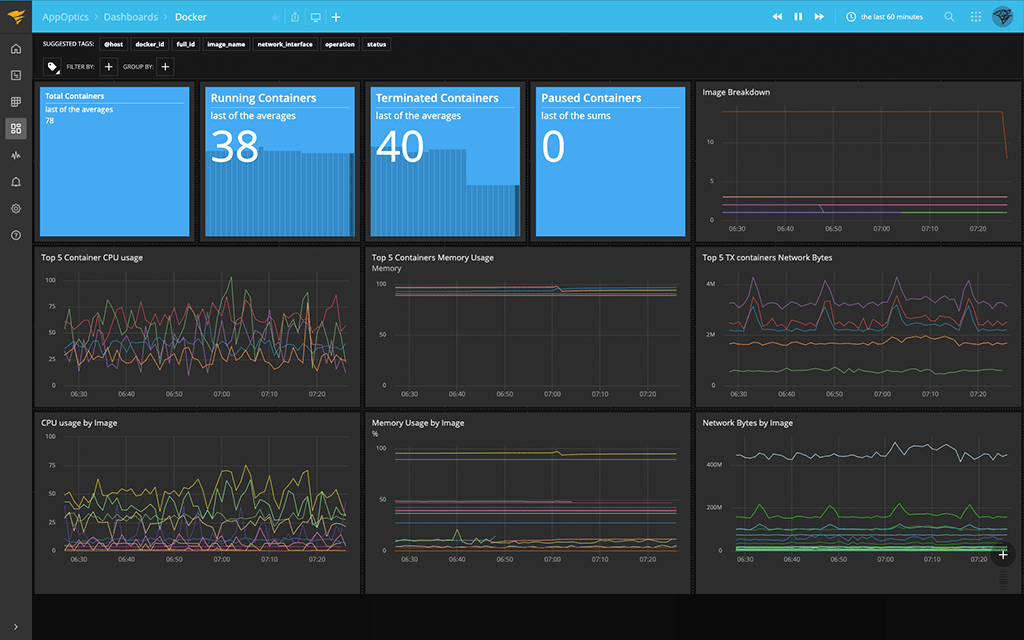
AppOptics is a full-stack APM that enables you to evaluate application performance and lets you see your containerized resources as well. With AppOptics you can spot performance issues quickly and identify whether they’re being caused by the containers or the code running in them.
AppOptics is now part of Solarwinds. The features you get from SolarWinds Server & Application Monitor and AppOptics are similar. You get an out-of-the-box Docker integration with efficient usage metrics, including CPU utilization, to provide the performance insights you need.
You can also configure alerts to send automatically when your Docker metrics exceed set thresholds.
8. cAdvisor
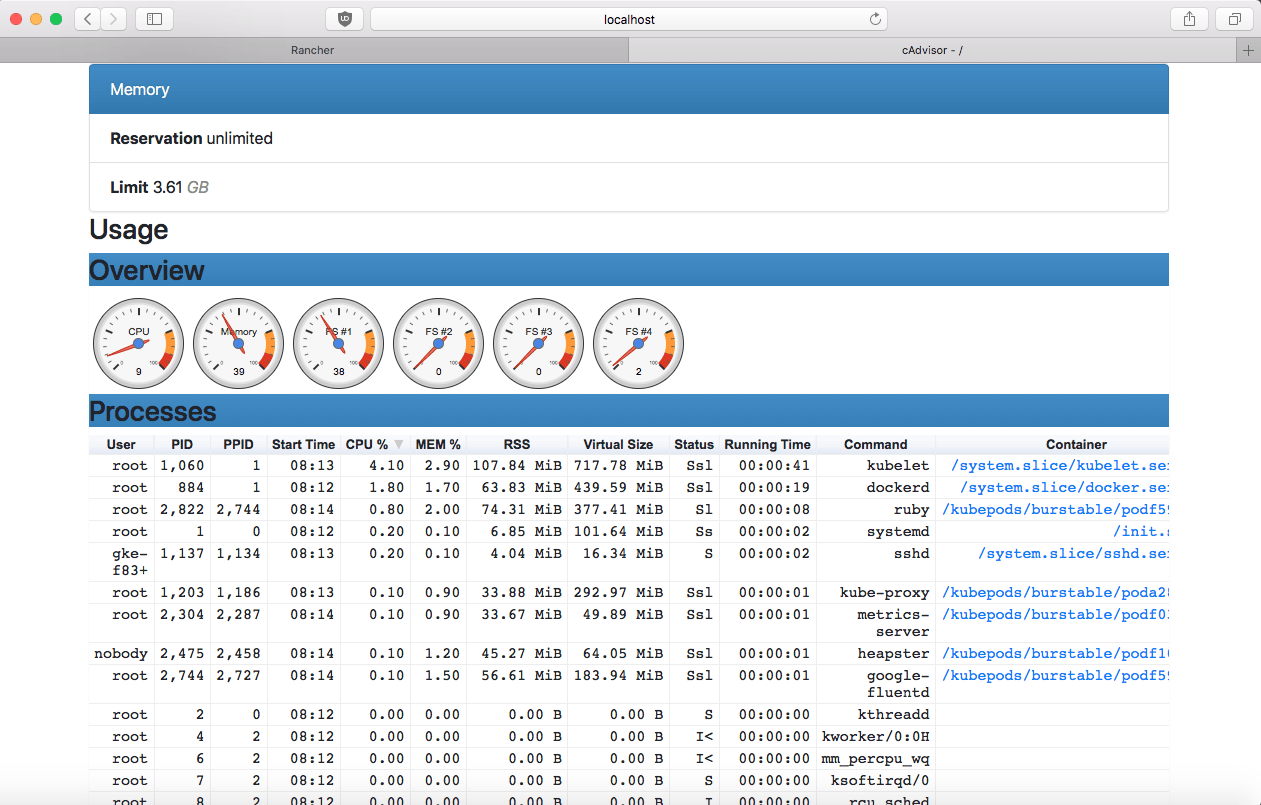
Short for container Advisor, cAdvisor is a neat open-source metrics collector created by Google to analyze and expose resource usage and performance data from running containers. It also exposes Prometheus metrics out of the box.
This means metrics are collected by cAdvisor, but scraped by Prometheus.
The Github repo says: “cAdvisor (Container Advisor) provides container users an understanding of the resource usage and performance characteristics of their running containers.”
In plain English, this means cAdvisor runs as a daemon and collects, aggregates, processes, and exports information about containers. It keeps resource isolation parameters, historical resource usage, histograms of complete historical resource usage, and network statistics for every container. This data is exported by container and machine-wide.
9. Sysdig
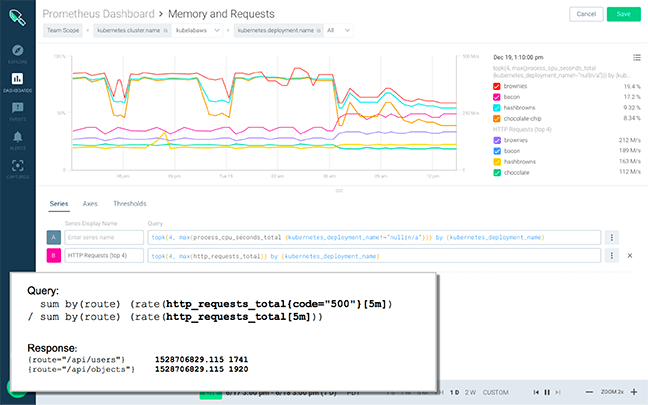
Sysdig allows you to maximize the performance and availability of your cloud infrastructure, services, and applications. It provides deep visibility into rapidly changing container environments.
You can resolve issues faster by using granular container data derived from actual system calls, which are enriched with cloud and Kubernetes context. Sysdig makes unifying data across teams for cloud monitoring a breeze.
Sysdig is the first commercially available cloud monitoring platform that is fully compatible with Prometheus. This gives developers a familiar tool without the management headache.
Reportedly, Sysdig can scale to millions of metrics with long-term retention and a single backend. Impressive!
10. ManageEngine Applications Manager
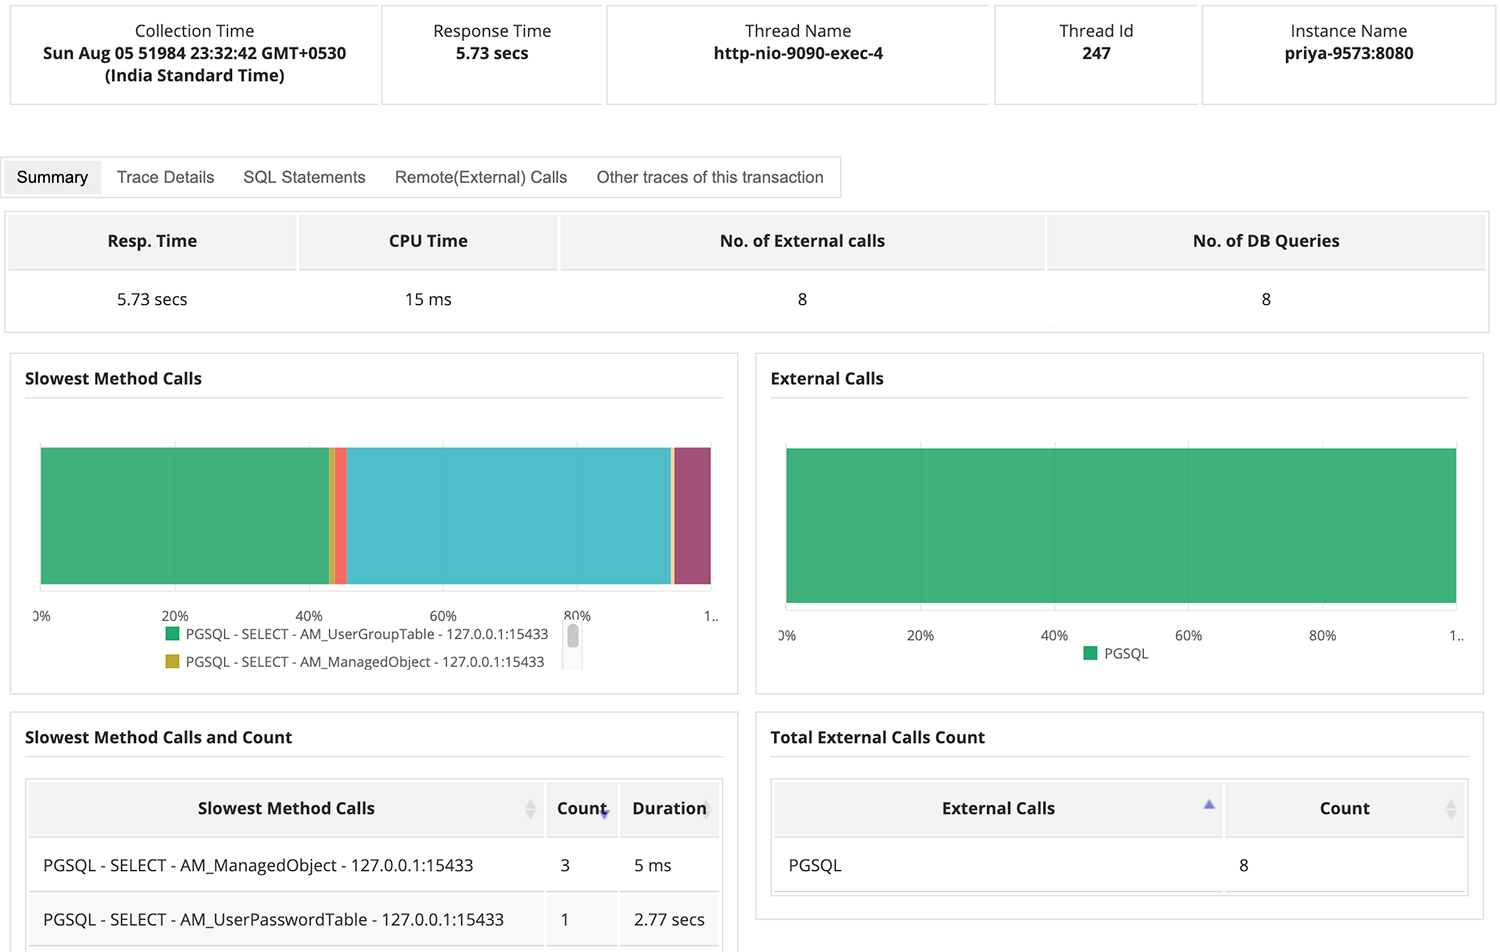
The Applications Manager is an APM feature within ManageEngine with native support for Docker monitoring. It helps you quickly find and fix performance issues across your entire application stack – from the URL to the line of code. You gain visibility into servers, VMs, databases – both on-premises and in the cloud.
It’s an integrated APM for all your server and application monitoring needs. Applications Manager offers proactive application monitoring services to measure the performance statistics in real time for comprehensive monitoring of your infrastructure.
Unlike other application monitoring tools, Applications Manager supports the widest range of over 100 popular technologies across servers, VMs, containers, application servers, databases, big data stores, middleware & messaging components, web servers, web services, etc.
This monitoring tool can scale up to 10,000 applications with easy setup, no training or consultation required to get your application monitor started.
11. Sumo Logic
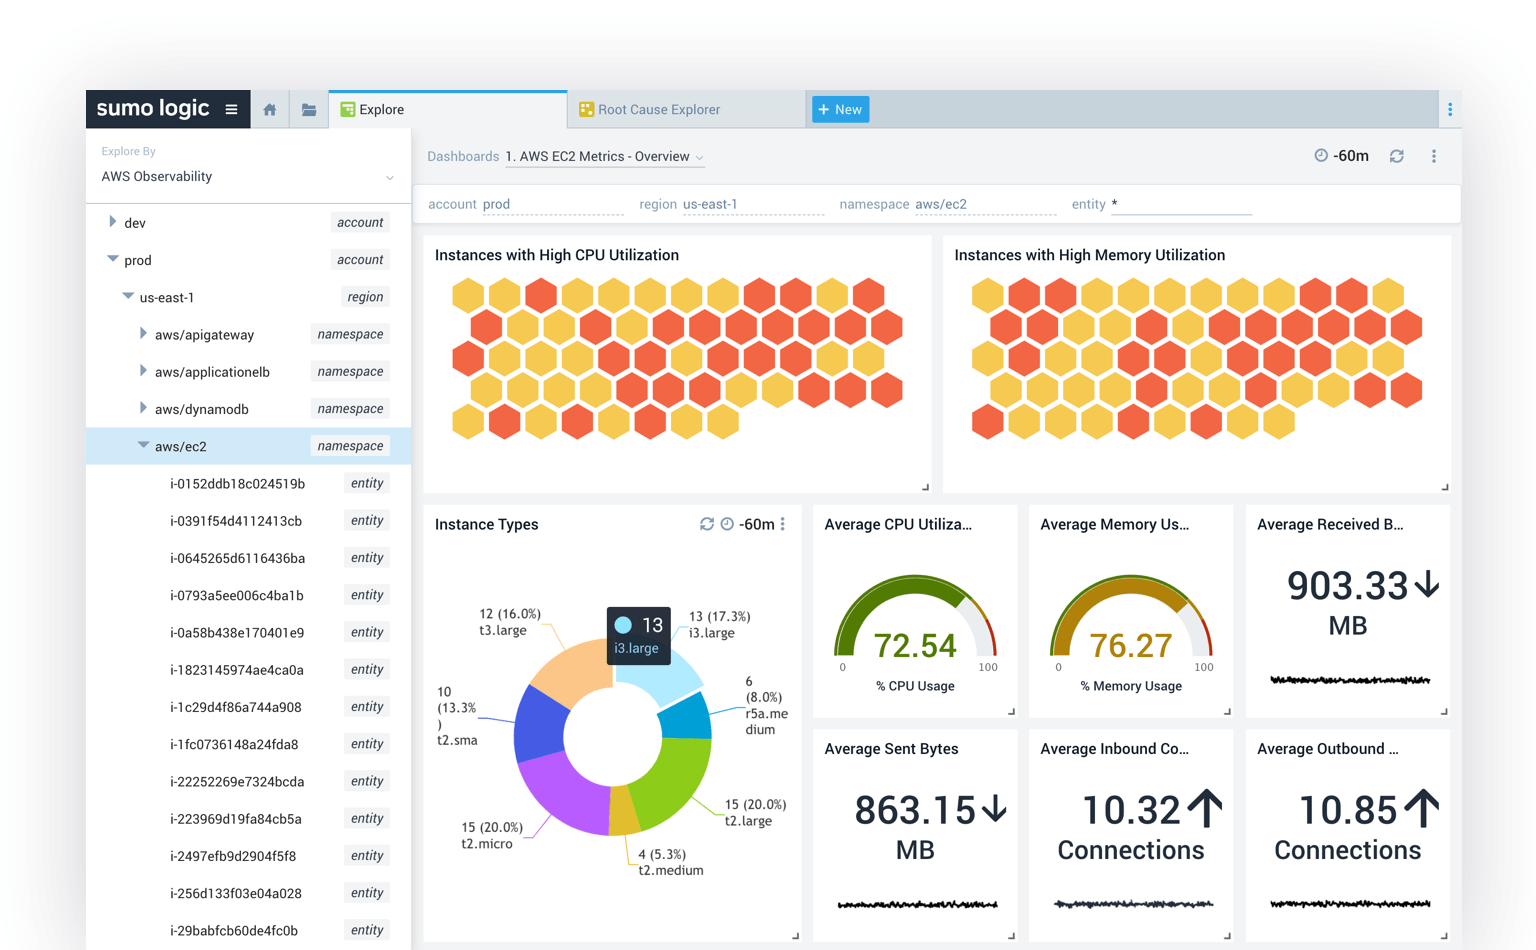
Sumo Logic is a monitoring system with more than 150 applications and integrations that make it easy to aggregate data across your stack and down your pipeline.
Sumo Logic’s integration for Docker containers enables troubleshooting and performing root cause analysis of issues surfacing from distributed container-based applications and from Docker containers themselves.
You get a native collection source for the entire Docker infrastructure, real-time monitoring of the Docker infrastructure, including stats, events, and container logs, the ability to troubleshoot issues and set alerts on abnormal container or application behavior, and much more.
You can then visualize this data with customizable dashboards and gain visibility across your entire infrastructure.
12. Splunk
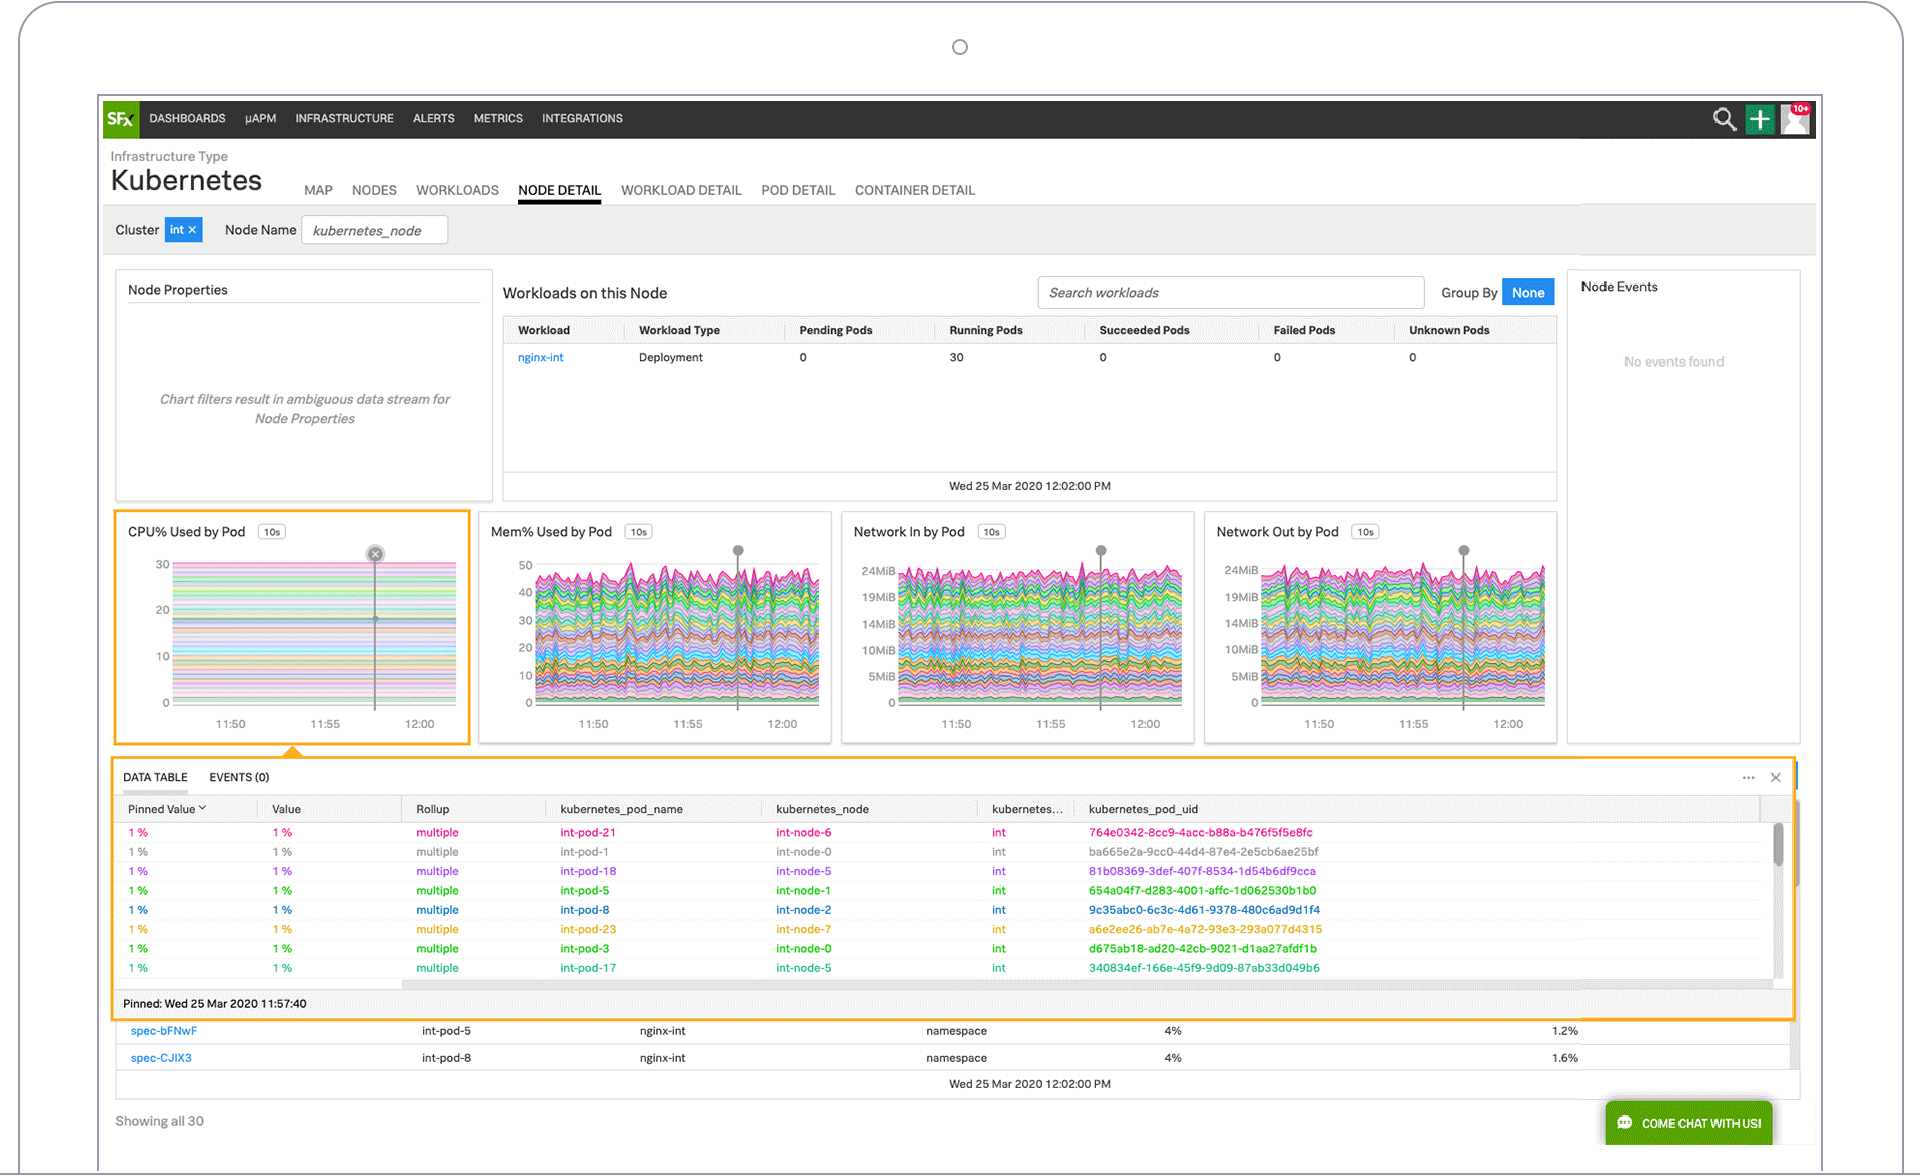
With Splunk, you can monitor Docker from host to container to application in a single dashboard. You can view infrastructure metrics by container, and compare the performance of an individual host to the population.
You can easily drill down into hosts to view infrastructure metrics by container, and compare performance on individual hosts. With Splunk you can also correlate performance metrics down to the specific container, and evaluate whether the application is impacted at the service level.
Splunk brings together different data about infrastructure, applications, and logs without context switching. You also get automatic discovery of Kubernetes components, letting you instantly monitor the entire stack.
Want to see how Sematext stacks up? Check out our page on Sematext vs Splunk.
How to Choose the Right Monitoring Tool for You
There are a few open-source container observability tools for logging, monitoring, and tracing you can use, and even more SaaS solutions. They all get the job done, it’s up to you to choose what you need and how much effort you want to put into maintenance.
If you need observability and it’s your team’s core competency, you’ll need to invest time into finding the most promising tools, learning how to actually use them while evaluating them, and finally install, configure, and maintain them. It would be wise to compare multiple solutions and check how well various tools play together. Here’s how I recommend choosing the best container monitoring tool for your use case:
Coverage of collected metrics
- Some tools only collect a few metrics, some gather a ton of metrics, which you may not really need, while other tools let you configure which metrics to collect. Missing relevant metrics can be frustrating when one is working under pressure to solve a production issue, just like having too many or wrong metrics will make it harder to locate signals that truly matter.
- Tools that require configuration for collection or visualization of each metric are time-consuming to set up and maintain. Don’t choose such tools. Instead, look for tools that give you good defaults and freedom to customize which metrics to collect.
- If you want to learn what container stats your tool of choice must be able to monitor, check out our blog post about key Docker metrics.
Coverage of log formats
- A typical application stack consists of multiple components like databases, web servers, message queues, etc. Make sure that you can structure logs from your applications. This is a key logging best practice to follow if you want to use your logs not only for troubleshooting, but also for deriving insights from logs. Defining log parser patterns with regular expressions or grok is time-consuming. It is very helpful having a library of existing patterns. This is a time saver, especially in the container world when you use official docker images.
Collection of events
- Any indication of why a service was restarted or crashed will help you classify problems quickly and get to the root cause faster. Any container monitoring tool should thus be collecting Docker events and Kubernetes status events if you run Kubernetes.
Correlation of metrics, logs, and traces
- Whether you initially spot a problem through metrics, logs, or traces, having access to all this observability data makes troubleshooting so much faster. A single UI displaying data from various sources is thus key for an interactive drill down, fast troubleshooting, faster MTTR and, frankly, makes DevOps‘ job more enjoyable.
Machine Learning capabilities and anomaly detection for alerting on logs and metrics
- Threshold-based alerts work well only for known and constant workloads. In dynamic environments, threshold-based alerts create too much noise. Make sure the solution you select has this core capability and that it doesn’t take ages to learn the baseline or require too much tweaking, training, and such.
Detect and correlate metrics with the same behavior
- When metrics behave in similar patterns, we typically find one of the metrics is the symptom of the root cause of a performance bottleneck. A good example I’ve seen in practice is high CPU usage paired with container swap activity and disk IO – in such a case CPU usage and even more disk IO could be reduced by switching off swapping for containers. For system metrics above the correlation is often known – but when you track your application-specific metrics you might find new correlation and bottlenecks in your microservices to optimize.
Single sign-on
- Correlating data stored in silos is impossible. Moreover, using multiple services often requires multiple accounts and forces you to learn not one, but multiple services, their UIs, etc. Each time you need to use both of them there is the painful overhead of needing to adjust things like time ranges before you can look at data in them in separate windows. This costs time and money and makes it harder to share data with the team.
Role-based access control
- Lack of RBAC is going to be a show-stopper for any tool seeking adoption at corporate level. Tools that work fine for small teams and SMBs, but lack multi-user support with roles and permissions almost never meet the requirements of large enterprises.
Total cost of ownership
When planning the setup of open-source monitoring people often underestimate the amount of data generated by monitoring agents and log shippers.
- Most organizations underestimate the resources needed for processing, storage, and retrieval of metrics and logs as their volume grows.
- A common issue is often underestimating the human effort and time that will have to be invested into ongoing maintenance of the monitoring infrastructure and open-source tools. This causes not only the cost of the infrastructure for monitoring and logging to spike beyond anyone’s predictions but so does the time and thus money required for maintaining the infrastructure.
- You can mitigate this by limiting data retention. This requires fewer resources, less expertise to scale the infrastructure and tools and thus less maintenance, but this of course limits visibility and insights one can derive from long-term data.
- Infrastructure costs are only one reason why there are storage limits for metrics, traces, and logs. For example, InfluxDB has no clustering or sharding in the open-source edition, and Prometheus supports only short retention time to avoid performance problems.
- Another approach is reducing the granularity of metrics from 10-second accuracy to a minute or even more. This is called sampling. This can cause other problems like having less accurate information with less time to analyze problems, and limited insight into issues, and historical trends.
- You can totally avoid these issues by choosing a SaaS tool that handles everything for you. The only thing you need to do is send data and you get to sleep at night without worrying.
Microservices distributed transaction tracing
Until now we’ve only discussed monitoring and logging, completely ignoring distributed transaction tracing as the third pillar of observability for a moment.
Keep in mind that as soon you start collecting transaction traces across microservices, the amount of data will vastly increase. This further increases the total cost of ownership of a self-hosted monitoring setup.
Note that data collection tools mentioned in this post only handle metrics and logs, not traces. For more on transaction tracing and OpenTracing-compatible tracers see our Jaeger vs. Zipkin blog post.
Similarly, the dashboard tools I covered here don’t come with data collection and visualizations for transaction traces. This means that you need a third set of tools to set up distributed transaction tracing!
Wrap Up!
No matter how many Docker containers you’re running, monitoring is key to keeping your app up and running and your users happy. For that, DevOps engineers need well-integrated monitoring, logging, and tracing solutions with advanced functionality like correlating between metrics, traces, and logs.
The saved costs of engineering and infrastructure required to run in-house monitoring can quickly pay off. Adjustable data retention times per monitored service help optimize costs and satisfy operational needs. This results in a better user experience for your DevOps team, especially faster troubleshooting which minimizes the revenue loss once a critical bug or performance issue hits your commercial services.
While developing Sematext Cloud, we had the above ideas in mind with the goal to provide a better container monitoring solution. You can read more about it in Part 3 of this Docker Monitoring series, Docker Container Monitoring with Sematext, or simply try the 14-day free trial to see for yourself
And lastly, if you’re using Kubernetes as orchestrator for your Docker containers, you’ll need to monitor that as well. If you’re new to it, our Kubernetes logging and Kubernetes monitoring tutorials will help you understand the intricacies of Kubernetes logs and metrics, which is essential to setting up a comprehensive monitoring strategy that covers all your bases.
You might also be interested in: