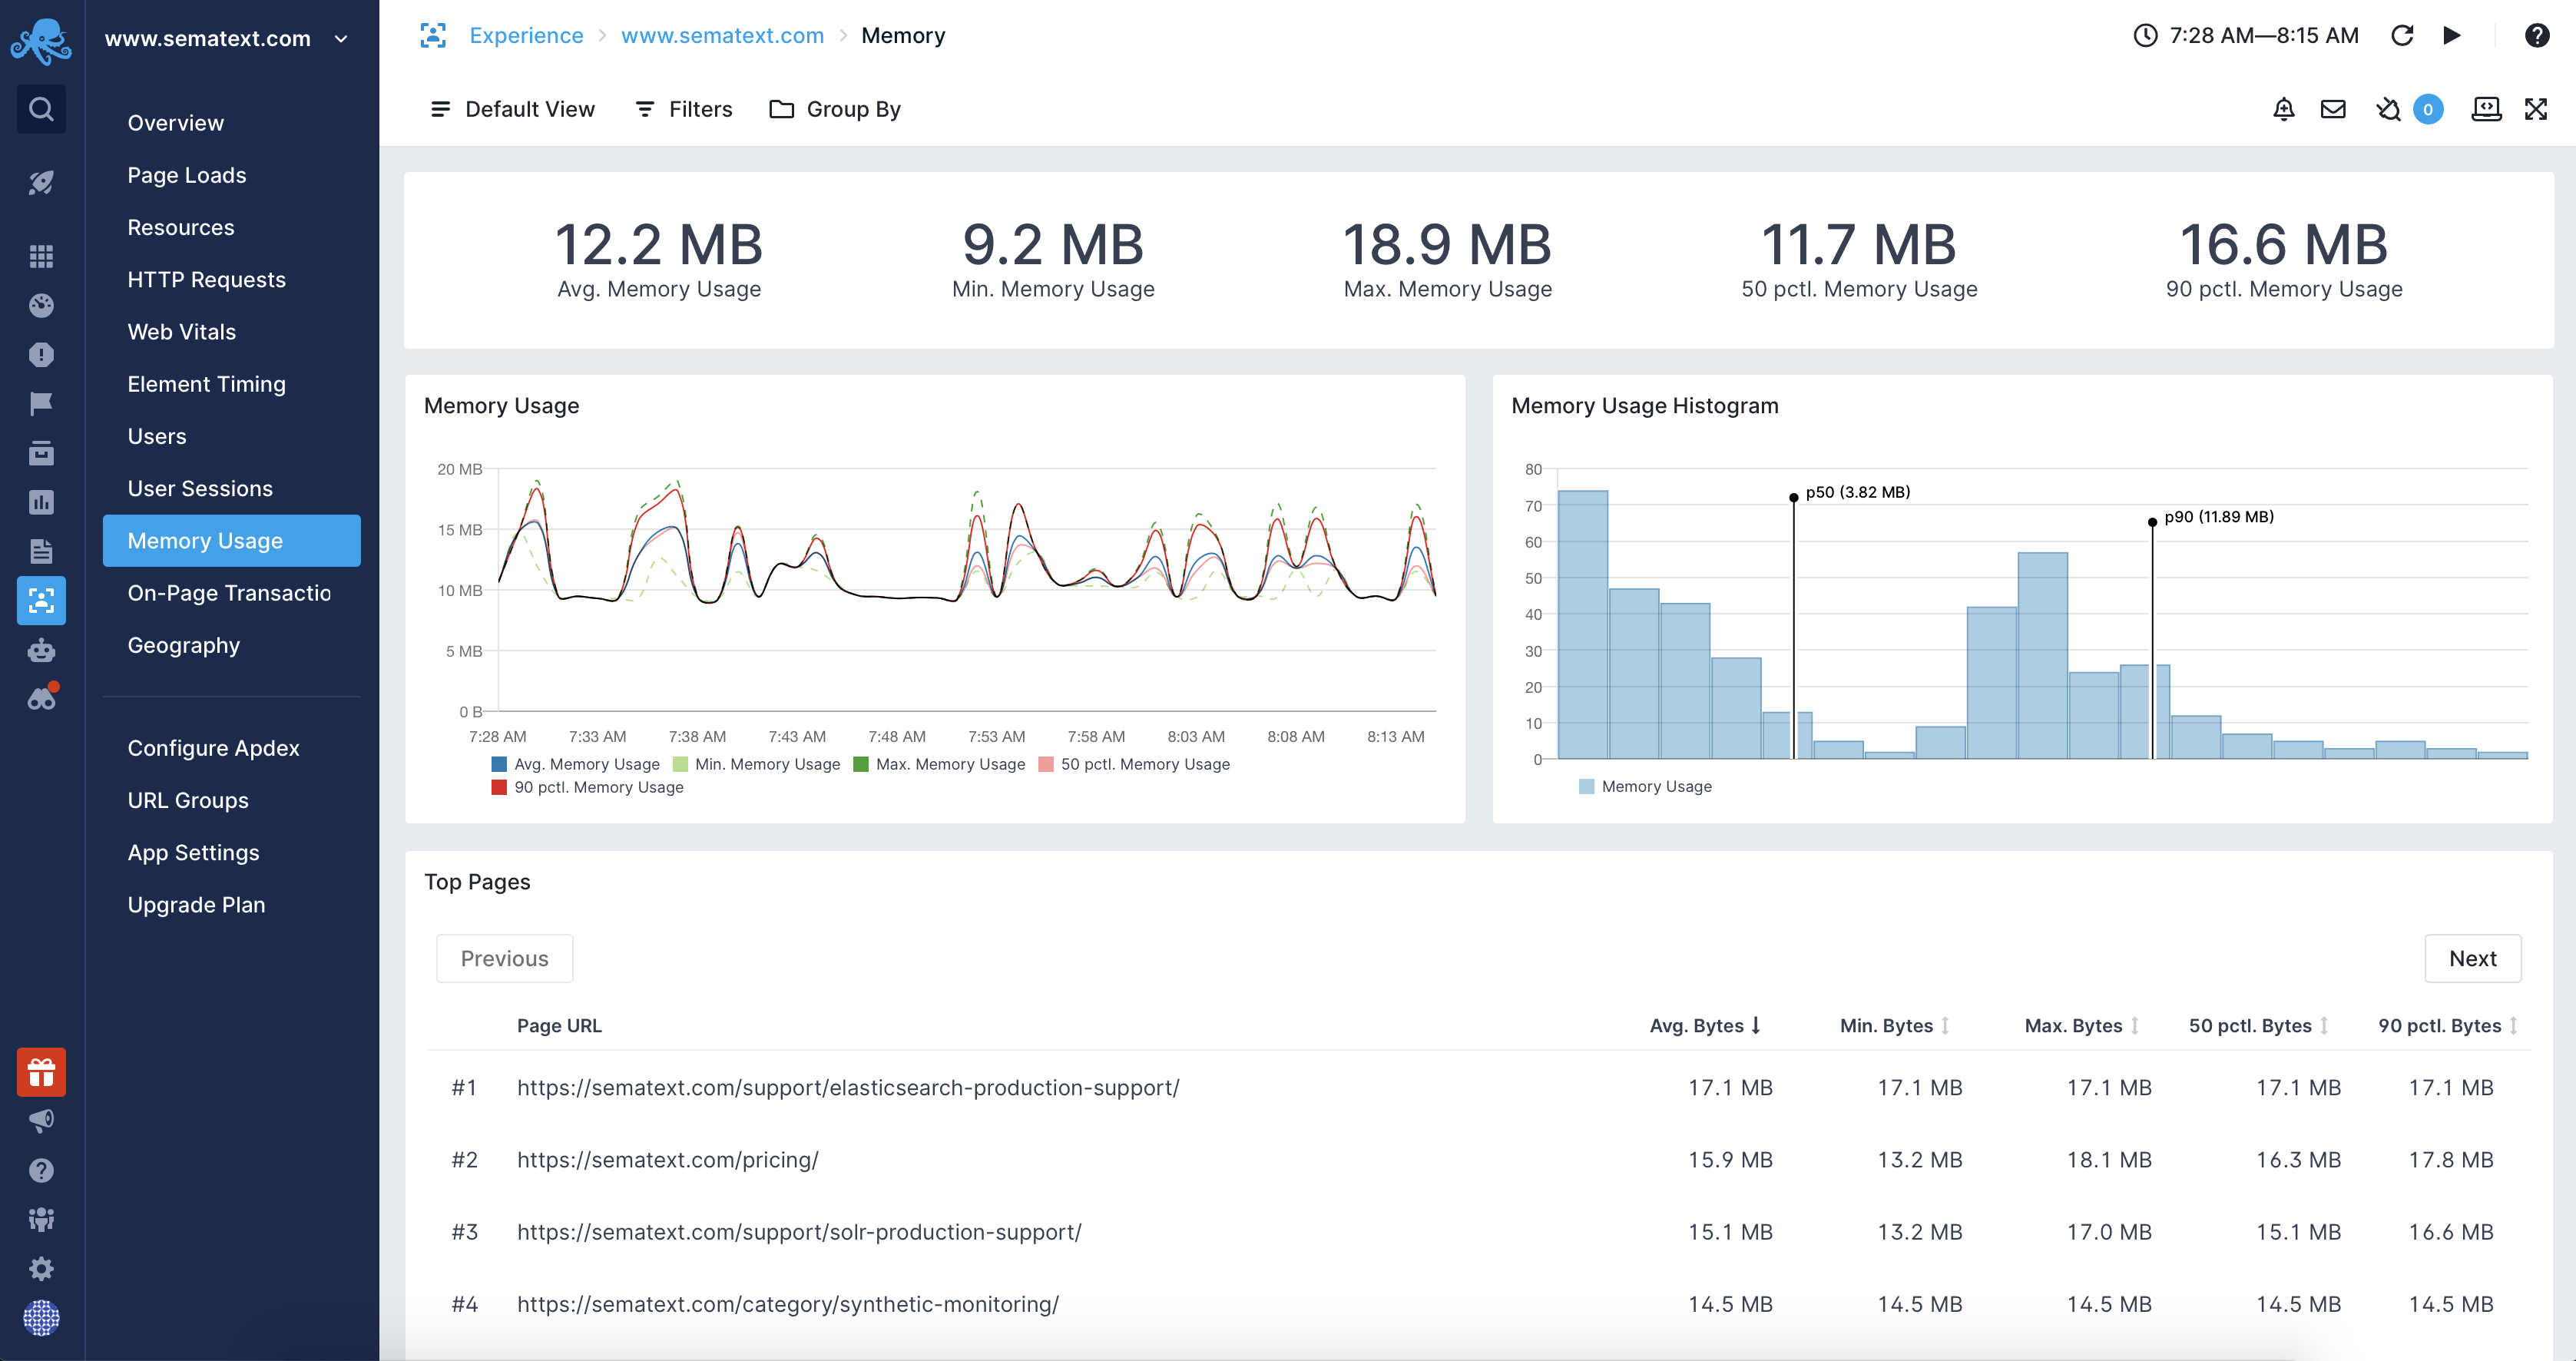
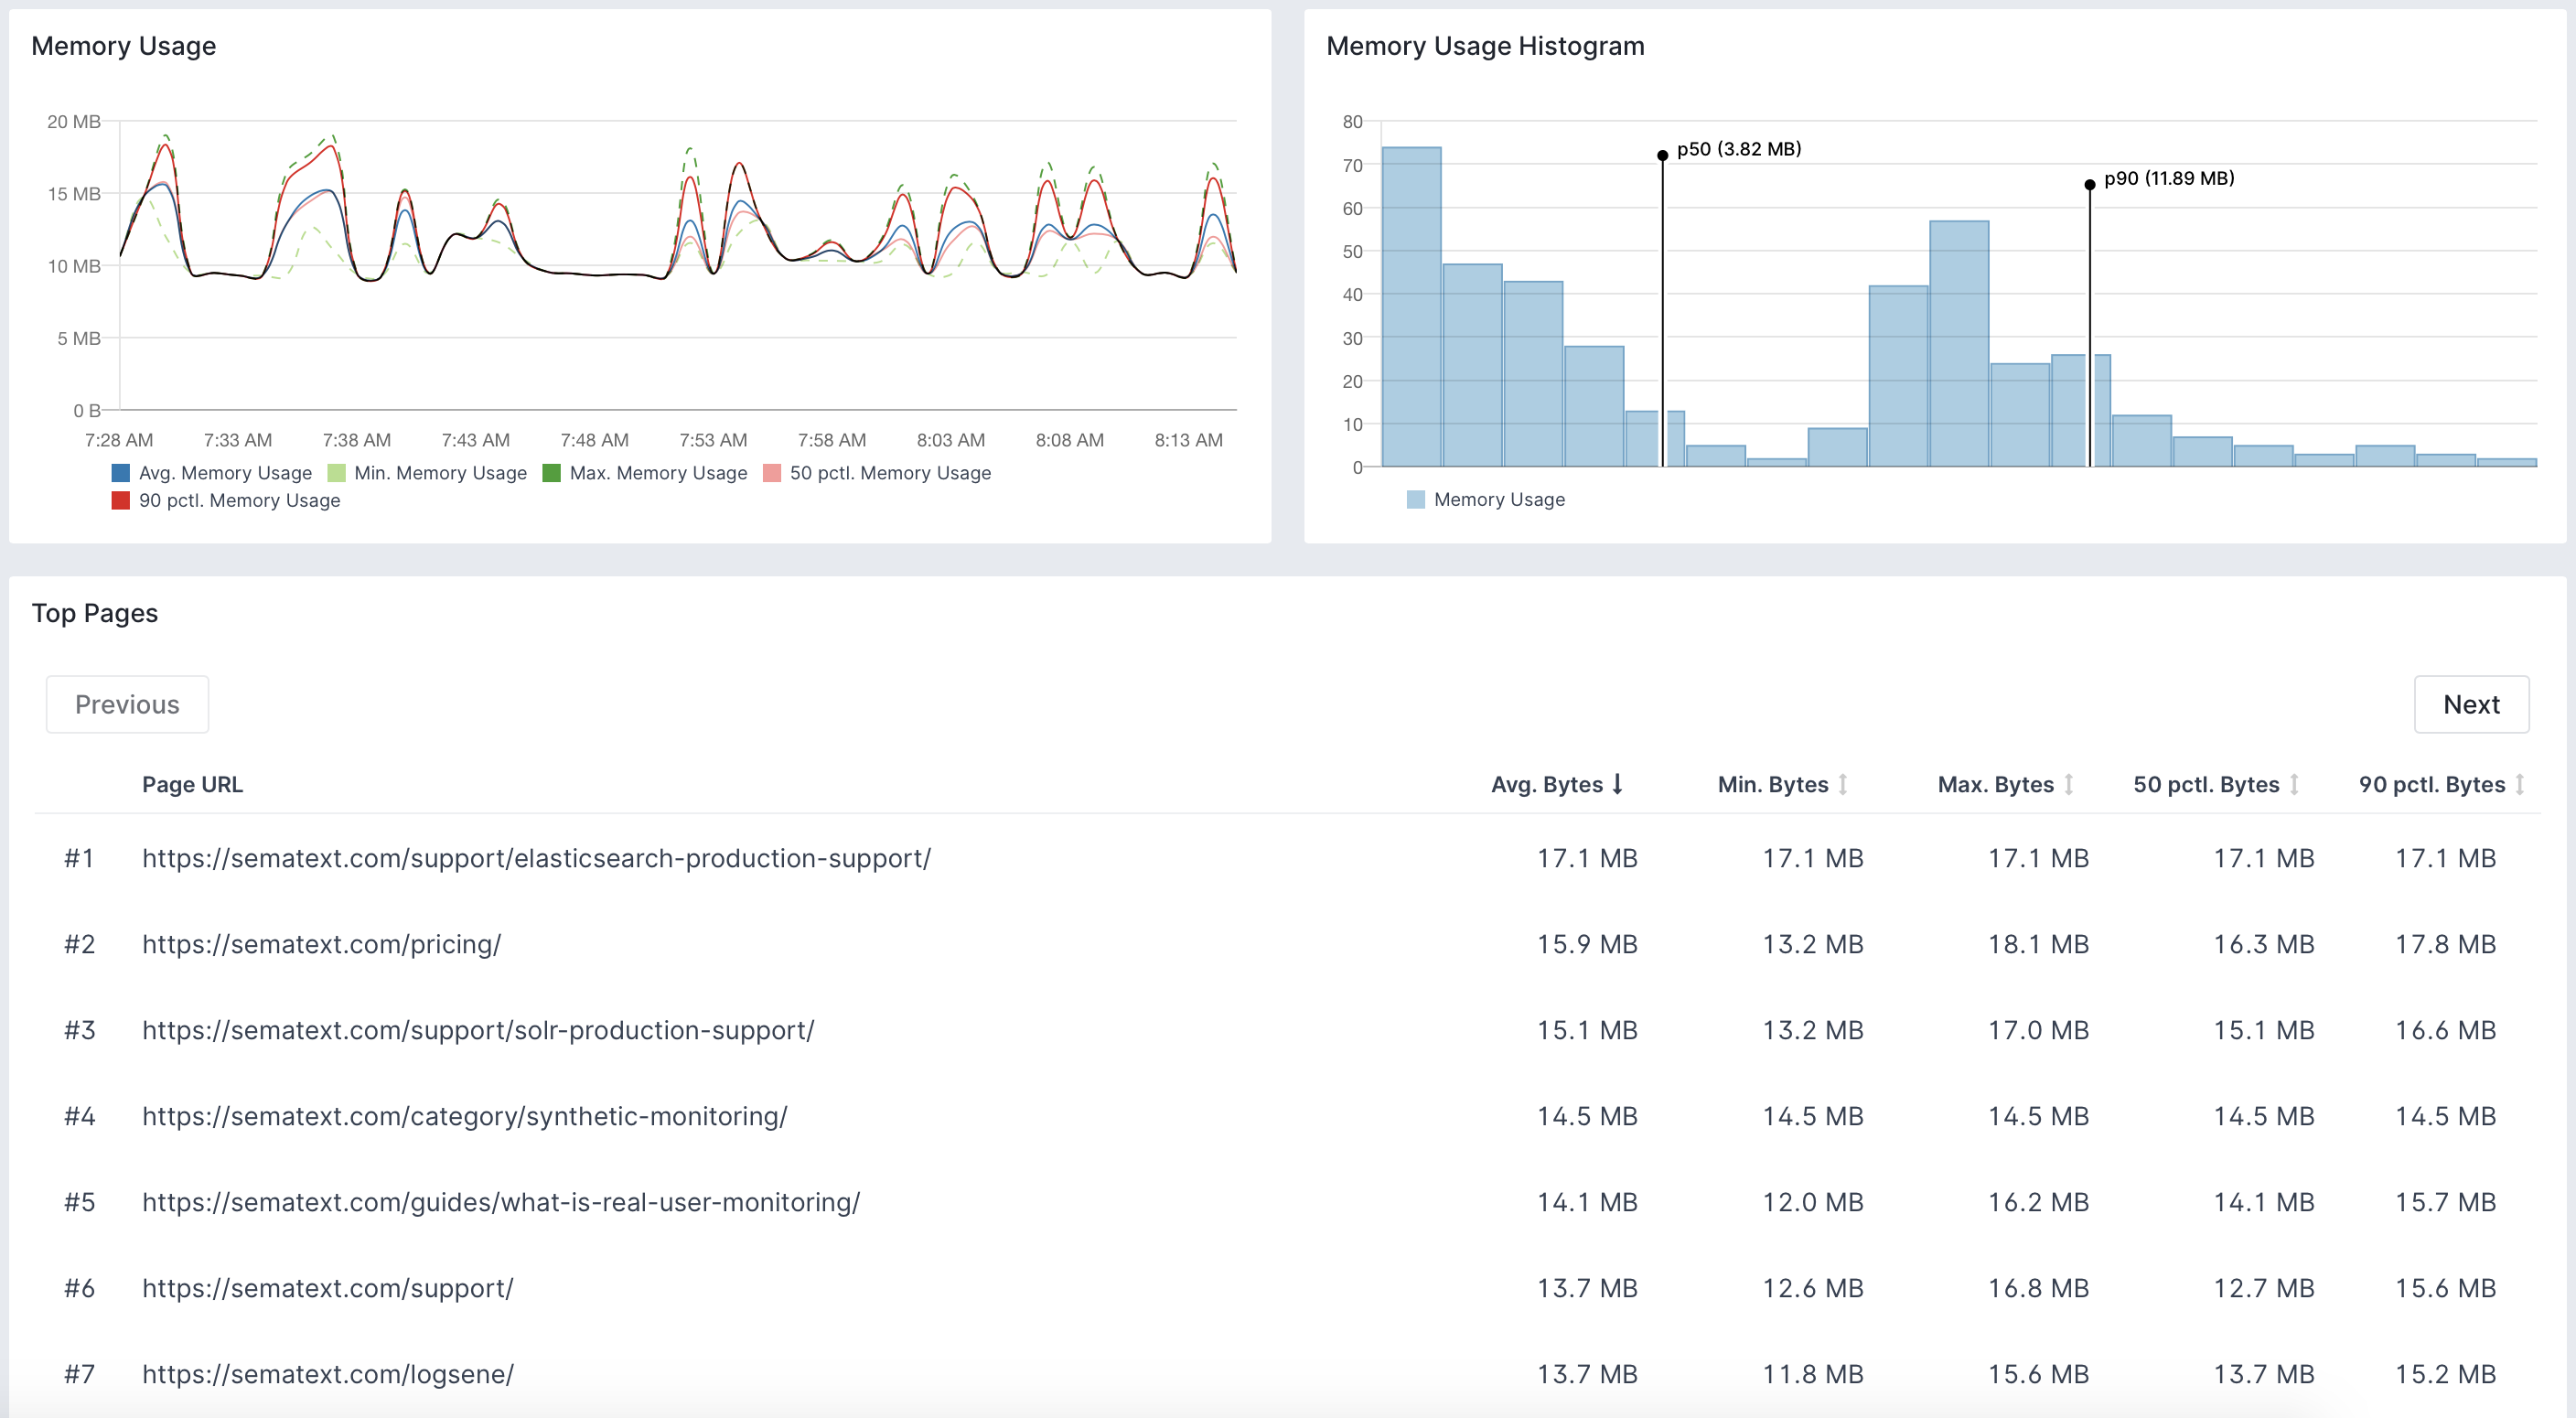
Browser Memory
Browsers manage the memory used by web pages automatically without user interaction. Sematext Experience allows monitoring the memory usage for your web pages to identify issues, regressions, and give you an estimate of the memory needed by your applications.

Limitations
The memory measurement is enabled by default starting with Chrome 89, but only for web pages that are cross-origin isolated. Your website can achieve that state by sending the following headers in the main document:
You can determine if your website is cross-origin isolated by using:
If the website is not cross-origin isolated the memory measurement API will not be available and the measurements will not be visible in your Experience App.
Use Cases
There are many use cases where having insight into the browser's memory usage can be crucial to identify and fix problems as soon as possible. Those include:
- Identifying memory leaks in Single Page Applications
- A/B testing of memory usage between different application versions
- Measuring memory impact of new features or optimizations done to the application code
- Statistical analysis of memory usage across the web application

Measurements
Sematext Experience Browser SDK uses the Memory Measure API to measure browser memory usage when your web application is loaded and continues to measure the memory throughout the user session. This allows for memory measurements across pages and sessions. It even shows the per-session memory usage that individual users of your applications are experiencing.

Supported Browsers
At the moment, the only web browser that supports memory usage measurements is Chrome. The memory usage measurement feature was under Chrome Origin Trials until 13th January 2021 and is available to all users starting with Chrome 89.
Identifying Resources Affected by Cross-Origin Isolation
Before enabling the cross-origin isolation headers we encourage you to check which resources used by your website will be affected by the new security policy. To do that you can include additional reporting headers to the main document of your website. Those headers are:
Cross-Origin-Opener-Policy-Report-Only: same-origin
Cross-Origin-Embedder-Policy-Report-Only: require-corp
You can either configure your webserver to save the reports or open Chrome and its developer tools and add the Domain column in the Network panel to see which resources may be affected. The following example shows that the jquery-3.3.1.min.js file is retrieved from an external domain and will be blocked:

Mitigating the Impact of Cross-Origin Isolation For Resources
Once the affected resources are identified you can add the crossorigin attribute to the HTML tags that will be served with the Cross-Origin-Resource-Sharing, simply CORS. You can for example do the following:
For iframes you can use the allow="cross-origin-isolated" attribute.
Potential Problems
The current implementation of the cross-origin isolation is known to cause issues with integrations that require cross-origin window interactions such as various payment providers and OAuth authorization. There is work in progress aimed at mitigating that problem by relaxing the strictness of the cross-origin isolation policies, so the situation may change in the future versions on Chrome.
Learn more about the Cross-Origin-Embedder-Policy and the Cross-Origin-Resource-Policy headers.