Whether you capture them for application security and compliance, production monitoring, performance monitoring, or troubleshooting, logs contain valuable information about the health of your apps. But it all comes down to what and how you log, which is where log management tools come into play. Log centralization and log analysis give you a real-time view of how your applications and systems are being used by your users and provide deeper insights and opportunities you can leverage to improve the code quality, increase efficiency, mitigate risks and offer a better customer experience.
Whether you’re looking for free, open-source, or commercial, we’ve reviewed the best log management and monitoring tools and software to help you get started. Regardless if they’re on-premises or cloud-based, paid log management and monitoring tools aim to offer end-to-end functionality for all your logging needs. Here are the ones that we’ve found are the best in their field:
1. Sematext Logs
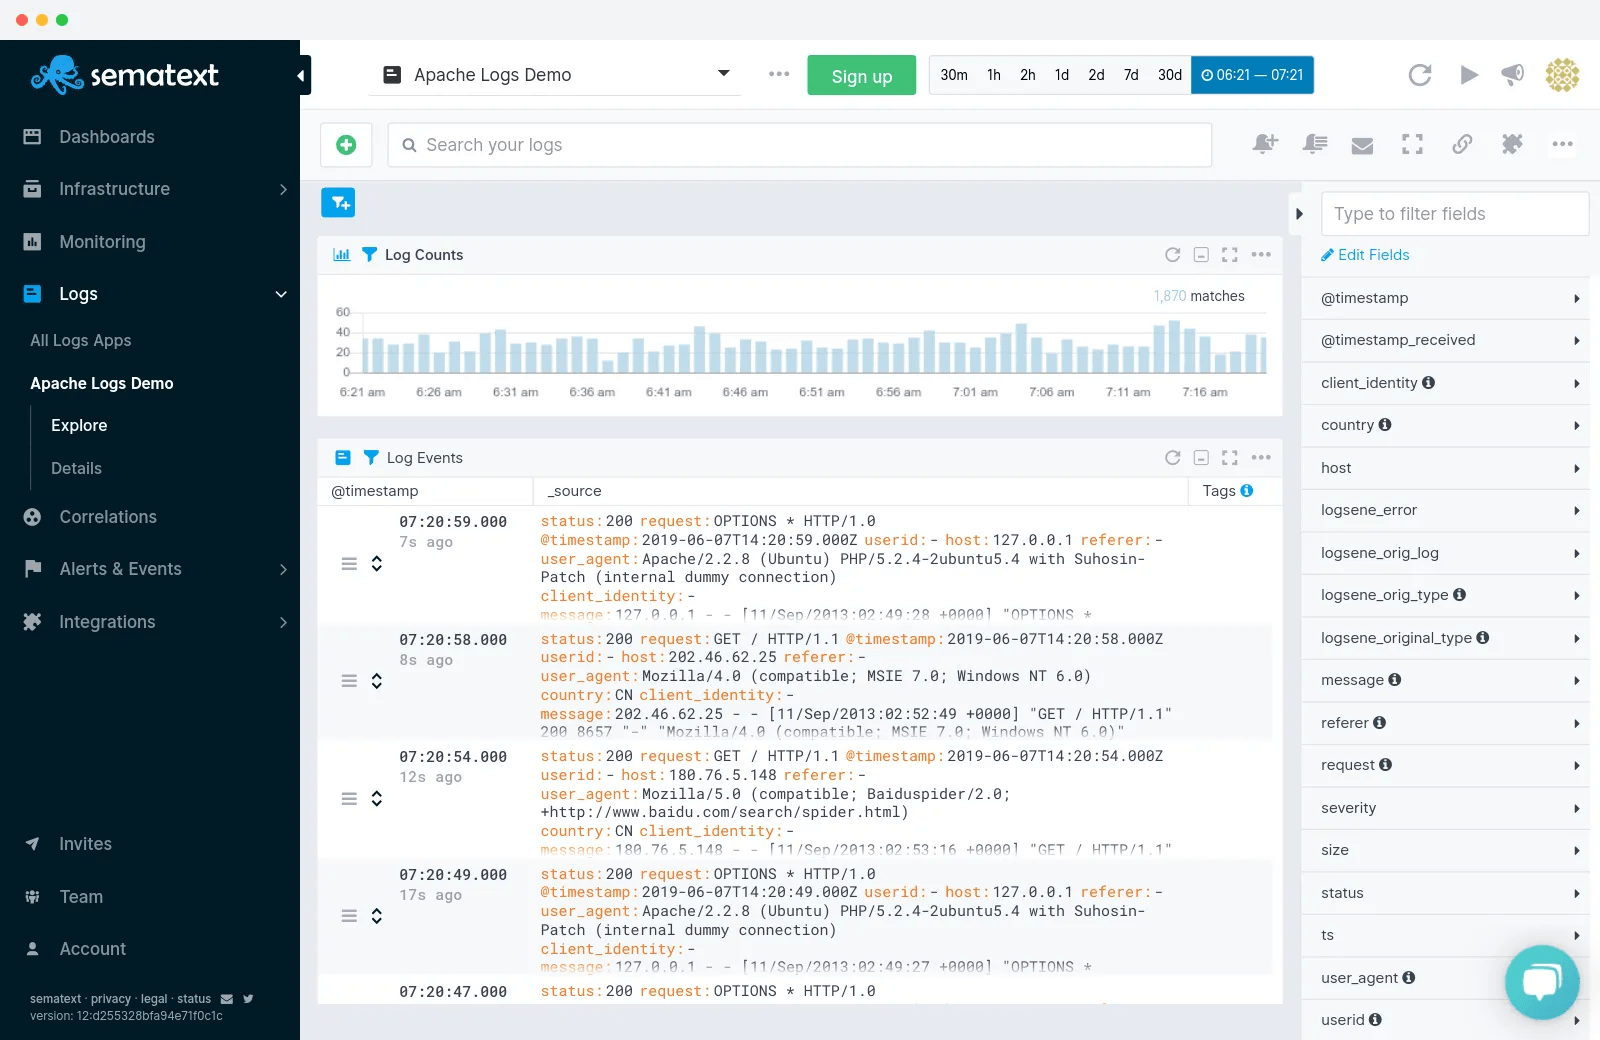
Sematext Logs is a log management system that exposes the Elasticsearch API, part of the Sematext Cloud full-stack monitoring solution. You can send data using syslog or any tool that works with Elasticsearch, such as Logstash or Filebeat. Visualizing can be done with Kibana or the native Sematext Logs UI.
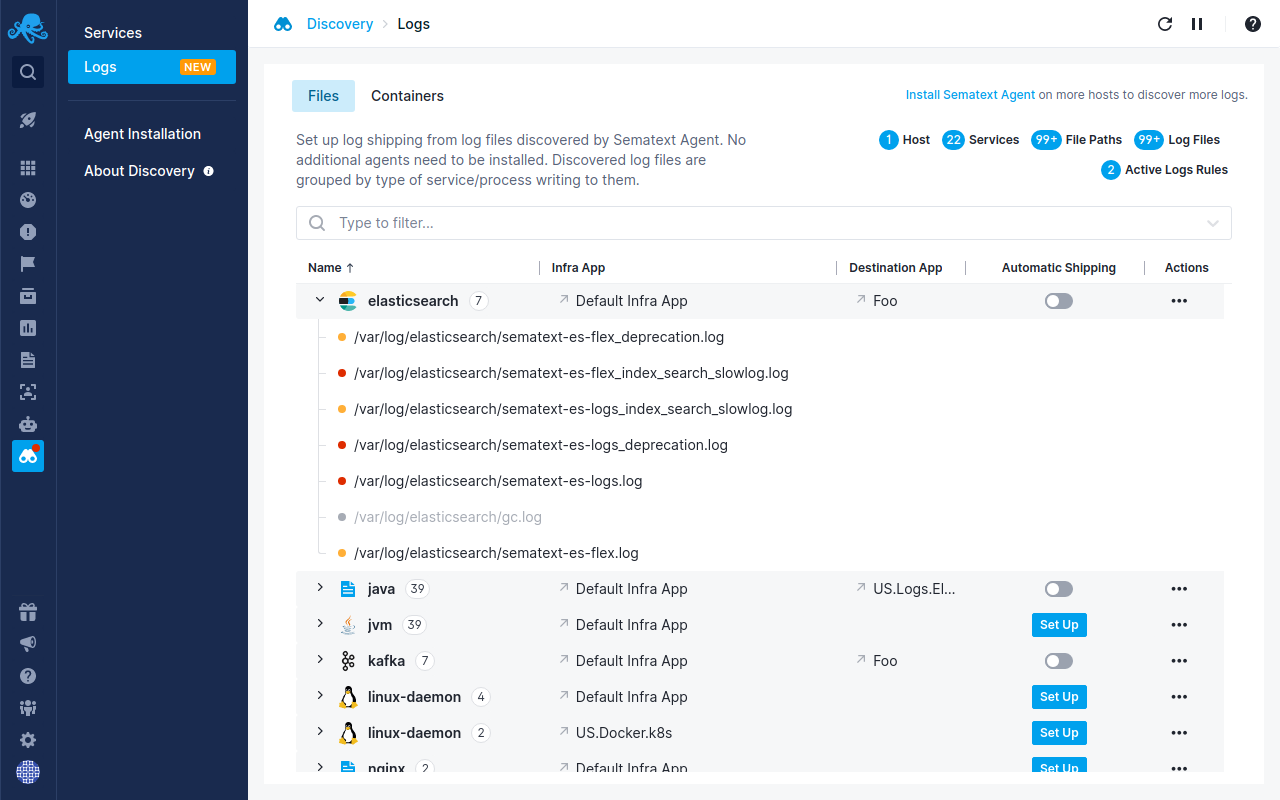
Sematext’s auto-discovery of logs and services lets you automatically start monitoring logs and forwarding them from both log files and containers directly through the user interface.
Key Features:
- Agent-free: any log shipper or library that works with syslog or Elasticsearch will work with Sematext Logs
- Elasticsearch API access beyond indexing: you can run searches, export data, create custom templates, and more
- Extra features on top of the ELK stack are available, such as role-based access control, alerting, and anomaly detection
Pricing:
- Free: 500MB per day
- Paid plans start at $50/month (1GB/day, 1-week retention)
Pros:
- Fully hosted: get all the flexibility of the ELK stack without having to manage/scale Elasticsearch
- Integration with other Sematext Cloud components, such as Infrastructure Monitoring, Synthetics and Experience. For example, you can have dashboards with widgets from any component, so you can see which error caused that CPU spike
- Spike-friendly pricing. Ingestion is averaged out and calculated on top of the “base” plan. For example, if you have the cheapest paid plan ($50/month, supports 1GB/day) and send 60GB in a month (2GB per day, on average), you end up paying $100
- Configurable overage – you can choose when Sematext stops accepting logs, to control your cost
- Per-silo pricing. You can create multiple “apps”, for example, Production and QA. Each can have its own plan (volume, retention) and overage configuration
Cons:
- Currently, Sematext Logs only parses Syslog and JSON on the server side. Custom parsing has to be done in the log shipper
- You can’t mix Kibana and native UI widgets in the same dashboard
[review_banner cite=”G2 Reviewer – Software engineer”]Sematext simply turns your logs into actionable data[/review_banner]
If you’re interested in learning more about its analysis features, we went into detail in our articles about the best log analysis tools and the top cloud logging services. We have also created a dedicated page for the best log monitoring tools and software. Check them out if you’re into that! Or, check out the short video below on Sematext Logs.
2. Splunk
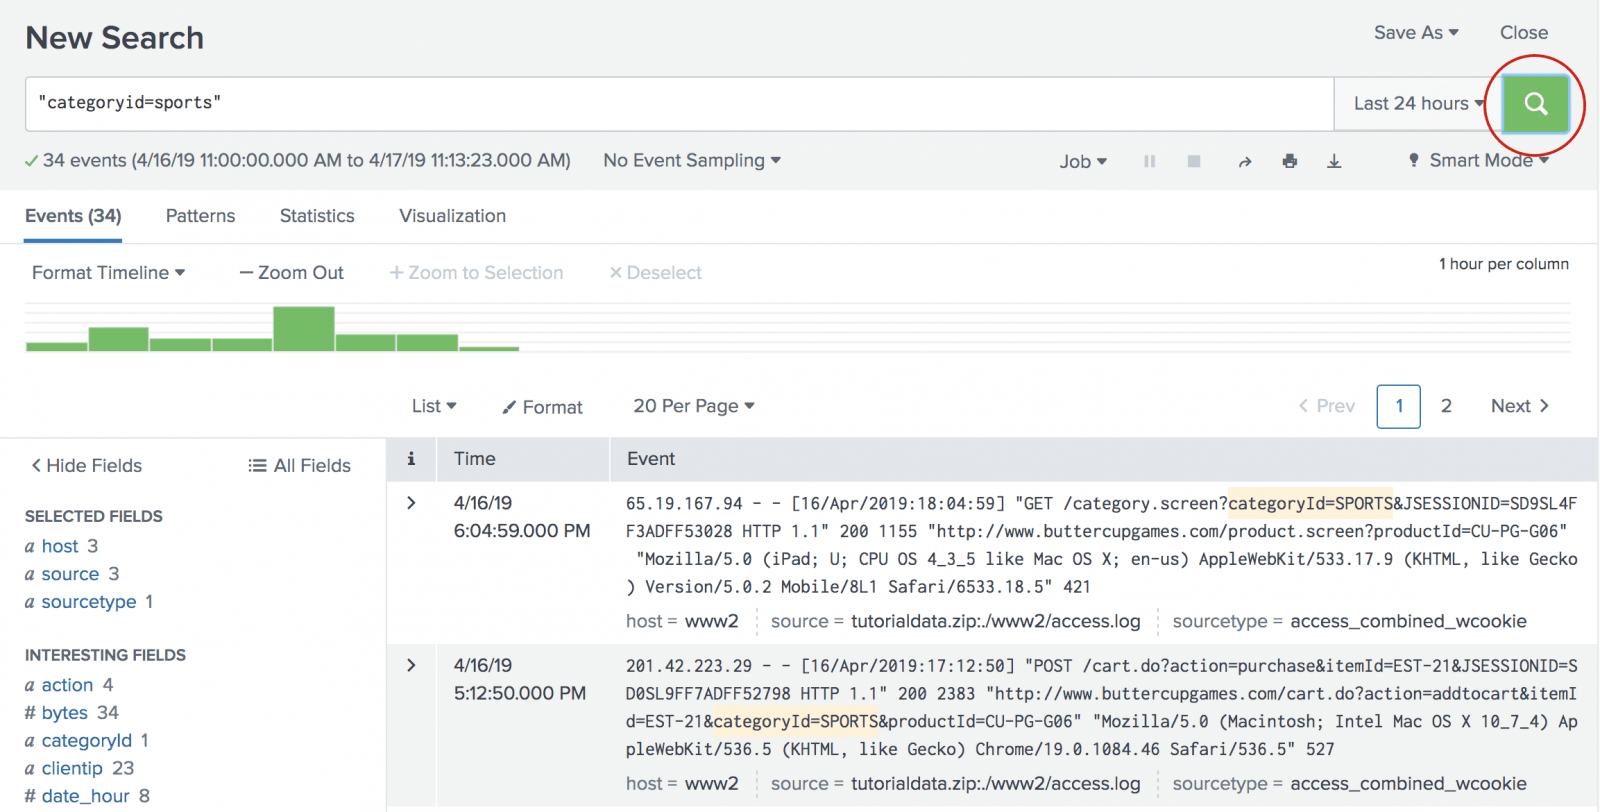
Splunk is one of the first commercial log centralizing tools, and the most popular. The typical deployment is on-premises (Splunk Enterprise), though it’s also offered as a service (Splunk Cloud). You can send both logs and metrics to Splunk and analyze them together.
Key Features:
- Powerful query language for search and analytics
- Search-time field extraction (beyond parsing at ingestion-time)
- Automatically moves frequently-accessed data to fast storage and infrequently-accessed data to slow storage
Pricing:
- Free: 500MB data per day
- Paid plans are available upon request, but the FAQ suggests they start at $150/month for 1GB
Pros:
- Mature and feature-rich
- Good data compression for most use-cases (assuming limited indexing, as recommended)
- Logs and metrics under one roof
Cons:
- Expensive
- Slow queries for longer time ranges (assuming limited indexing, as recommended)
- Less efficient for metrics storage than monitoring-focused tools
Want to see how Sematext stacks up? Check out our page on Sematext vs Splunk.
3. Sumo Logic
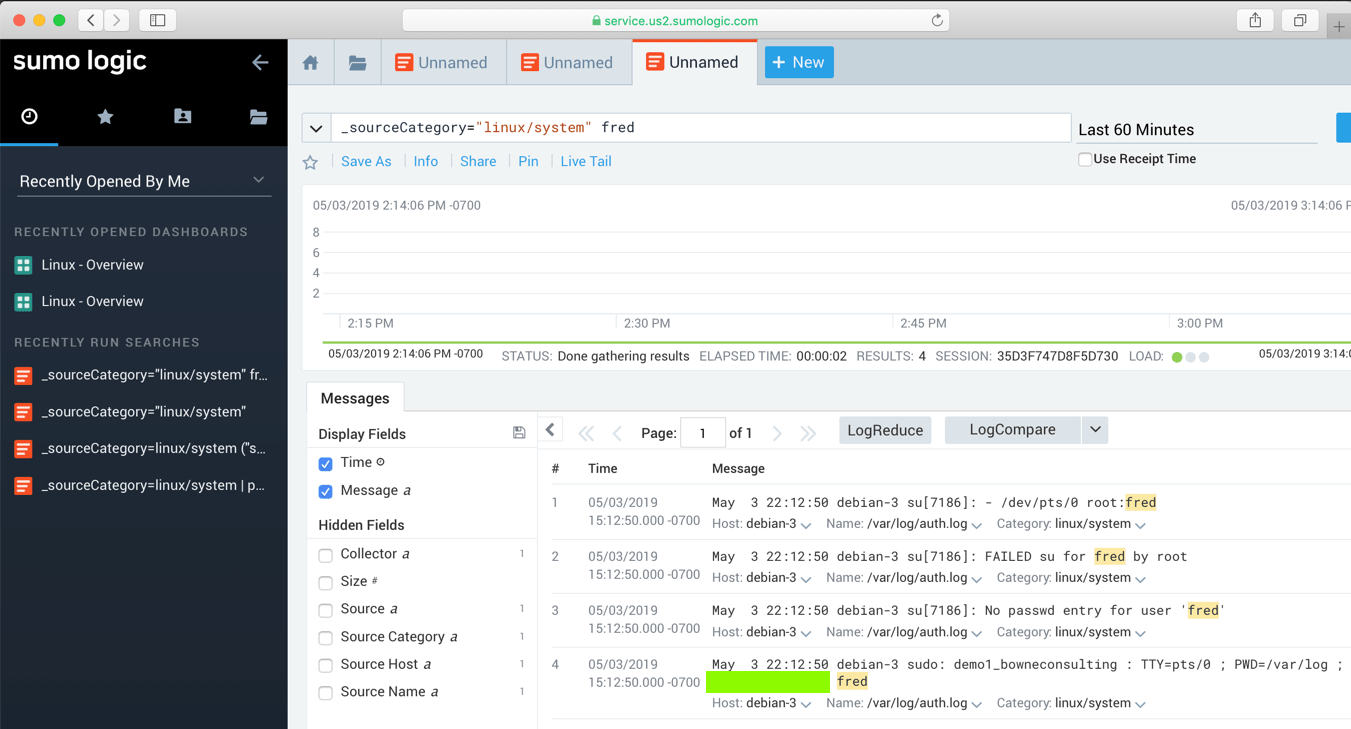
Sumo Logic is a log management software where you can store both logs and metrics. More similar to Sematext Cloud than Splunk, in the sense that metrics and logs can be viewed (and paid for) as separate entities. Like Splunk, it has a powerful search syntax, where you can define operations in a similar way to UNIX pipes.
Key Features:
- Powerful query language
- Ability to detect common patterns of logs (LogReduce)
- Ability to detect trends for patterns of logs (LogCompare)
- Centralized management of agents
Pricing:
- Free: 500MB/day
- Paid plans start at $324/month for 3GB/day ingestion and 10 days (30GB) storage
Pros:
- Easy agent setup
- Good query and visualization functionality
- Spike-friendly (like in Sematext Cloud, ingestion is averaged out for a month)
Cons:
- Not available on premises
- Some users complain about performance (e.g. querying lots of data) and latency (i.e. delay between sending the log and seeing it in search)
- No overage support: you need a higher plan for a larger quota (or a custom plan)
4. SolarWinds PaperTrail
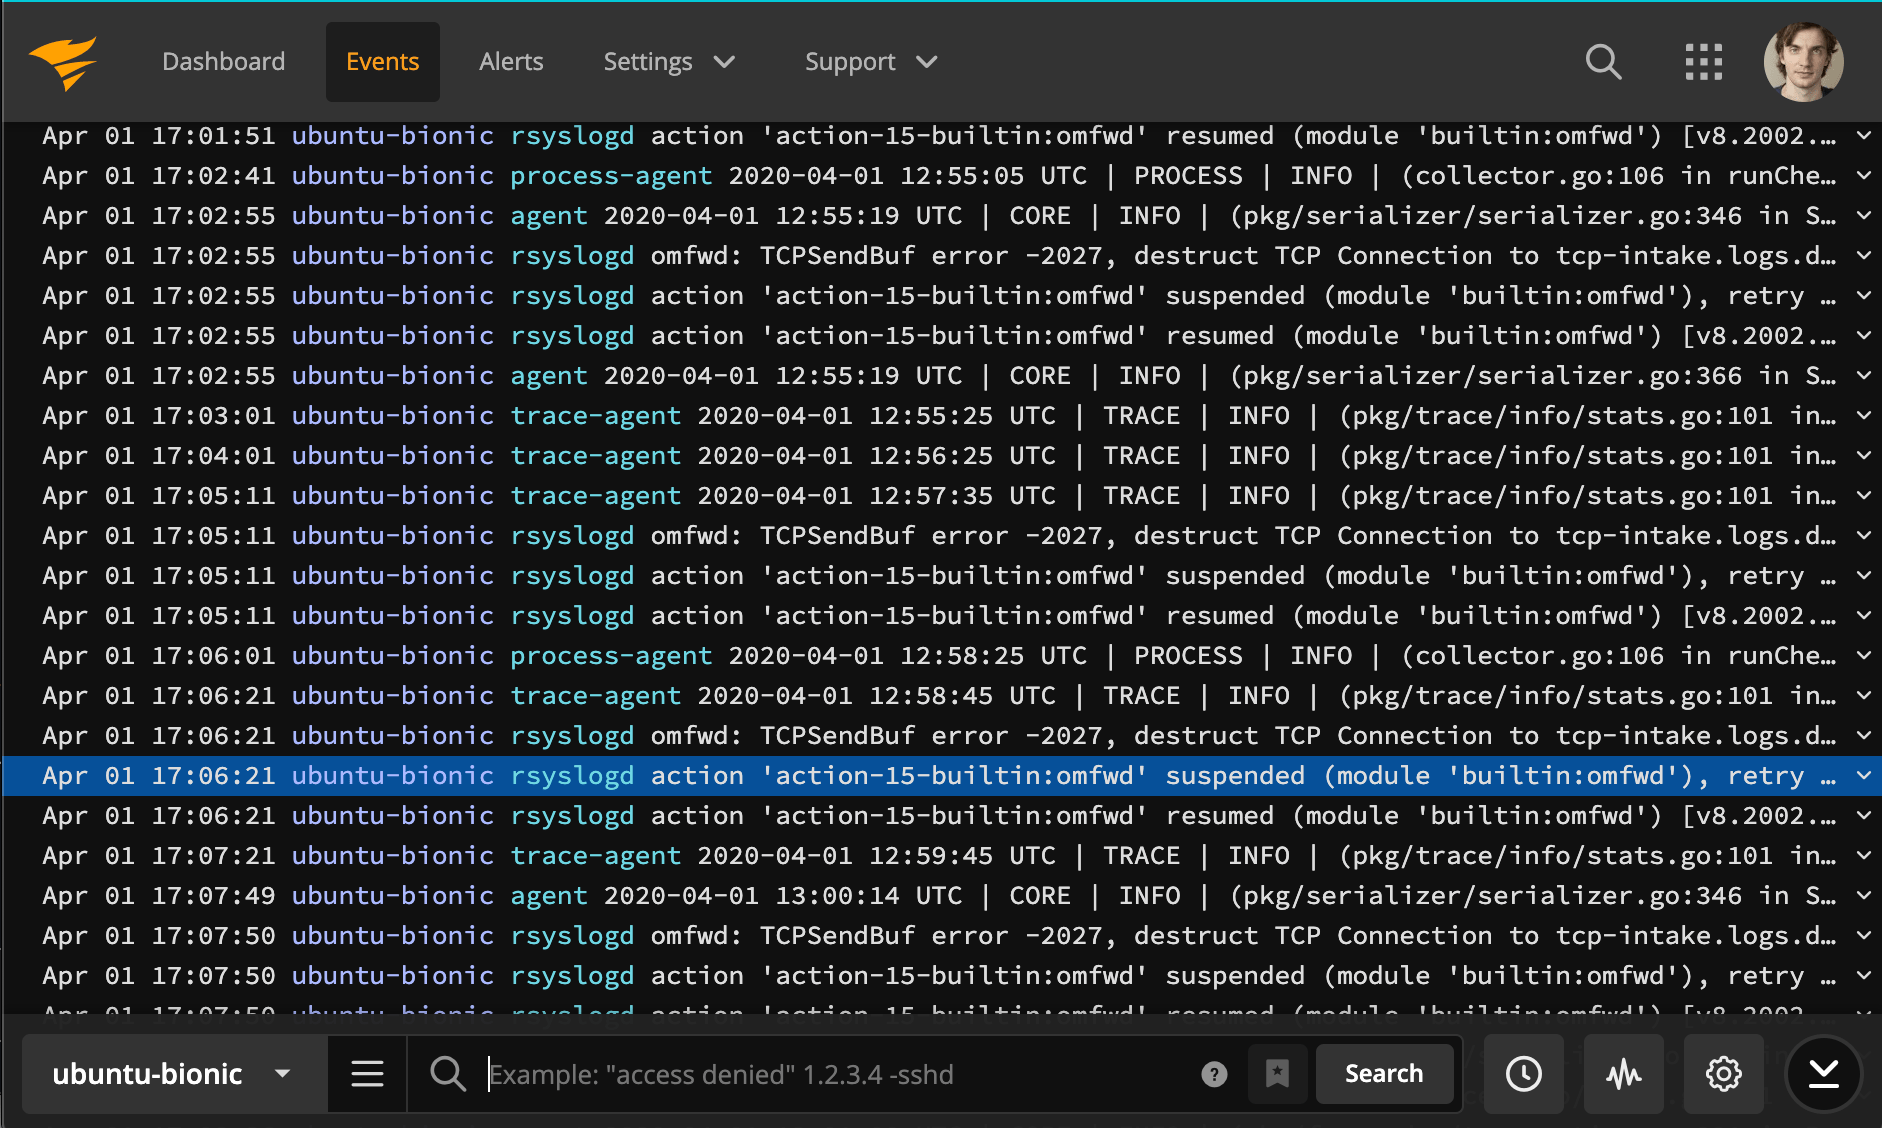
SolarWinds provides multiple tools designed for IT operations. For logging, they have Log Analyzer, but they are better known for services they acquired in the meantime, such as PaperTrail and Loggly (see below).
PaperTrail is a simple, easy-to-use service that provides a logging experience closer to the terminal. You’d send data over syslog, so you can tail and search it in the UI.
Key Features:
- Simple and user-friendly interface.
- Built-in archiving
- Spike-friendly: volumes are averaged per month (similar to Sematext Cloud)
Pricing:
- Free: 50MB/month
- Paid plans start at $7/month for 1GB/month ingestion, 1-week searchable storage, and 1-year archive
Pros:
- Quick setup
- Intuitive UI
- Affordable for low volumes
Cons:
- No visualizations, besides log volume
- Higher volume pricing is actually more expensive than e.g. Sematext Cloud
- +30% overage cost, limited to 200% the base plan
Want to see how Sematext stacks up? Check out our page on Sematext vs Papertrail.
5. SolarWinds Loggly
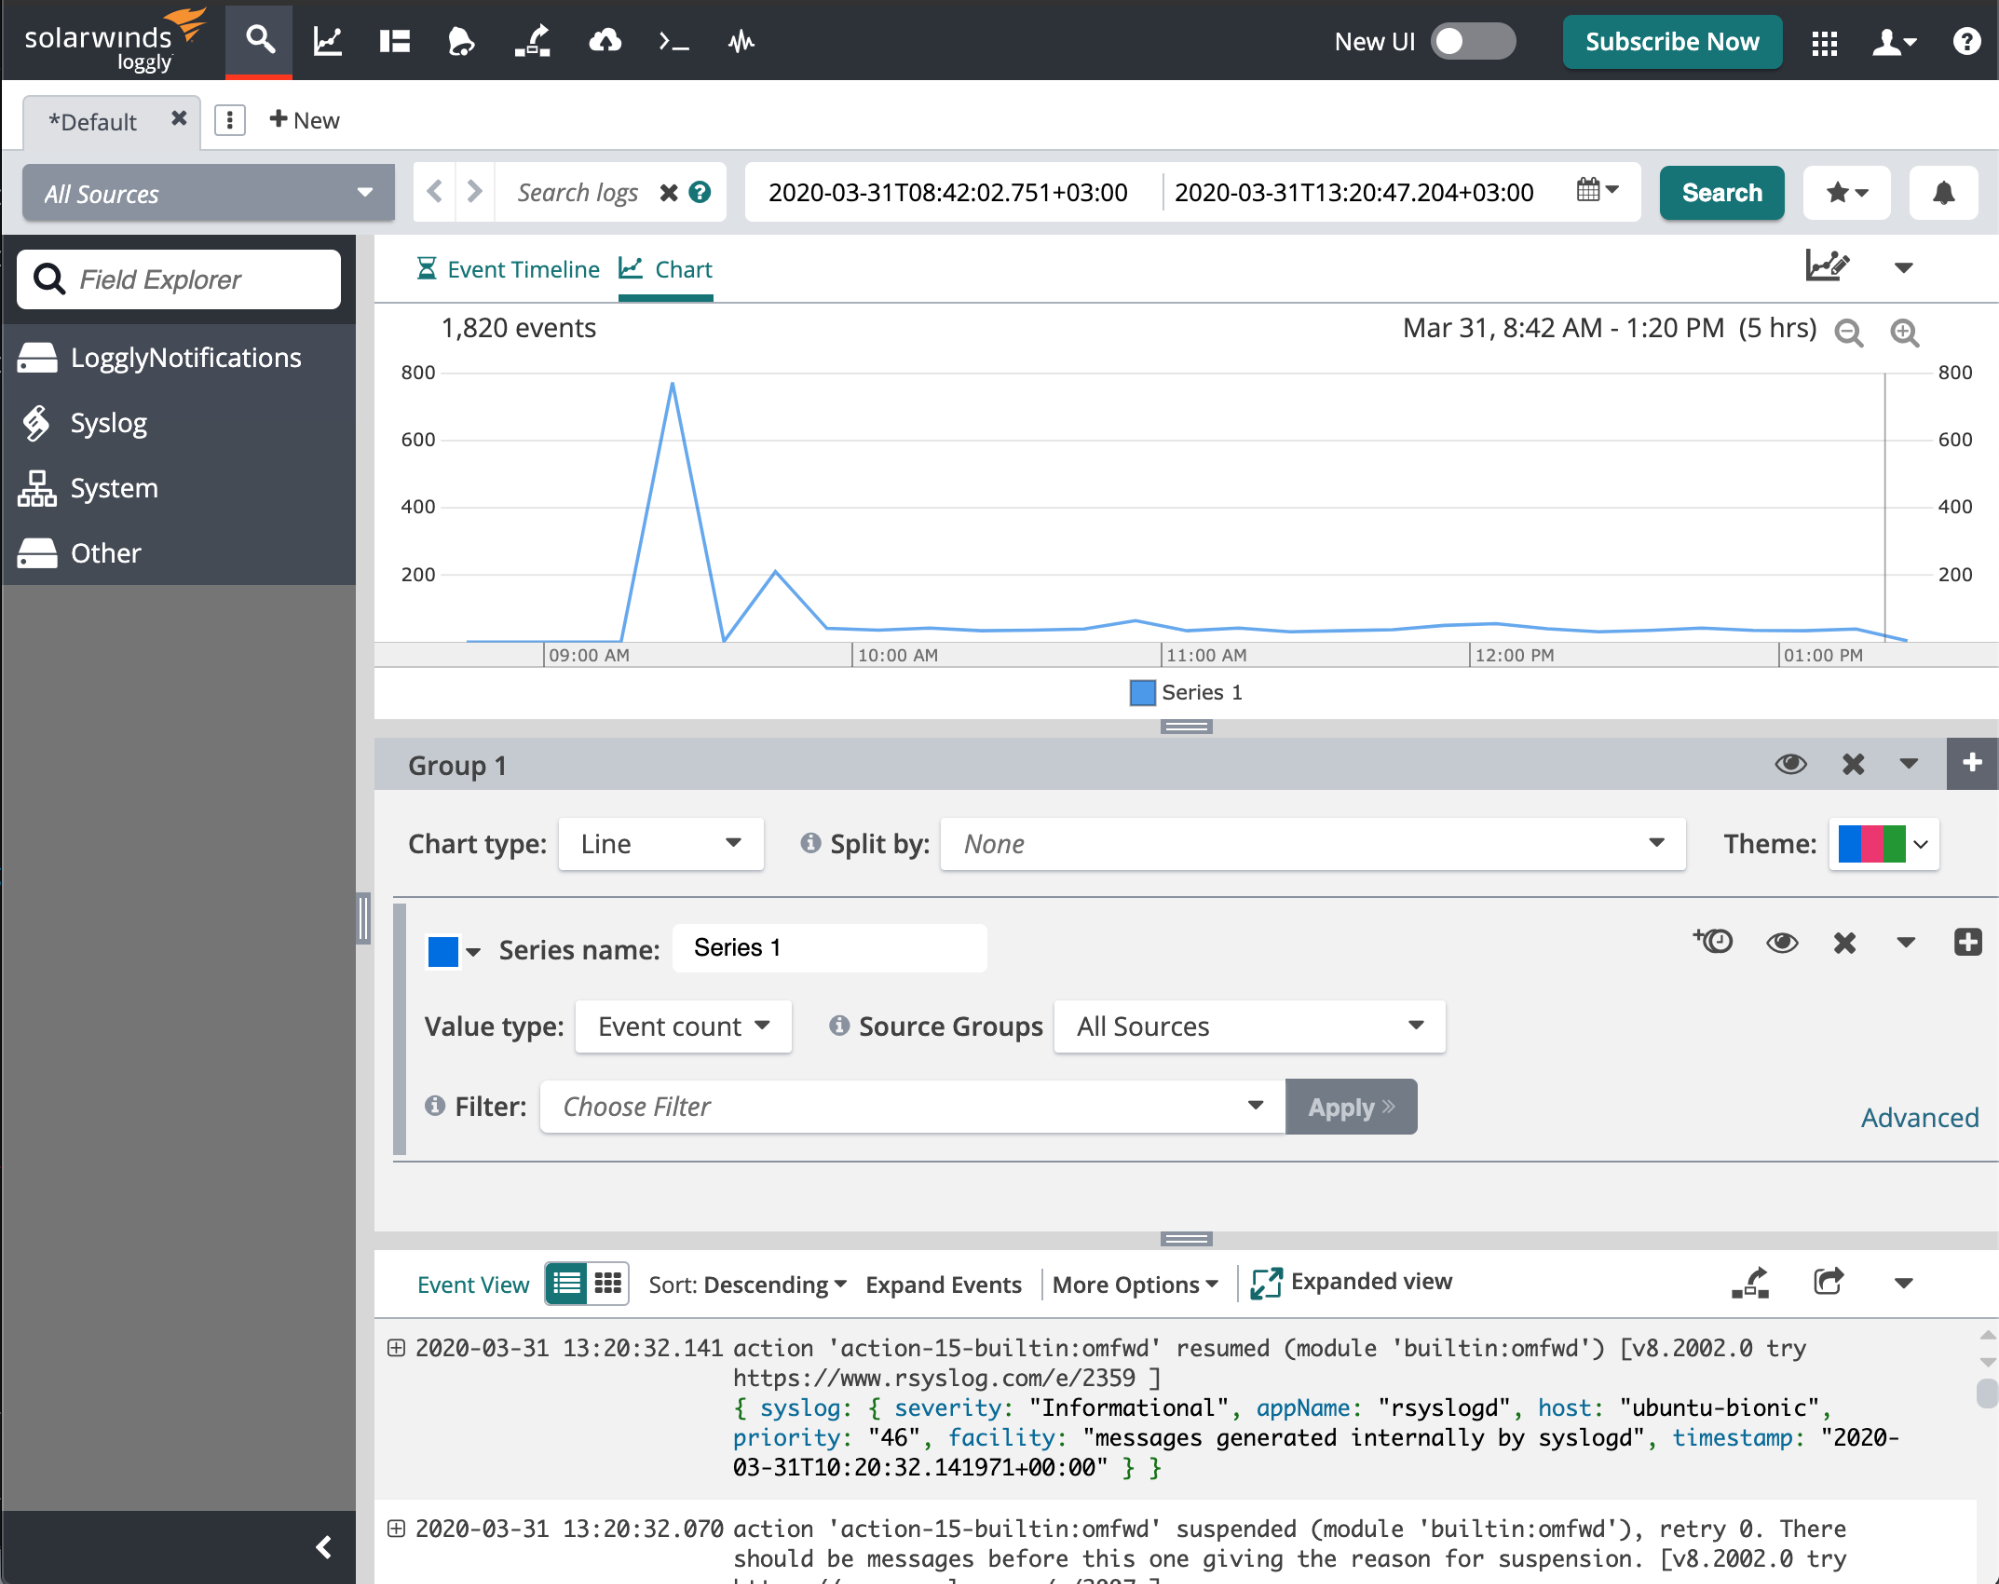
Loggly is another log management tool provided by SolarWinds. Compared to PaperTrail, it provides richer visualizations, more parsing functionality but not built-in archiving. That said, with a Pro/Enterprise plan, you can archive to your own AWS S3 bucket like you can do in Sematext Cloud.
Key Features:
- Agent-free log collection: supports syslog and HTTP(S)
- Server-side log parsing
- Search-time field extraction
Pricing:
- Free: 200MB/day
- Paid plans start at $79/month for 1GB/day ingestion, 2 weeks retention
Pros:
- Good support for popular log shippers (e.g. Logstash plugin)
- Parses common logging formats out of the box
- Some overage (100% or 50GB up to 3 days per month) is included in higher plans
Cons:
- Some basic features, like API access or more than a few users are only available in higher plans
- Overage rules are restrictive. Though they are negotiable via custom plans
Want to see how Sematext stacks up? Check out our page on Sematext vs Loggly.
6. ManageEngine EventLog Analyzer
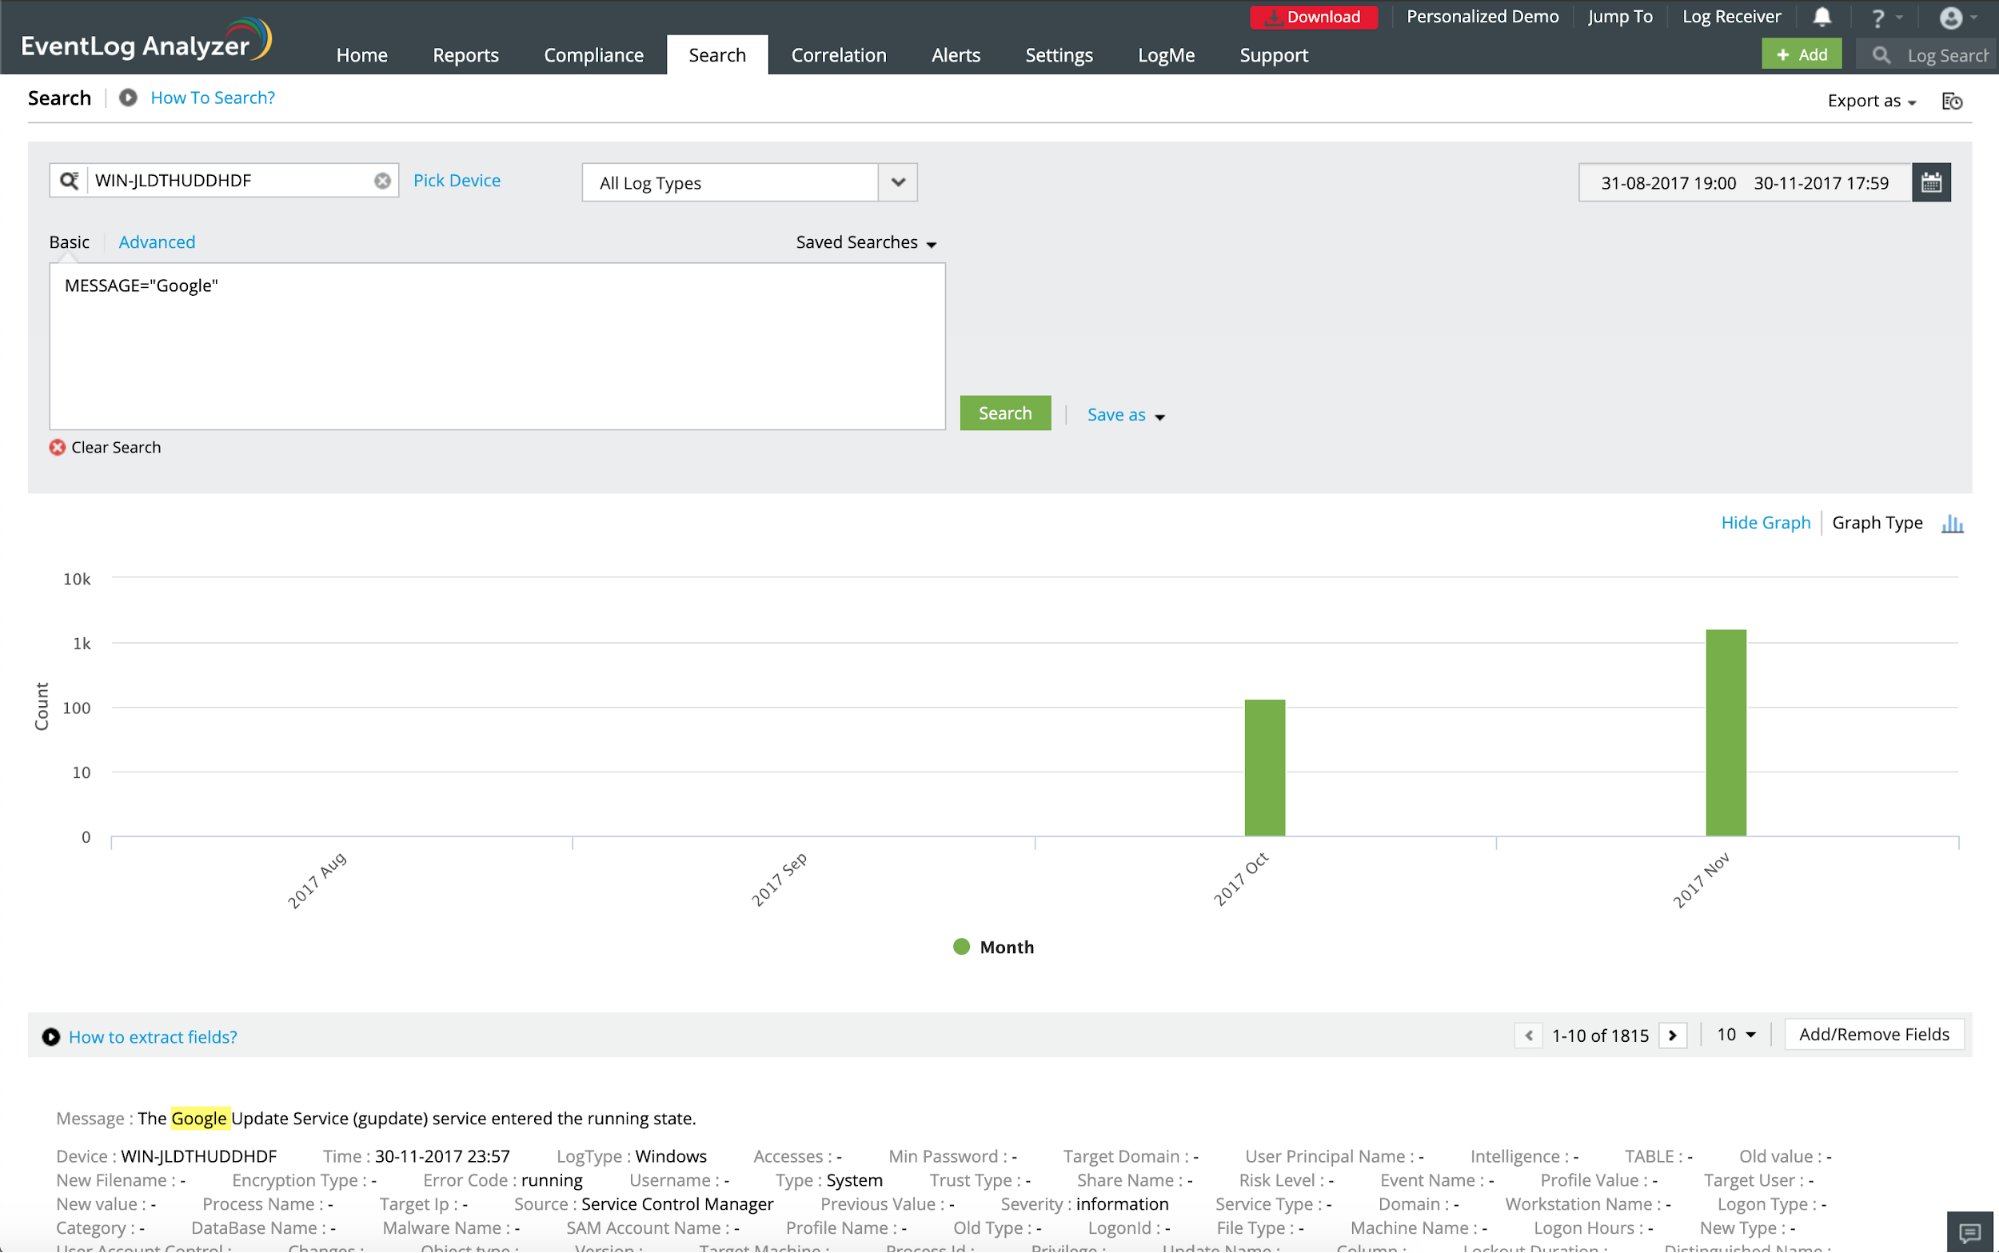
ManageEngine EventLog Analyzer is on-premises log management software. It runs on Windows but accepts logs from both Windows and UNIX sources. On top of the typical log monitoring and analysis features (search, visualize, alert, report), it provides some SIEM capabilities, especially for Windows.
Features:
- Agentless log collection (can pull events from Windows hosts)
- Host auto-discovery
- Query-time field extraction
- Event correlation for threat detection (e.g. N failed login attempts get reported as a brute force attack)
Pricing:
- Free edition, supports up to 5 log sources
- Paid editions start at $595/year
Pros:
- Good support for Windows logging
- Common log format parsing out of the box, especially for Windows services, such as IIS, DHCP, MS SQL
Cons:
- Only available on-premises and only available on Windows
- Deploying EventLog Analyzer on multiple servers requires a more expensive “Distributed” license
7. Datadog
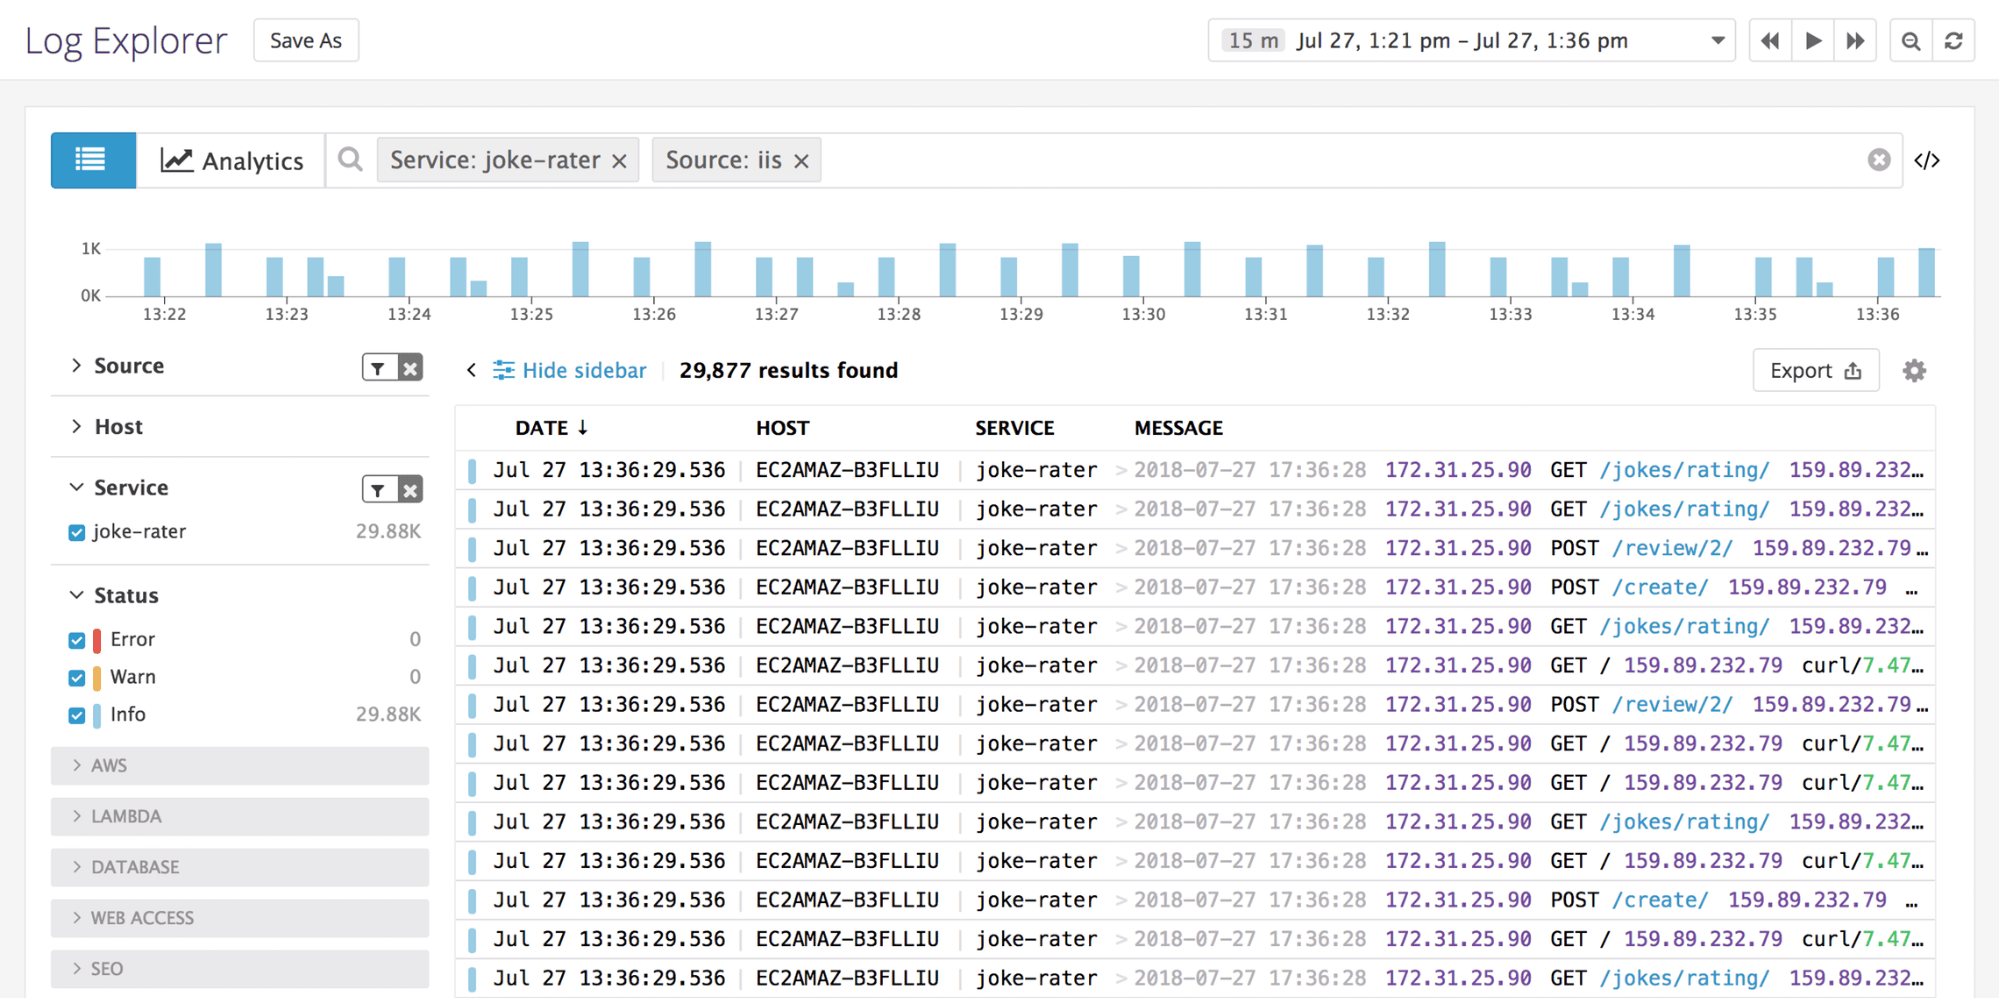
Datadog is a SaaS that started up as a monitoring (APM) tool and later added log management capabilities as well. You can send logs via HTTP(S) or syslog, either via existing log shippers (rsyslog, syslog-ng, Logstash, etc.) or through Datadog’s own agent. It features Logging without Limits™, which is a double-edged sword: harder to predict and manage costs, but you get pay-as-you-use pricing (see below) combined with the fact that you can archive and restore from archive.
Key Features:
- Server-side processing pipeline for parsing and enriching logs
- Automatically detects common log patterns
- Can archive logs to AWS/Azure/Google Cloud storage and rehydrate them later
Pricing separates processing from storage:
- Processing starts at $0.10 per ingested GB per month (e.g. $3 for 1GB/day)
- Processing also applies to rehydration from archive, though here data is compressed
- Storage starts at $1.59 for 3 days for 1M events (e.g. $47.7 for 1GB/day at 1K each, stored for 3 days)
Pros:
- Easy search with good autocomplete (based on facets)
- Integration with DataDog metrics and traces
- Affordable, especially for short retention and/or if you rely on the archive for a few searches going back
Cons:
- Not available on premises
- Some users complain about costs getting out of control (due to flexible pricing). Though you can set daily processing quotas
Want to see how Sematext stacks up? Check out our page on Sematext vs Datadog. If you are still undecided, read about how Datadog compares to top alternatives from the industry.
8. Dynatrace
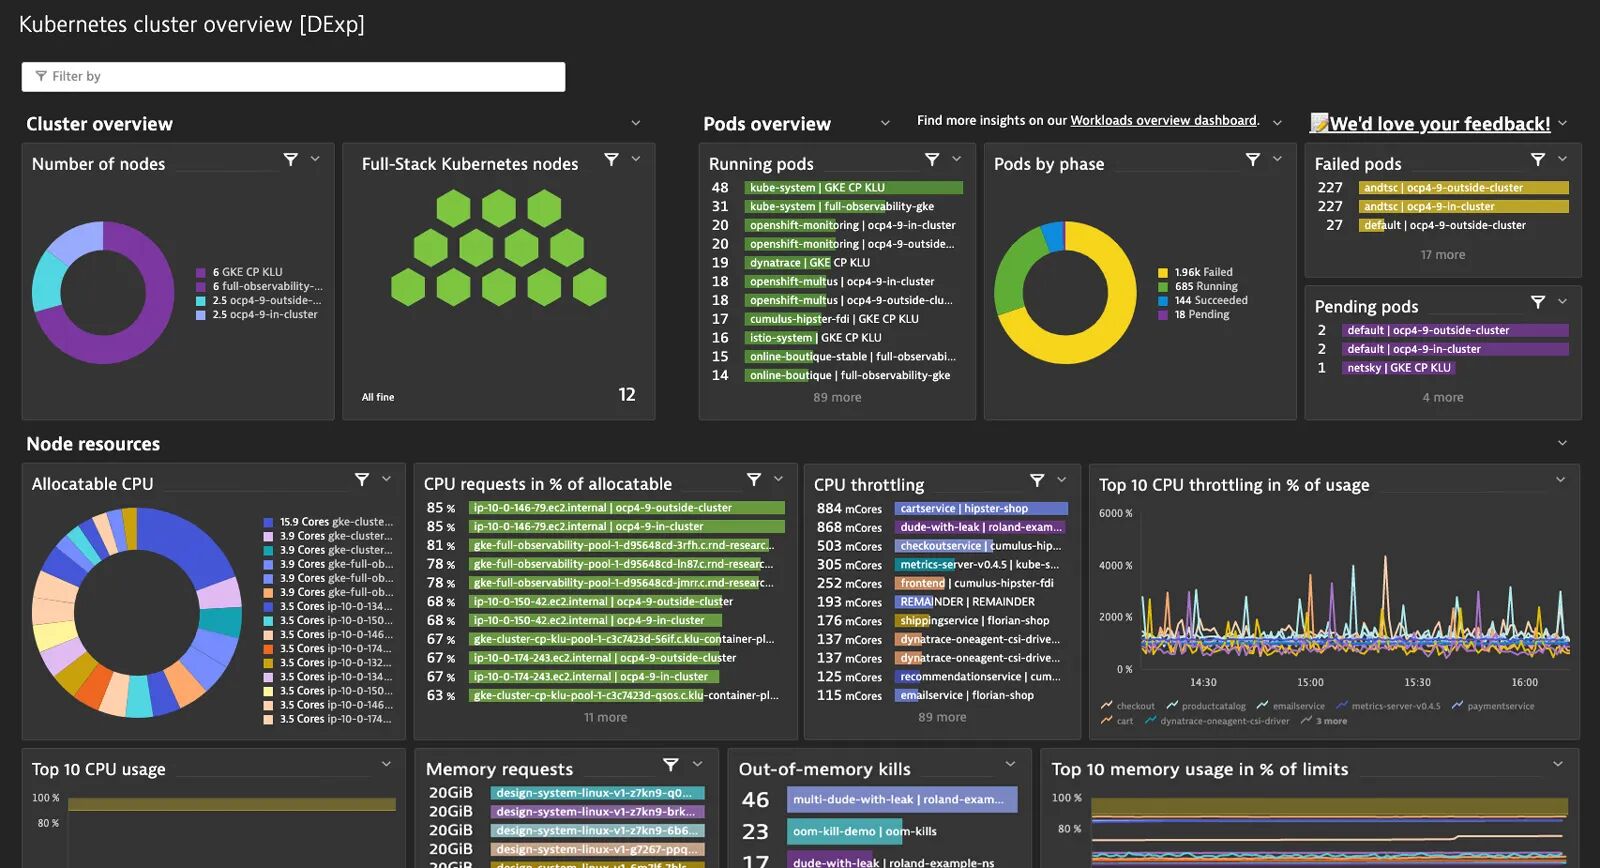
Dynatrace is known for being a large-scale monitoring tool, but it also has some pretty comprehensive log management capabilities. That said, its main focus is APM.
Dynatrace also provides Security Analytics for advanced threat protection and Security Protection, allowing users to identify, analyze, and safeguard against unforeseen vulnerabilities.
Dynatrace is a decent choice for log management if you’re a large enterprise that’s also seeking other observability solutions. It great in delivering essential business metrics across various digital platforms and incorporates AI to automate complex workflows effectively.
Be warned, however, that prices stack up quickly! Dynatrace is known for being expensive, and it is not at all designed for small to medium businesses looking for a cost-effective solution.
Key Features:
- Infrastructure Monitoring
- Application Security
- Real User Monitoring
- Synthetic Monitoring
- Log management and Analytics
Pricing:
- Full-stack monitoring starts at $0.08 per hour per 8 GiB host
- Infrastructure monitoring starts at $0.04 per hour for any sized host
- Application security starts at $0.018 per hour per GiB host
- RUM starts at $0.00225 per session
- Synthetic monitoring starts at $0.001 per request
- Log management starts at $0.20 per ingested GiB for ingesting and processing, $0.0007 per GiB per day for retention, and $0.0035 per GiB for log queries
Pros:
- Plenty of observability options
- Powerful alerting
- Powered by AI
Cons:
- Seems cheap, but pricing scales are very expensive
- User reviews complain about the complexity of the tool
- User reviews complain about poor customer service
- User reviews complain about poor documentation
Dynatrace is expensive! Want to see how Sematext compares? Hint: We’re much cheaper and just as effective! Check out the cost breakdowns on Sematext vs Dynatrace.
9. Mezmo (Formerly LogDNA)
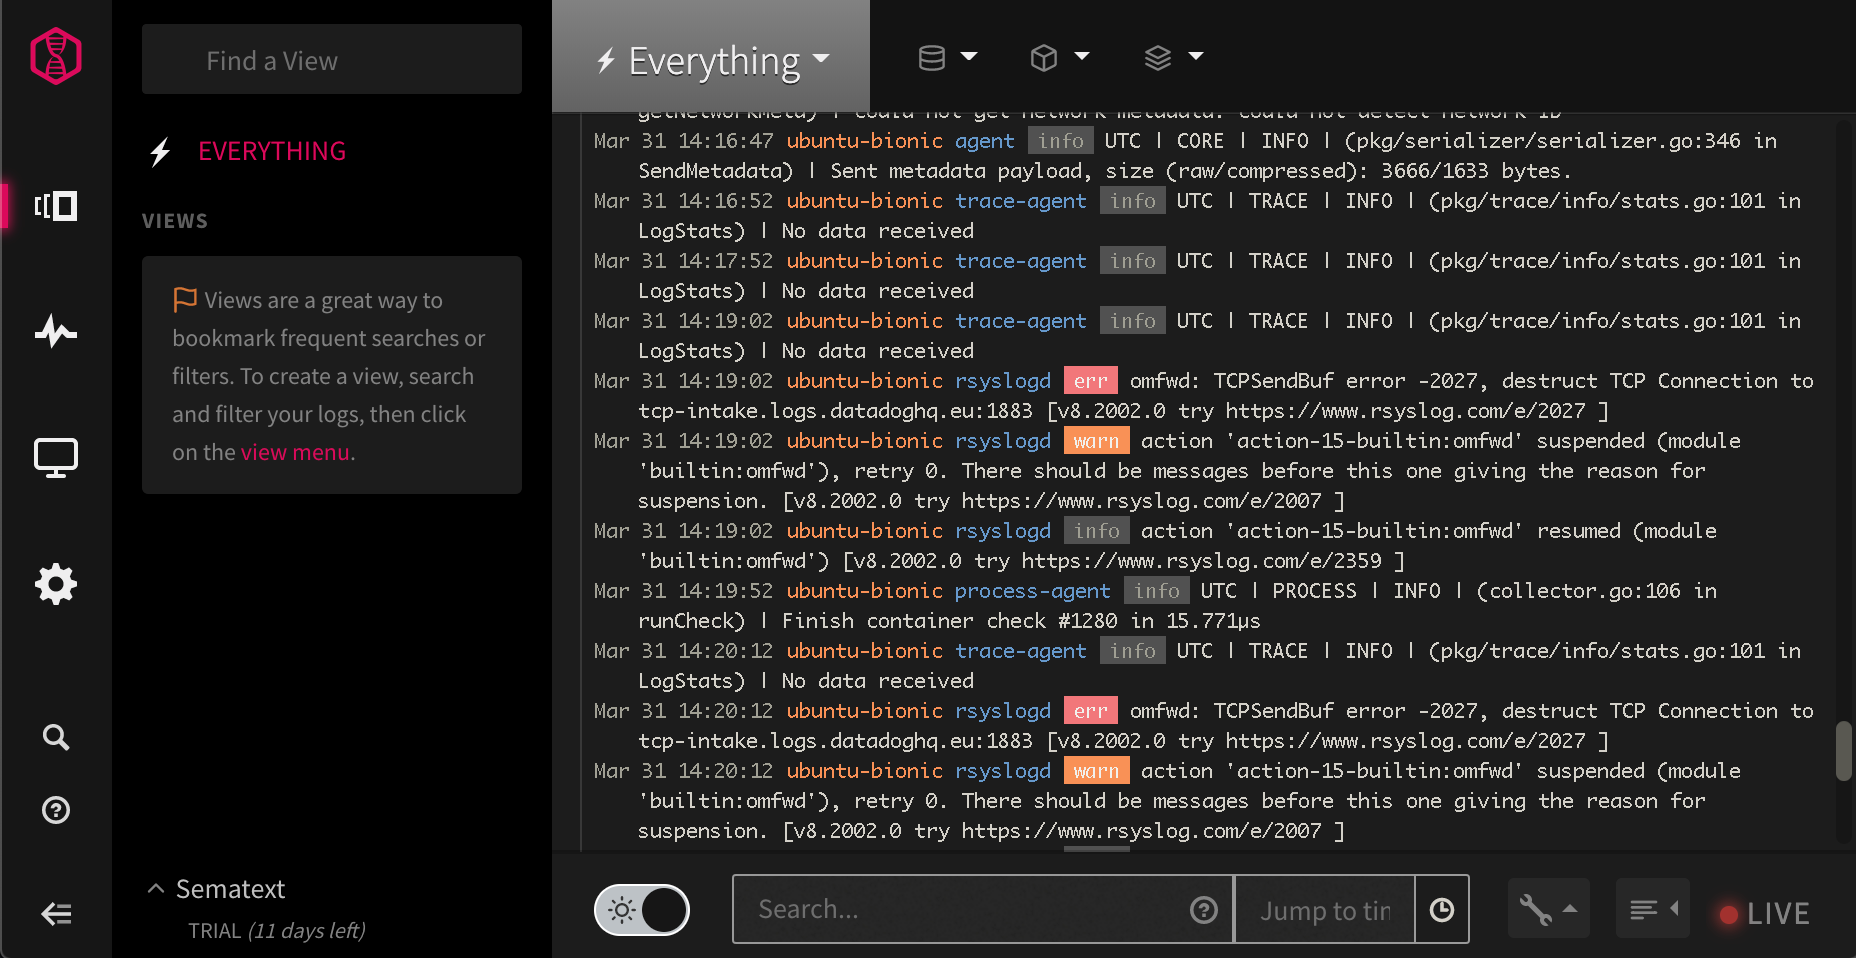
Mezmo (Formerly LogDNA) is a newer player in the log management space. Available as both SaaS and on premises, LogDNA provides all the logging basics: agent-based and agentless log collection, via syslog and HTTP(S) plus full-text search and visualizations, with clear and competitive pricing.
Key Features:
- Embedded views to share logs outside the organization
- Automatically parses common log formats
Pricing:
- Free: no storage, just live tail
- Paid plans start at $1.50 per ingested GB in a month at 7 days retention
Pros:
- Simple UI for searching logs, similar to Papertrail
- Easy-to-understand plans
Cons:
- Limited visualization capabilities
- Retention depends on the plan (from 7 up to 30 days). So does the number of users (the cheapest plan only allows 5)
Want to see how Sematext stacks up? Check out our page on Sematext vs Mezmo.
10. Logz.io
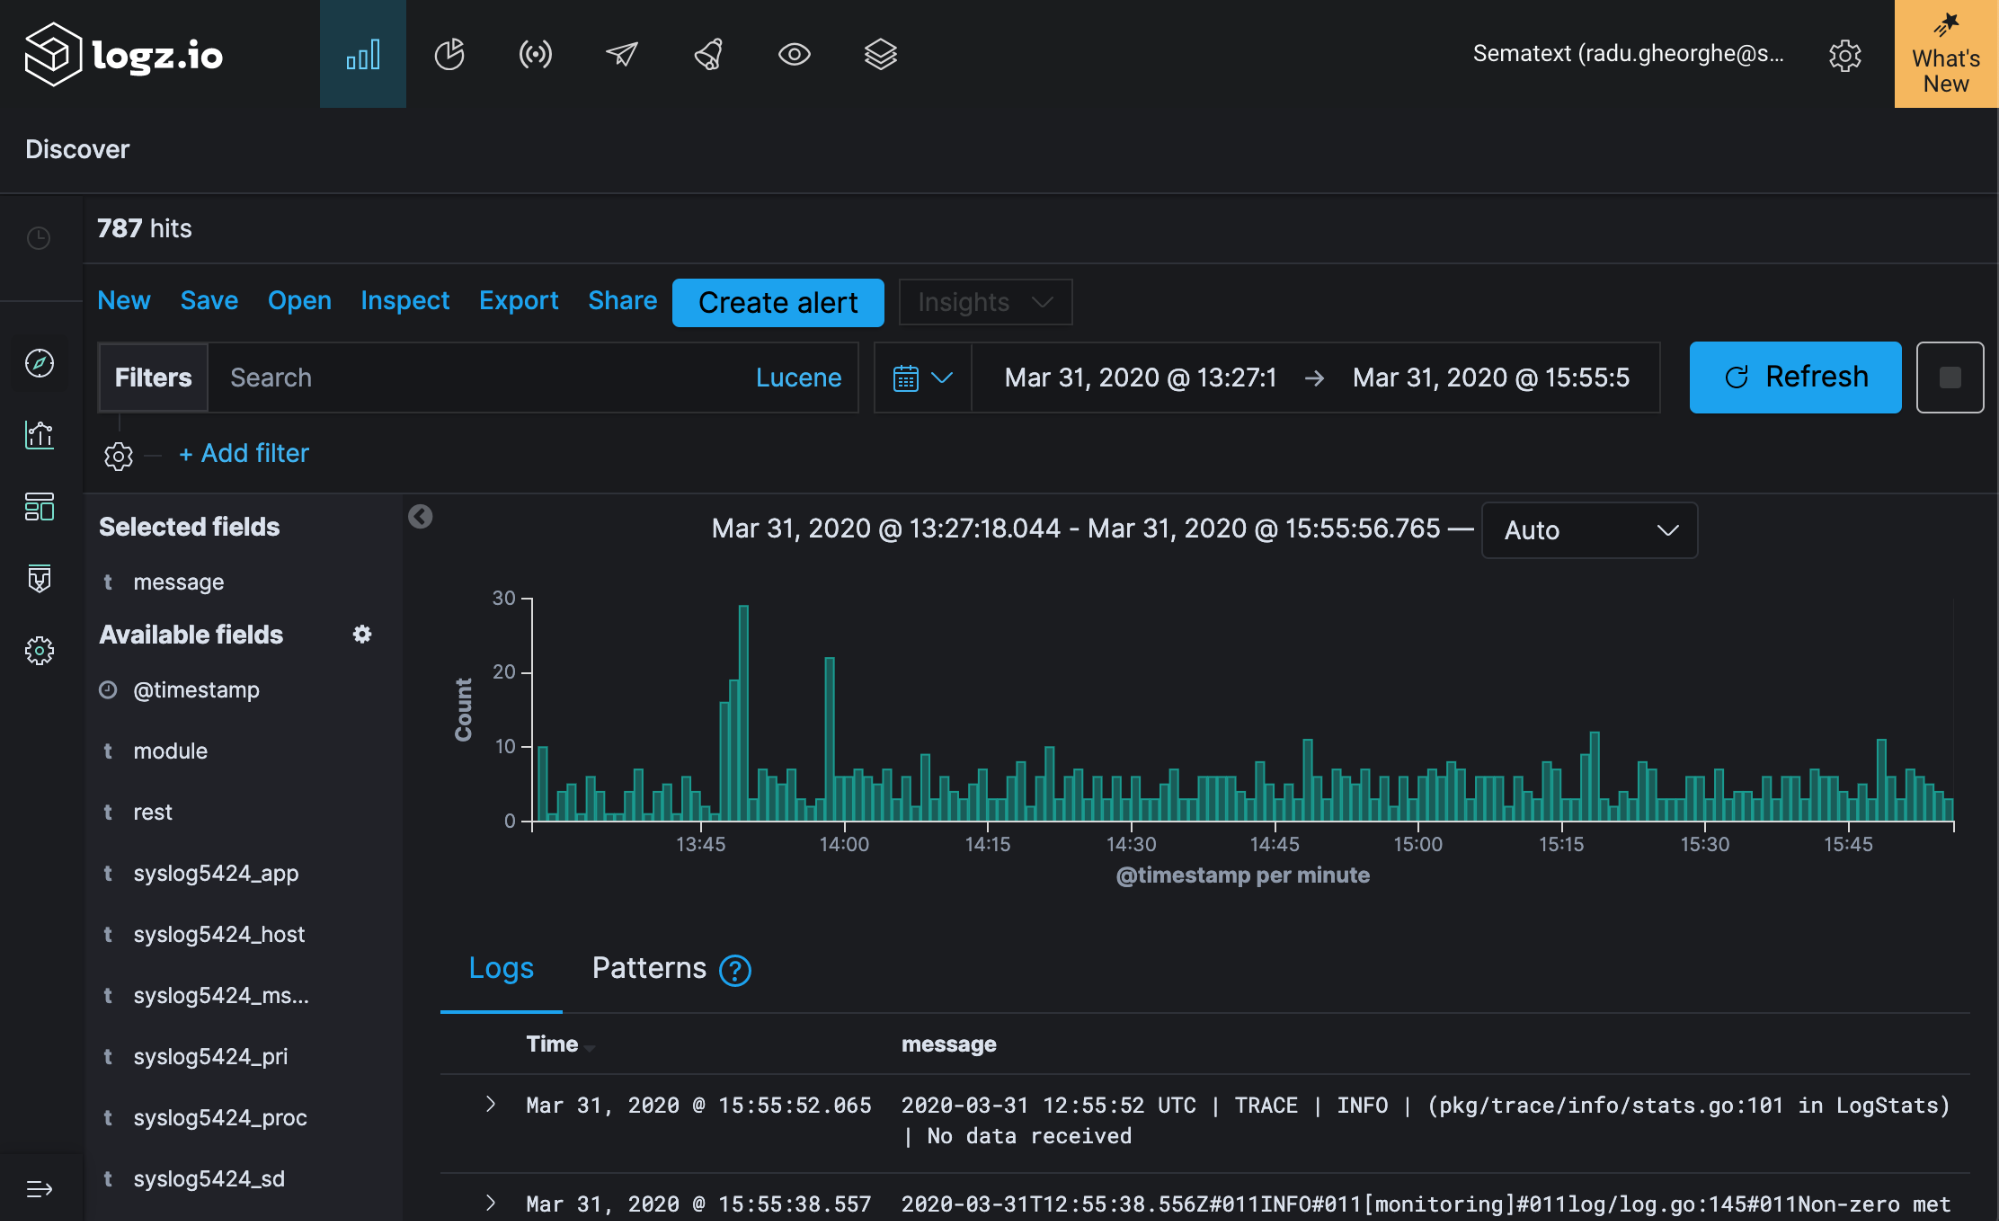
Logz.io is one of the “purest” versions of hosted ELK, in the sense that you can use the Logstash protocol to send logs (as well as syslog), and you have Kibana to visualize them. Similar to Sematext Cloud, there are some added features, such as alerting.
Key Features:
- Built on top of the ELK stack, meaning you can send data through the Logstash protocol (e.g. from Beats) and use Kibana to visualize logs
- Logs and metrics in one place (though metrics are in Beta as of April 2020)
- Automatically parses common log formats
Pricing:
- Free: 1GB/day, 1 day retention
- Paid plans start at $82/month+taxes for 2GB/day and 3 days retention
Pros:
- Fully hosted: get most of the flexibility of the ELK stack without having to manage/scale Elasticsearch
- Pre-built dashboards are available as “ELK apps”
- Server-side parsing available, with intuitive UI to define new parsing rules
Cons:
- Not available on premises
- API available only with the Enterprise plan
- As metrics are visualized with Grafana, you can’t have a dashboard with both logs and metrics
11. Logentries (now Rapid7 InsightOps)
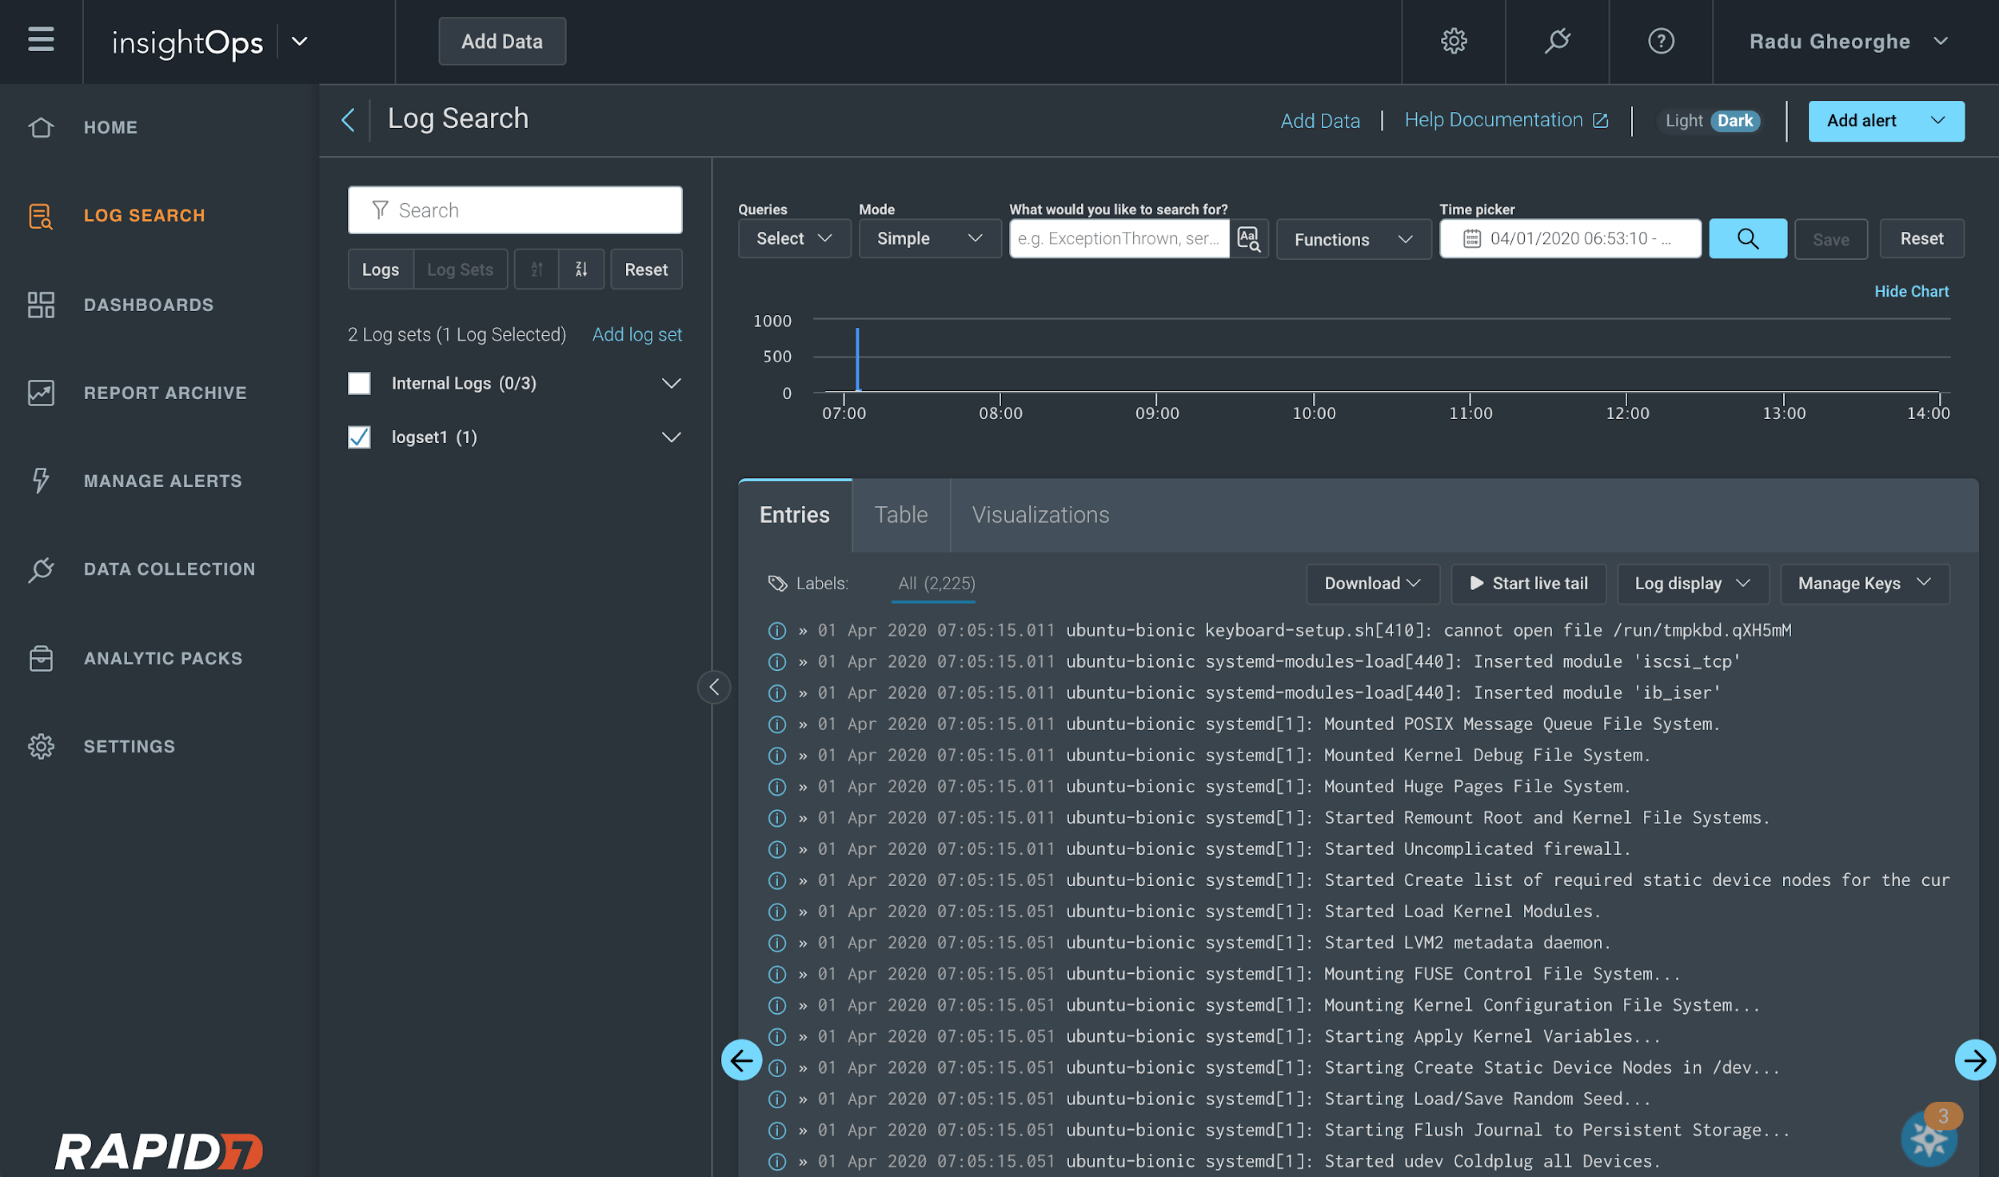
Rapid7 acquired Logentries, rebranding the product InsightOps and adding it to its line of security- and automation-focused products. InsightOps covers all the logging basics: you can send data via TCP/TLS (which includes syslog), you can search, visualize logs and set up alerts.
Key Features:
- SQL-like query language
- Intuitive UI for search and dashboards
- A monthly volume quota means it’s easier to deal with daily spikes
Pricing:
- Starts at $58/month with 30GB/month ingestion and 30 days retention
Pros:
- Agent runs on Windows, Linux, and Mac
- Can automatically parse syslog and Apache logs and NGINX logs
- Good price if you’re looking for 30 days retention
Cons:
- Rest API is available for searches, alerts, etc. but it’s currently in beta
- Retention is fixed for 30 days (unless you go for a custom plan)
- Not available on premises
12. Scalyr
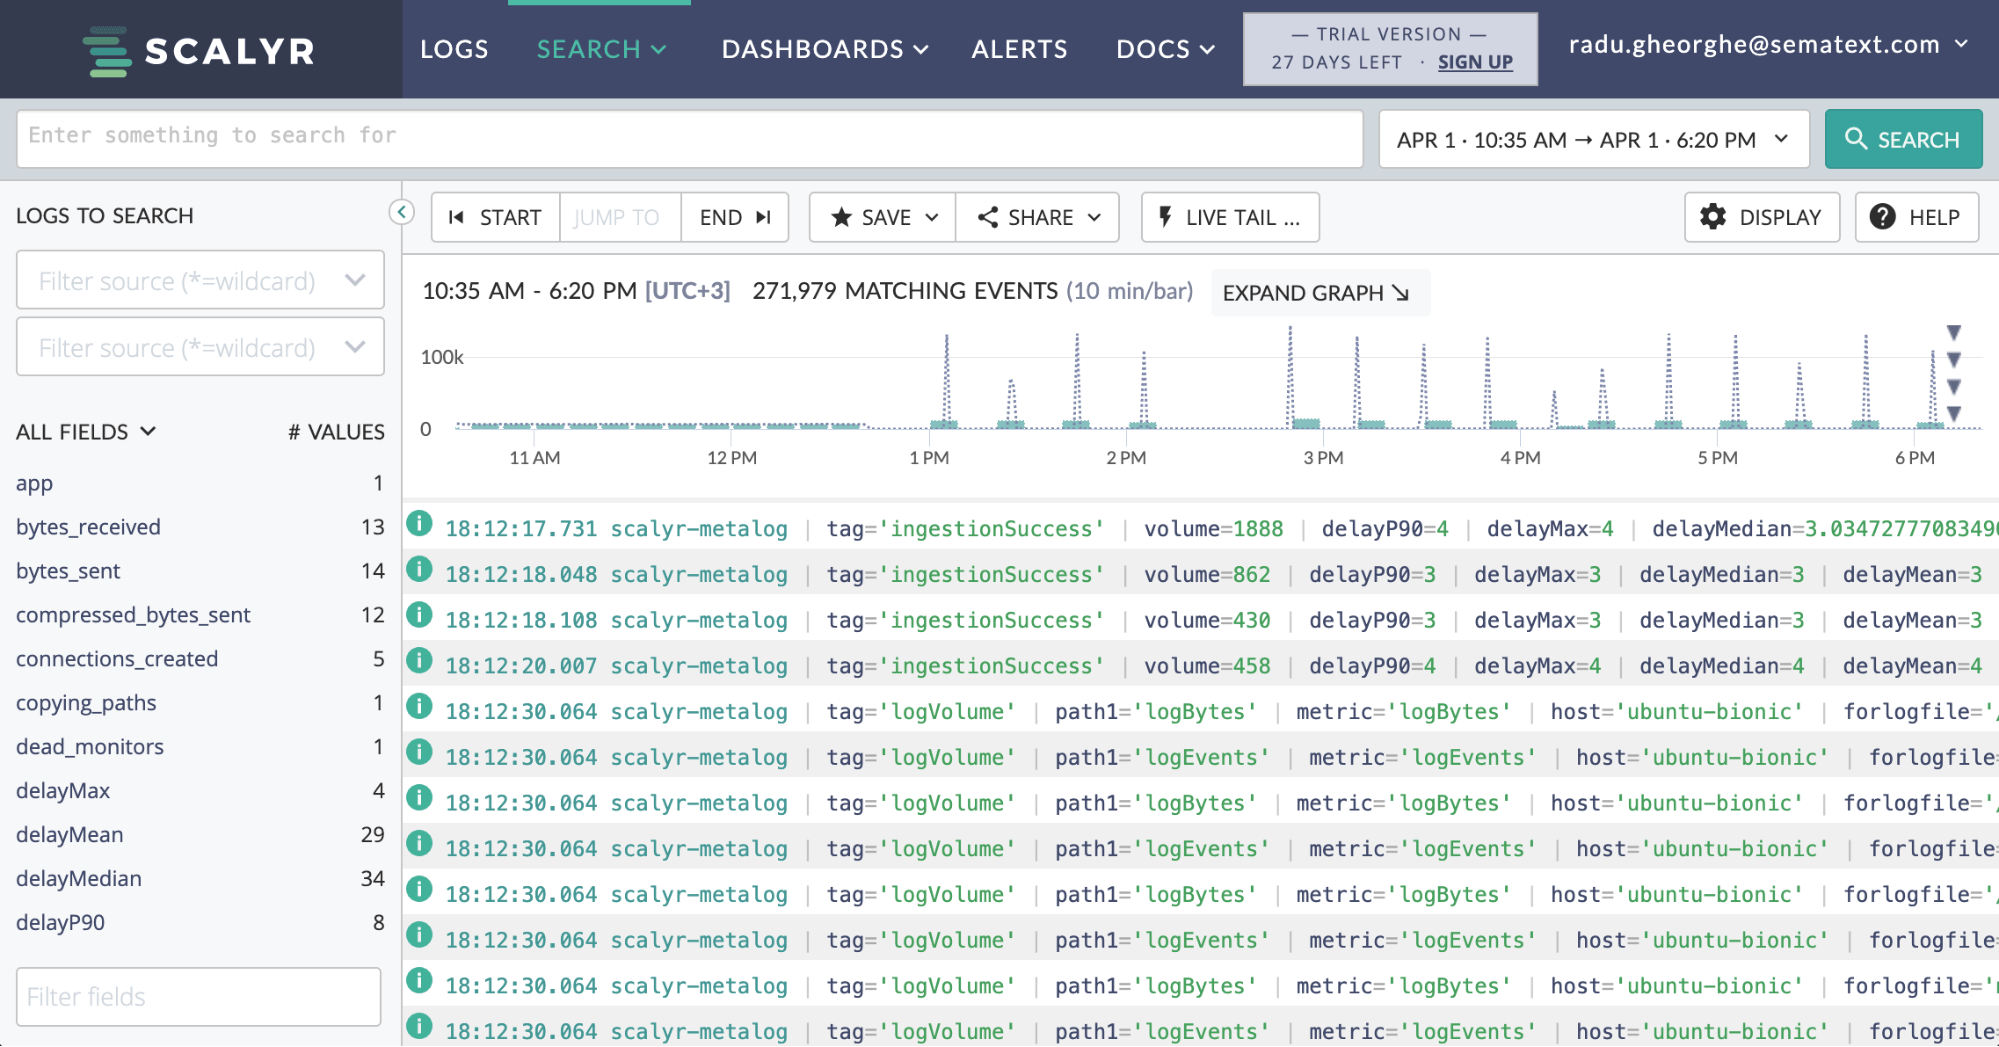
Scalyr is a logging and monitoring software that doesn’t index data. Instead, they use a proprietary columnar data store, acting as a destination for both logs and metrics. They take a similar one-size-fits-all approach to data ingestion, which is only possible through the Scalyr agent.
Key Features:
- Powerful query syntax
- Logs and metrics in one place
Pricing:
- Starts at $35/month for 1GB/day average ingestion and 7 days retention. Overage is possible but costs 10% more than the “base” volume
Pros:
- Server-side parsing, with the possibility to define custom rules
- Easy setup via Scalyr agent
- Good API access
Cons:
- Not available on premises
- Requires installing Scalyr agent, no support for popular tools and protocols (e.g. syslog, though you can send syslog to Scalyr agent)
If you want to go the do-it-yourself route, there are OSS tools that get you most of the way. Being open-source, you can either extend them yourself or pick other tools from their respective ecosystems. From said ecosystems, we’ll also concentrate on log shippers, the tools that fetch your logs – sometimes buffer, parse, and enrich them – and finally send them to one or more destinations.
13. Elasticsearch, Logstash, and Kibana (ELK stack or Elastic Stack)
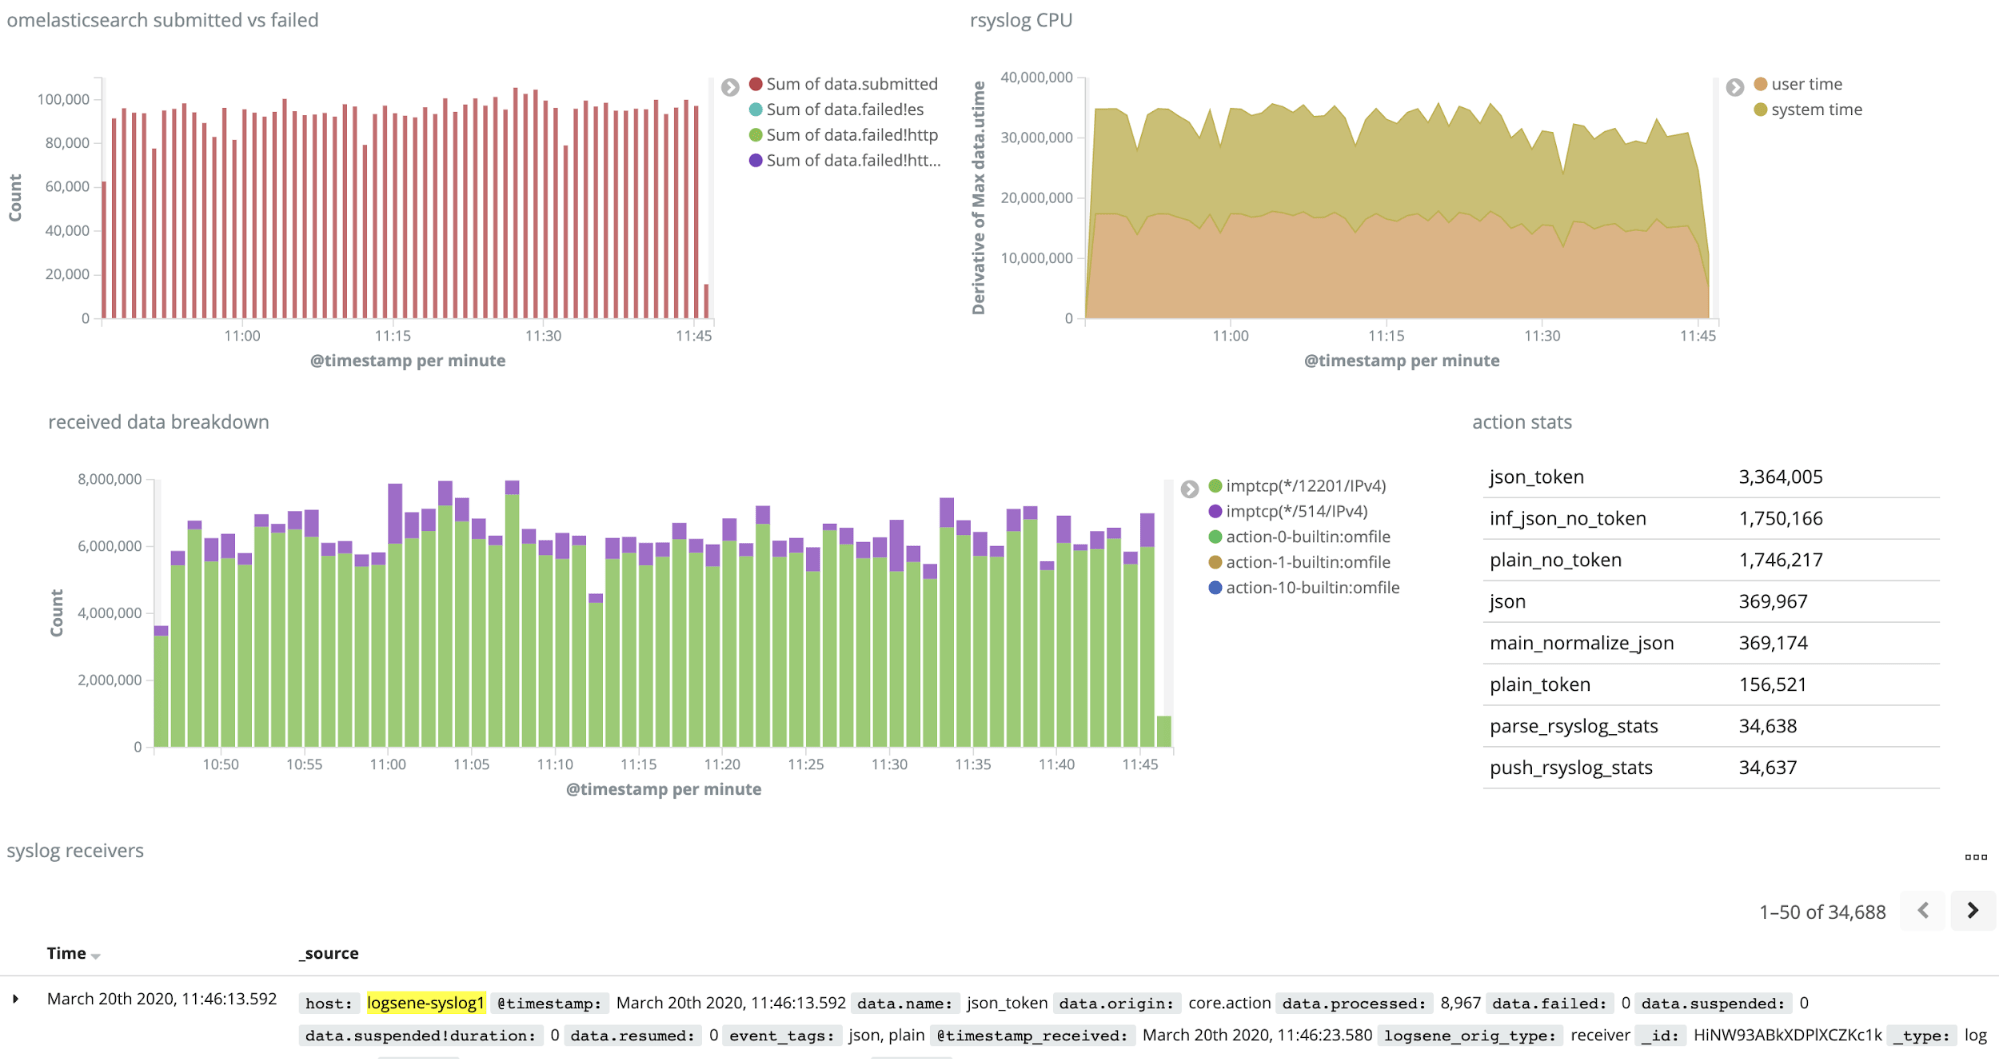
The ELK stack contains most of the tools needed for a log management solution:
- Log shippers such as Logstash and Filebeat
- Elasticsearch as a scalable search engine
- Kibana as the UI to search for logs or build visualizations
It’s very popular for centralizing logs, with lots of tutorials on how to use it all around the web. There’s a vast ecosystem of tools that you can use on top of the basic setup to enhance it with alerting, role-based access control, and more. We go into detail about these extra additions in this blog post where we discuss Elastic Stack features alternatives.
- Elasticsearch indexes every field by default, making searches fast
- Real-time visualizations via API and Kibana
- Data parsing and enriching before indexing
Pricing: Free & Open source. Some companies offer forms of hosted ELK, see above. There’s also Elastic Cloud which is a pure form of ELK in the cloud, that you’d mostly have to manage yourself.
Pros:
- Scalable search engine as log storage
- Mature log shippers
- Web UI and visualizations in Kibana
Cons:
- At scale, it may become difficult to maintain. This is why Sematext offers ELK stack consulting, production support, and training
- The open-source version of the ELK Stack misses some features like role-based access control and alerting. You can get these features through a commercial “Elastic Stack Features” or its alternatives or visa Open Distro for Elasticsearch.
14. Graylog
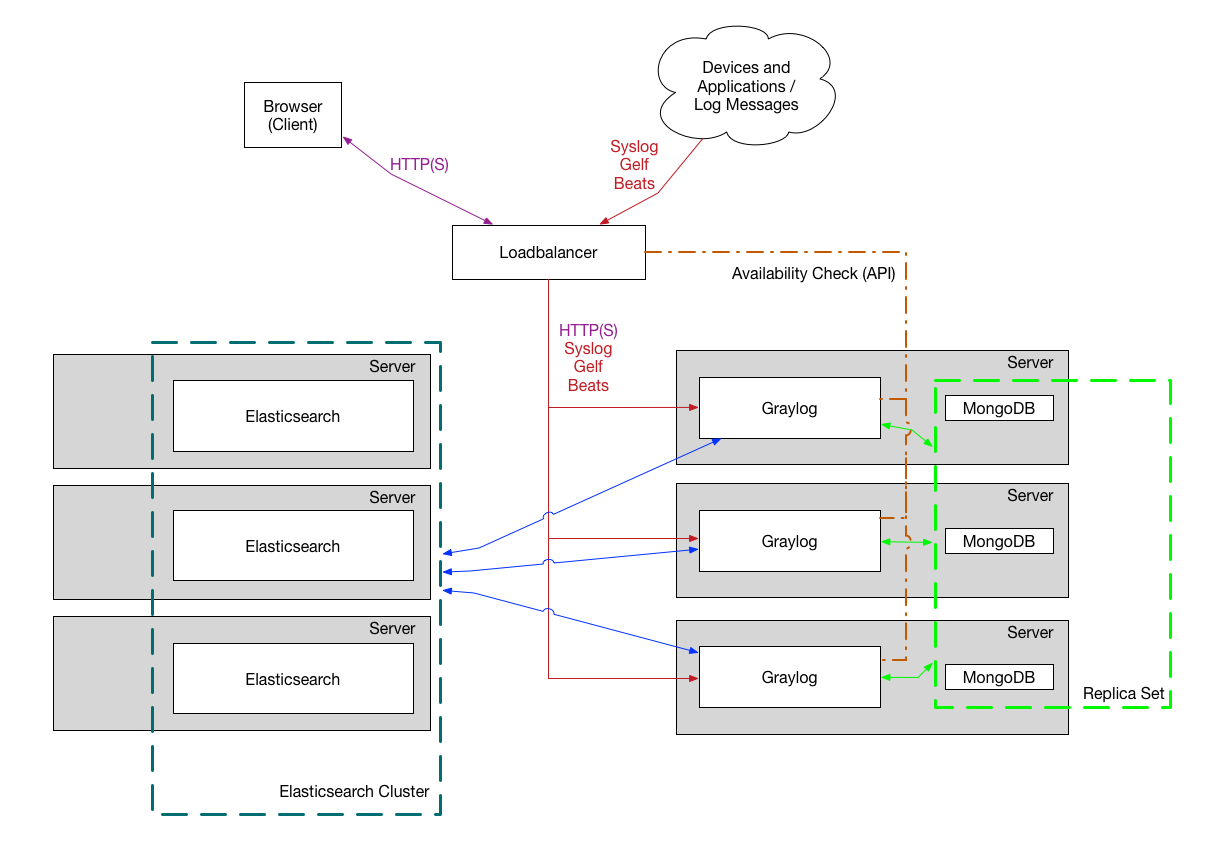
Source: Graylog Documentation
Like the ELK stack, Graylog is an open-source log management tool, using Elasticsearch as its storage. Unlike the ELK stack, which is built from individual components (Elasticsearch, Logstash, Kibana), Graylog is built as a complete package that can do everything.
Key Features:
- One package with all the essentials of log processing: collect, parse, buffer, index, search, analyze
- Additional features that you don’t get with the open-source ELK stack, such as role-based access control and alerts
Pricing: Free & Open source, though there’s an Enterprise version as well (with pricing available upon request)
Pros:
- Fits the needs of most centralized log management use cases in one package
- Easily scale both the storage (Elasticsearch) and the ingestion pipeline
Cons:
- Visualization capabilities are limited, at least compared to ELK’s Kibana
- Can’t use the whole ELK ecosystem, because they wouldn’t directly access the Elasticsearch API. Instead, Graylog has its own API
15. GoAccess
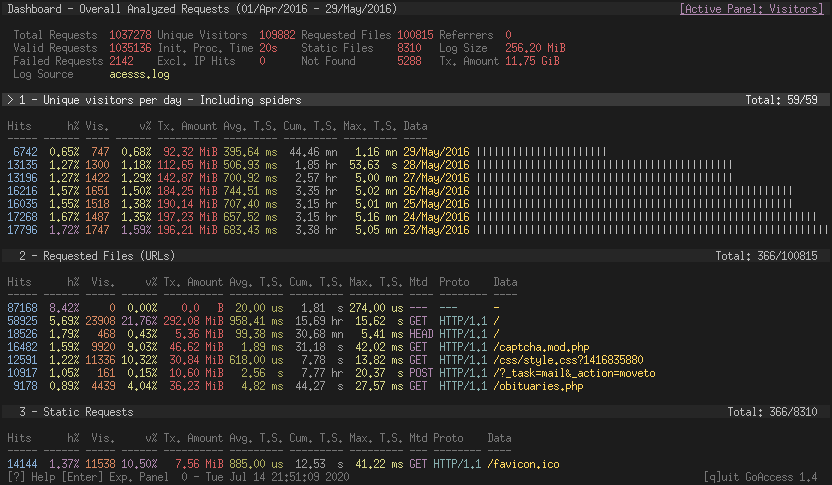
GoAccess is a free and open-source log analysis and monitoring tool specialized for web log formats such as Nginx, Apache, and Amazon S3. Dashboards can be rendered in your *nix terminal or your browser. Reports are available as well.
Key features:
- Easy to use and get started. Just point it to any supported log file
- Lean and mean. Written in C, only depends on ncurses
Pricing:
- Free & Open source
Pros:
- Easily monitors key web traffic metrics
- Dashboards can be rendered in the terminal
Cons:
- GoAccess is intended to be used only for web logs, although custom log formats are supported
- Limited scale: in-memory storage (hash tables) that can spill to disk is the only storage option
16. Grafana Loki
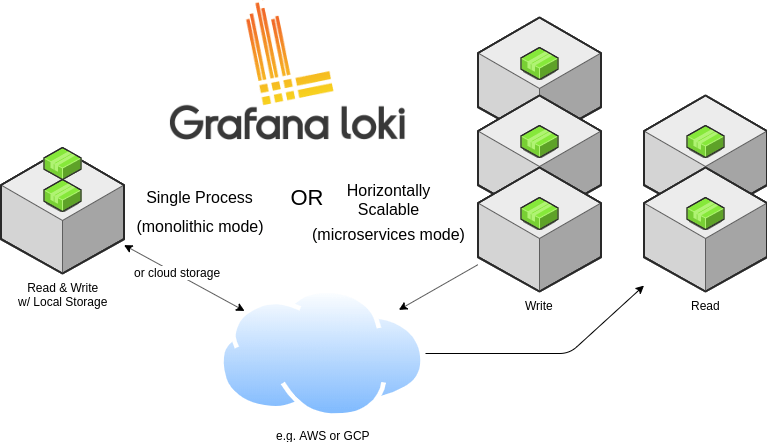
Source: Grafan Loki GitHub Page
Loki and its ecosystem are an alternative to the ELK stack, but it makes different trade-offs. By indexing only some fields (labels), it can have a completely different architecture. Namely, the main write component (Ingester) will keep chunks of logs in memory, making recent queries fast. As chunks get older, they are written in two places: a key-values store (e.g. Cassandra) for labels and an object store (e.g. Amazon S3) for the chunk data. Neither of them need background maintenance as you add data (like Elasticsearch/Solr need merges).
If you query older data, you typically filter by labels and timeframe. This restricts the number of chunks that have to be retrieved from the long term storage.
Key features:
- Logs and metrics in the same UI (Grafana)
- Loki labels can be consistent with Prometheus labels
Pricing:
- Free & Open source
- There’s also Grafana Cloud, offering Loki as SaaS (with an on-premises option as well). Prices start at $49, which includes 100GB of log storage (30 days retention) and 3000 metrics series
Pros:
- Faster ingestion compared to ELK: less indexing, no merging
- Small storage footprint: smaller index, data is only written once to the long term storage (which typically has built-in replication)
- Uses cheaper storage (e.g. AWS S3)
Cons:
- Slower queries and analytics for longer time frames compared to ELK
- Fewer log shipper options compared to ELK (e.g. Promtail or Fluentd)
- Less mature than ELK (e.g. more difficult to install)
17. Systemd Journal
Did you know that most Linux systems have a complete log management solution on board? Distributions based on systemd contain journald and journalctl.
systemd-journald – All Linux system processes write logs to the system journal, which is managed by journald. The system journal is local log storage. Check out this tutorial to learn more about journald, from what is and how to configure it to the most useful commands you should know and how to use it for centralizing Linux logs.
and how you can use it for centralized logging from this t
journalctl is the command line client to display logs with various filter options like time, system unit or any other field stored in the log event. Journalctl is not only useful for log search, but it also provides various other functions such as management of the system journal storage.
Journal-upload is a service to forward log events to a remote endpoint. Though if you’re interested in log centralization, have a look at forwarding journald logs via log shippers into the Elastic Stack to benefit from Elastic Stack features.
Key features:
- Supports structured logging out of the box
- Indexes all fields for fast searches
- Built-in compression
- Syslog-compatible API
Pricing: Free & Open source
Pros:
- Comes with every major Linux distribution
- No need for logrotate: you can configure retention in journald.conf
Cons:
- Binary storage means you can’t use text tools, such as grep
- No built-in centralization features
18. Logstash

Logstash is a log collection and processing engine that comes with a wide variety of plugins that enable you to easily ingest data from various sources, transform, and forward it to a defined destination. It’s part of the Elastic Stack along with Elasticsearch and Kibana, which is why it’s most often used to ship data to Elasticsearch.
Key features:
- Lots of built-in plugins for input, filter/transform, and output
- Flexible configuration format: you can add in-line scripts, include other configuration files, etc
Pricing: Free & Open source
Pros:
- Easy to get started and move to complex configurations
- Flexible: Logstash is used in various logging use cases and even for non-logging data
- Well-written documentation and lots of how-tos on the web
Cons:
- High resource usage, compared to other log shippers
- Lower performance, compared to alternatives
If you want to understand better how Logstash works, check out our Logstash tutorial, as well as other related posts:
- 5 Logstash Alternatives
- Elasticsearch Ingest Node vs Logstash Performance
- Handling Multiline Stack Traces with Logstash
- Recipe: Reindexing Elasticsearch Documents with Logstash
- Replaying Elasticsearch Slowlogs with Logstash and JMeter
19. rsyslog

Originally a syslog daemon, rsyslog has evolved into a free general-purpose logging tool that can read data from multiple sources, parse or enrich it, buffer it, and finally ship it to various destinations. It implements basic syslog protocol and extends it with content-based filtering, flexible configuration options, and advanced filtering capabilities and adds new features such as using TCP, SSL, and RELP for transport. It offers high performance, high security, and modular design.
Key features:
- Low memory and CPU footprint
- Fast, grammar-based parsing
- Modular architecture suits centralizing logs
Pricing: Free & Open source
Pros:
- Comes out-of-the-box with most Linux distributions
- Great performance for most supported use cases
- Well-suited for large-scale use cases with features like rulesets, input and output queues, and built-in
scripting language
Cons:
- More difficult to configure, compared to other log shippers
- Documentation isn’t as well-organized, which makes for a steeper learning curve
If you want to learn more, download our free e-book on how to use ryslog to collect and parse data and/or go through the following related articles:
- Recipe: rsyslog + Redis + Logstash
- Recipe: rsyslog + Elasticsearch + Kibana
- Recipe: How to Integrate rsyslog with Kafka and Logstash
- Recipe: Apache Logs + rsyslog (parsing) + Elasticsearch
- Monitoring rsyslog’s Performance with impstats and Elasticsearch
- Monitoring rsyslog with Kibana and Sematext Infrastructure Monitoring
- Rsyslog 8.1 Elasticsearch Output Performance
- Structured Logging with Rsyslog and Elasticsearch
20. syslog-ng
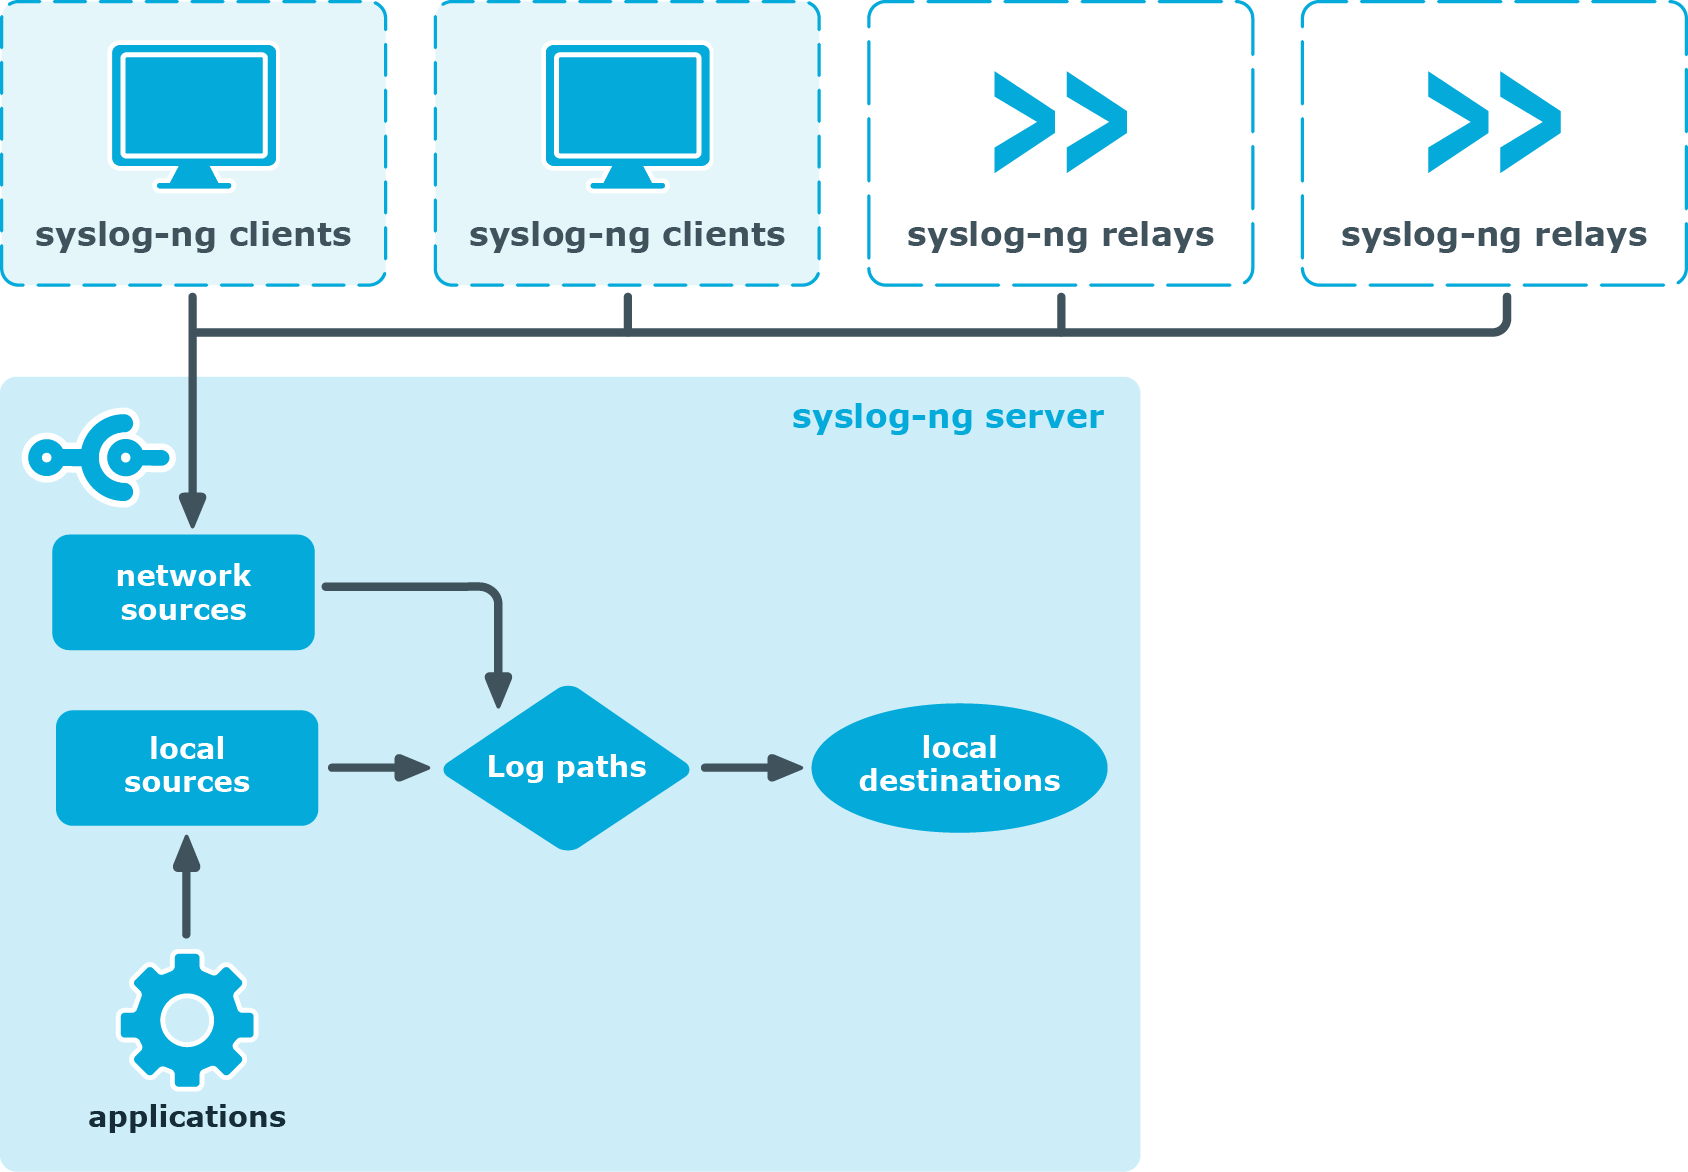
Source: Syslog-ng Documentation
syslog-ng is a log shipper that evolved similarly to rsyslog, into a multi-functional data processing engine. In fact, it’s the other way around, as rsyslog was created later. Functionality is very similar, though each has its unique features.
Key features:
- Great packaging support for many flavors of UNIX
- Grammar-based parser (PatternDB)
- Can use its buffer to correlate
log messages
Pricing: Free & Open source
Pros:
- Great performance and low resource usage
- Easy-to-use configuration format
- Good documentation
Cons:
- Buffers after parsing (like Fluentd below) which may lead to backpressure
21. Fluentd
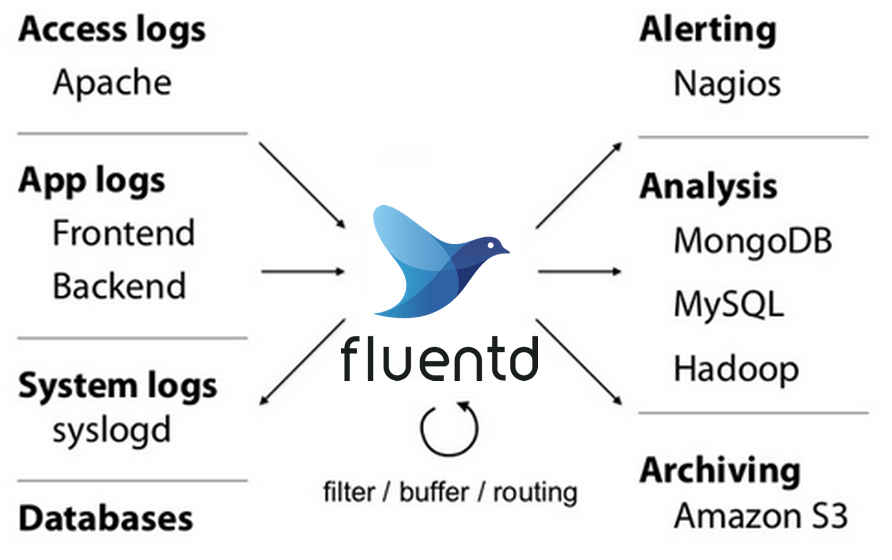
Source: Fluentd GitHub Page
A good Logstash alternative, Fluentd is a favorite among DevOps, especially for Kubernetes deployments, as it has a rich plugin library. Like Logstash, it can structure data as JSON and touches all aspects of log data processing: collecting, parsing, buffering, and outputting data across various sources and destinations.
Key features:
- Good integrations with libraries and with Kubernetes
- Lots of built-in plugins, easy to write new ones
Pricing: Free & Open source
Pros:
- Good performance and resource usage
- Good plugin ecosystem
- Easy-to-use configuration
- Good documentation
Cons:
- No buffering before parsing, which may cause back pressure in the logging pipeline
- Limited support for transforming data, like you could do with Logstash’s mutate filter or rsyslog’s variables and templates
22. Filebeat
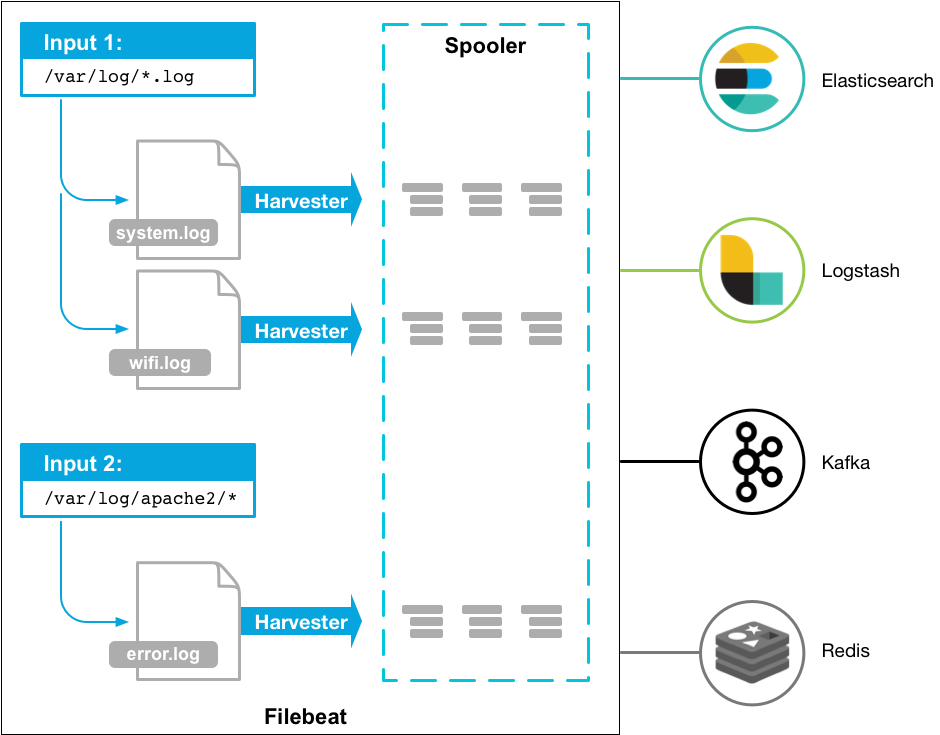
Source: Filebeat Documentation
Filebeat is a lightweight log shipper designed to complement Logstash, which is heavier. Typically, you’d send logs from Filebeat to Logstash and then Elasticsearch. Larger deployments may use Apache Kafka as a buffer. Filebeat can also send data directly to Elasticsearch. Minimal parsing can be done on the Filebeat side (e.g. JSON parsing) or on the Elasticsearch side, on Ingest nodes.
Key features:
- Lightweight and easy to use
- Modules are available for common use cases (such as Apache access logs). You can use them to set up Filebeat, Ingest, and Kibana dashboards with just a few commands
Pricing: Free & Open source
Pros:
- Low resource usage
- Good performance
Cons:
- Limited parsing and enriching capabilities
Further reading:
- Using Filebeat to Send Elasticsearch Logs to Sematext Logs
- How to Ship Kibana Server Logs to Elasticsearch
23. Logagent
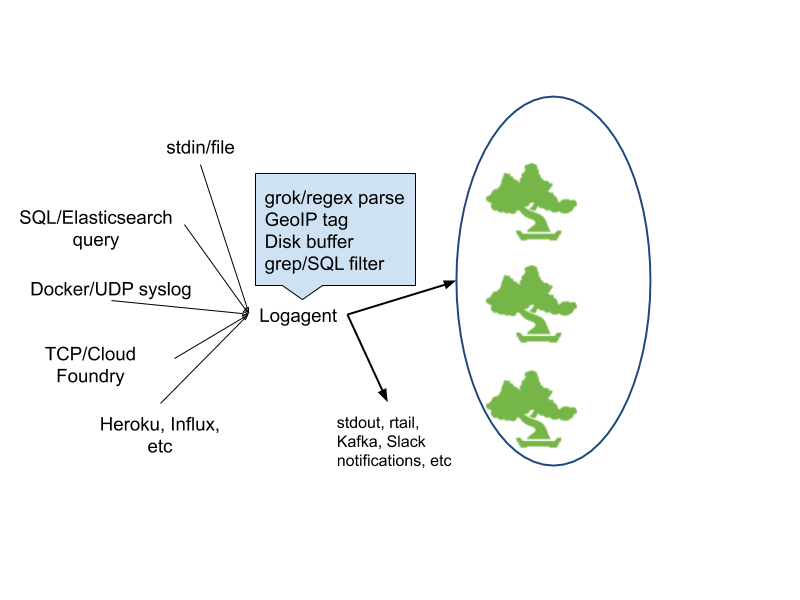
Logagent is a modern, lightweight, and open-source log shipper featuring extensible log parsing, on-disk buffering, secure transport and bulk indexing to Elasticsearch or Sematext Cloud.
As it uses few system resources, it’s suitable for deploying on edge notes and devices, while its ability to parse and structure logs make it a great Logstash alternative. Logagent is designed to be very easy to use even for those who haven’t used a log shipper before.
Key features:
- Includes lots of parsing rules and can automatically detect common types of logs and parse them
- Easy integration with Docker and Kubernetes
Pricing: Free & Open source
Pros:
- Easy to use, especially on Docker and Kubernetes
- Good performance and resource usage
- Easy to extend. This is why, beyond the “usual” inputs, like files, TCP and Kafka, you’ll find some that are more specific: from querying Elasticsearch or Cassandra to acting as an MQTT client or collecting dust sensor measurements
Cons:
- The ecosystem isn’t as rich as that of Logstash or Fluentd
If you’re interested in finding out more about how Logagent works, read our dedicated blog posts:
- How to Monitor Docker Containers with Sematext Logagent
- Logagent Meets Apache Kafka
- Shipping data to AWS Elasticsearch with Logagent
What Log Management Tools Will You Use?
There are some great tools in the log management landscape e that you can choose from, but it depends on your particular specifications and even personal preferences on which one suits your use-case best. You may be fine starting with an open-source framework, but keep in mind that it may not have full-blown features like Sematext Logs or Datadog.
If you need help deciding, feel free to reach out. If you need help with an open-source tool, please note that Sematext offers Logging Consulting as well as ELK production support.
You might also be interested in: