A large amount of data requires special tools. Apache Cassandra is one of those databases that can handle a large amount of data spread among many commodity servers, providing high availability and fault tolerance without a single point of failure. Developed under the umbrella of Apache Software Foundation, it ensures full visibility into the code base and being free of charge. With the possibility of spreading the data across multiple data centers and asynchronous, masterless replication, we get a workhorse that will handle whatever we throw at it.
However, handling a large amount of data across different data centers spread across different geographical locations requires good monitoring. Monitoring that will provide holistic visibility into the cluster, the read and writes, companions, and caches. Monitoring, in which you won’t have to use multiple tools to get Cassandra metrics, operating system metrics, and JVM metrics. One that ensures the ease of shipping not only metrics themselves but also logs. Finally, one that allows you to take action on the data, providing real-time alerting and notification mechanisms.
In other words, you need a reliable solution to track performance. Since there are many options available out there, we did the leg work for you and reviewed the best Cassandra monitoring tools to help you decide which is the one that fits your monitoring needs.
Top Apache Performance Monitoring Tools
1. Sematext
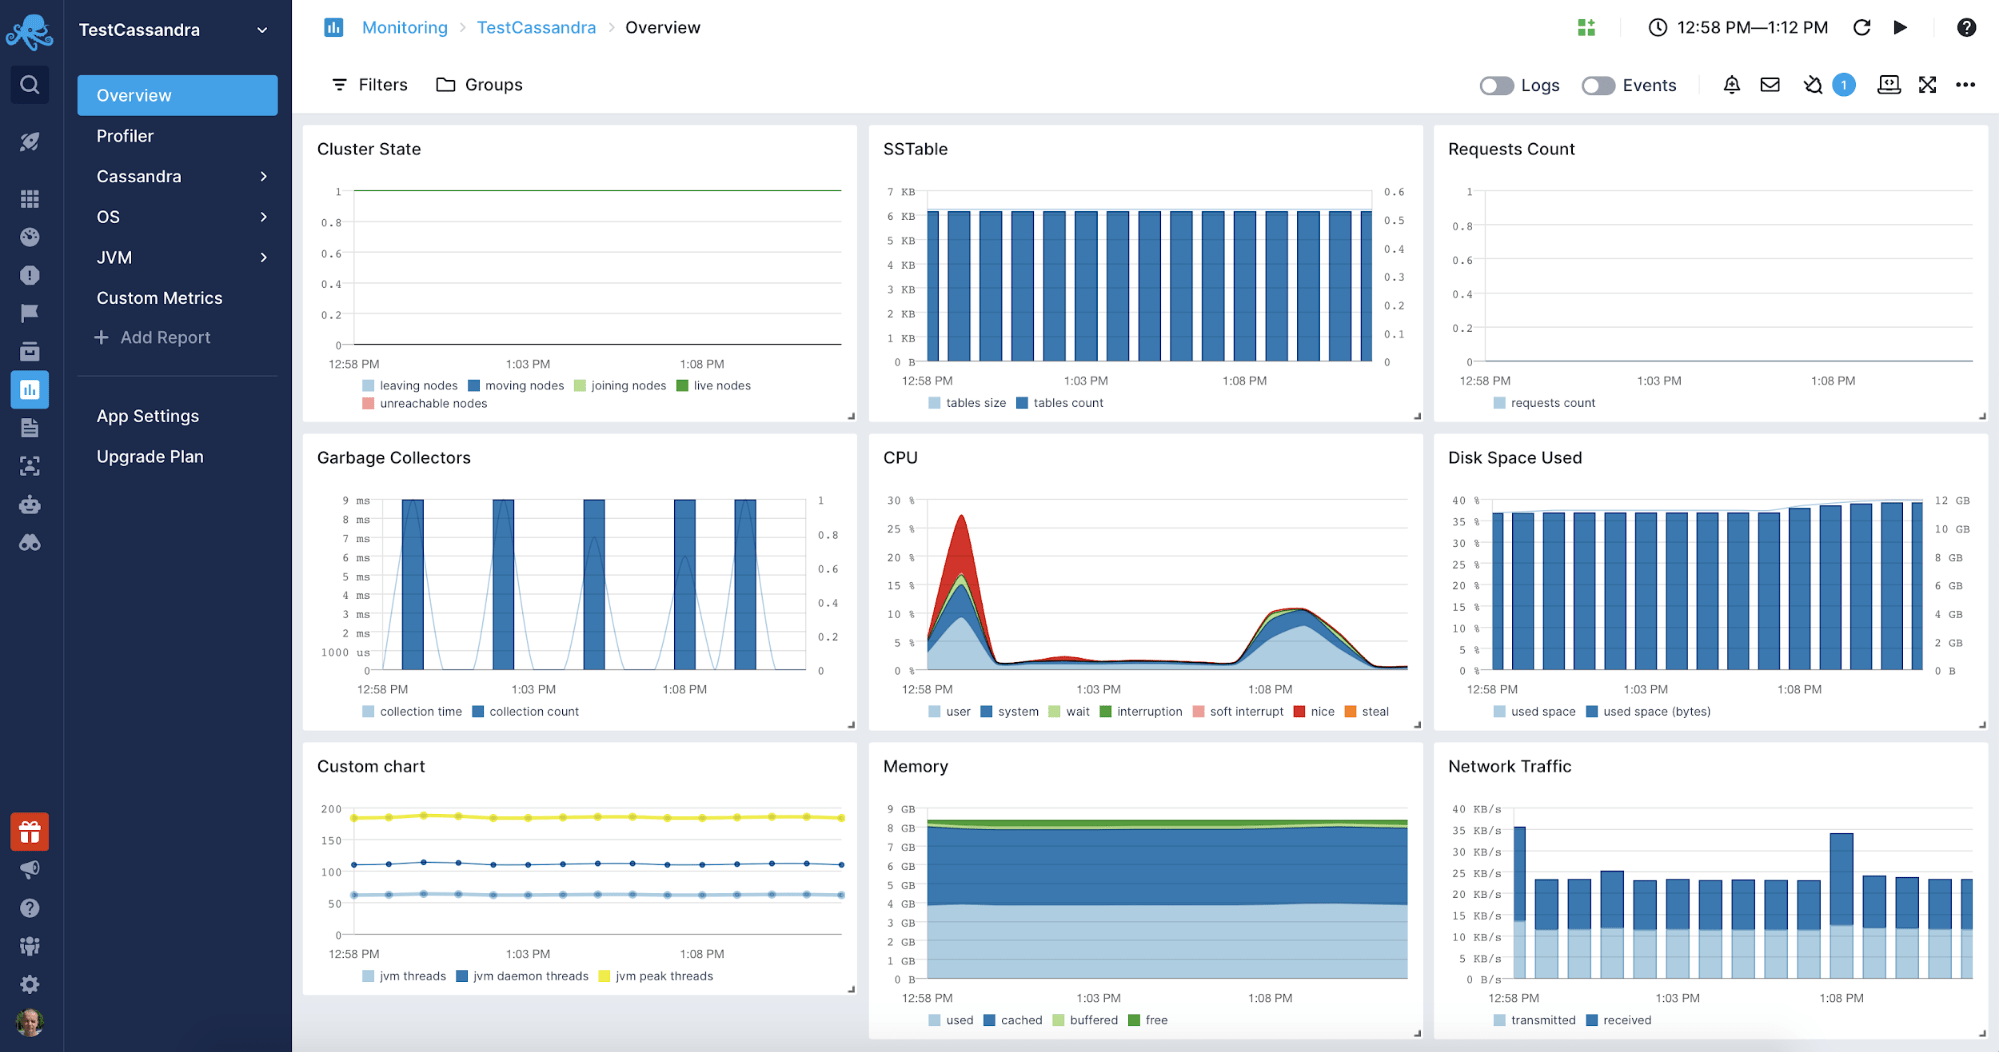
Sematext Cloud is a full-stack monitoring solution that is easy to set up and gives you in-depth visibility into your IT infrastructure, including Apache Cassandra monitoring. Sematext Monitoring makes it easy by bringing all your Apache Cassandra metrics, logs, dashboards, and alerts into one place.
It doesn’t matter what platform you are running on – Sematext gives you the juice you need to troubleshoot Cassandra node performance and health by:
- Spotting and identifying slow nodes that can degrade the responsiveness of the Cassandra cluster
- Giving alerts on slow or excessive reads and writes
- Monitoring failed or pending cluster operations, chache hits, and so on
- Keeping tabs on SSTable compactions, counts, and sizes over time
With Sematext, you can track Cassandra metrics in real time and gain deeper insights into the health of your database.
Features:
- The auto-discovery of services enables hands-off auto-monitoring for your Apache Cassandra clusters.
- Comprehensive support for microservices and containerized environments – support for Kubernetes, Docker, and Docker Swarm with the ability to observe Apache Cassandra running in them, too; a collection of their metrics, logs, and events.
- Network, database, processes, and inventory monitoring in addition to Apache Cassandra metrics, providing complete visibility into the environment.
- Alerting with anomaly detection and support for external notification services like PagerDuty, OpsGenie, VictorOps, WebHooks, etc.
- Powerful dashboarding capabilities for graphing virtually any data shipped to Sematext.
- Scheduled reporting.
- Full-blown log management solution with filtering, full-text search, alerting, scheduled reporting, AWS S3, Google Cloud, Azure IBM Cloud, Digital Ocean, and MinIO archiving integrations, Elasticsearch-compatible API, and Syslog support, giving you the possibility of shipping not only Apache Cassandra metrics, but logs as well.
To start monitoring Apache Cassandra, you only need to install the agent in your environment by following the on-screen instructions. No matter if it is bare-metal, virtual machine, or container, you end up getting metrics for Apache Cassandra and the hardware it is running on. For example, the container that Apache Cassandra is running with. After that, you end up with out-of-the-box reports for each crucial group of metrics. Quick and easy.
Pricing:
The pricing depends on the number of monitored hosts or containers. Metrics monitoring is flexible and metered by the hour, making it suitable for dynamic environments that scale up and down. You only pay for what you’ve used. Logs pricing depends on the volume and retention with a per-GB volume discount as your log volume, or data retention goes up. A limited free plan is available for both metrics and logs, with paid plans starting at $3.6/month for metrics and $50/month for logs.
For more information on Sematext Cloud, check out our short video below.
2. New Relic Cassandra Monitoring
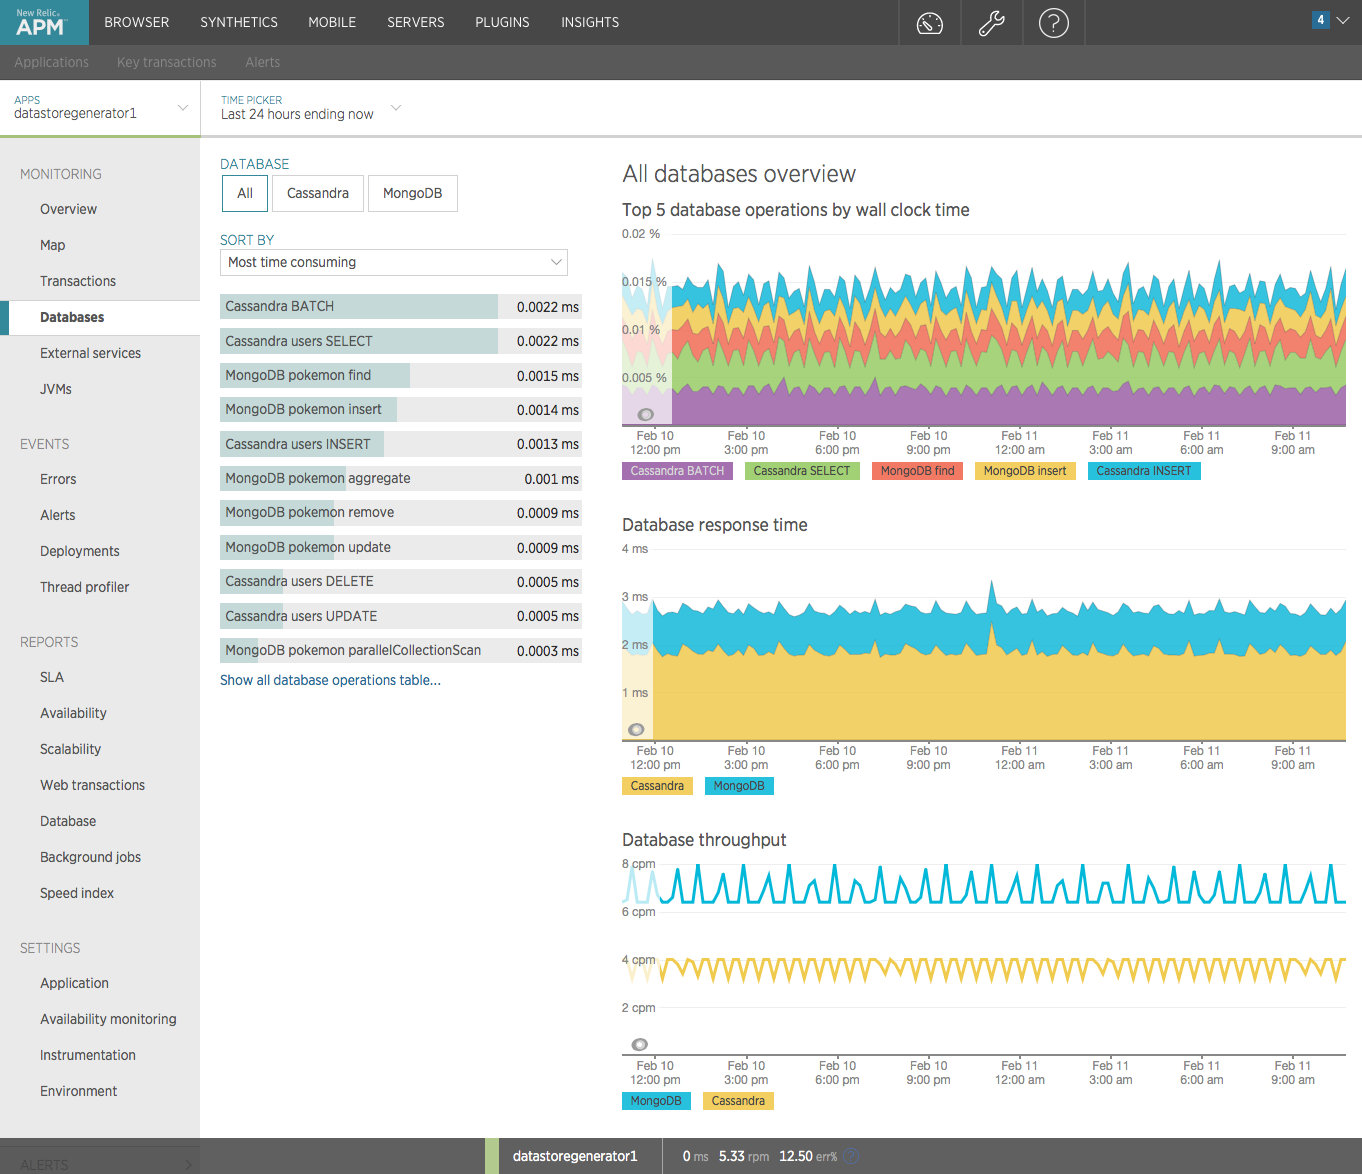
New Relic as an end-to-end observability solution with Apache Cassandra integration available in a software-as-a-service model. Its monitoring capabilities include crucial database, JVM, operating system metrics, and inventory data for full visibility into the cluster and the execution environment. Combined with alerts and New Relic Query Language, the platform provides everything needed to have everything Apache Cassandra-related under control.
Features:
- Application Performance Monitoring with dashboarding and full Apache Cassandra support.
- Log centralization and analysis allowing you to send not only Apache Cassandra metrics but logs as well.
- Integrated alerting with anomaly detection.
- Rich and powerful query language – NRQL.
- Integration with most known cloud providers such as AWS, Azure, and Google Cloud Platform makes it easy to monitor Apache Cassandra on common platforms.
The installation is quite simple and requires you to follow the instructions depending on the environment in which Apache Cassandra is working. If you are running an orchestrated environment, you will end up modifying a few YAML files, but it is not a very complicated step. If New Relic becomes your platform of choice, just follow the documentation carefully and you shouldn’t have any issues.
Pricing:
User and data-based pricing available. The user type (Standard, Pro, Enterprise) determines the available features and the amount of data you can send without additional fee. For example, the Standard plan includes up to 5 users with full access and an unlimited number of basic users without access to features such as APM, infrastructure monitoring, Synthetics, Serverless monitoring, and more.
Want to see how Sematext stacks up? Check out our page on Sematext vs New Relic.
3. Datadog Apache Cassandra Monitor
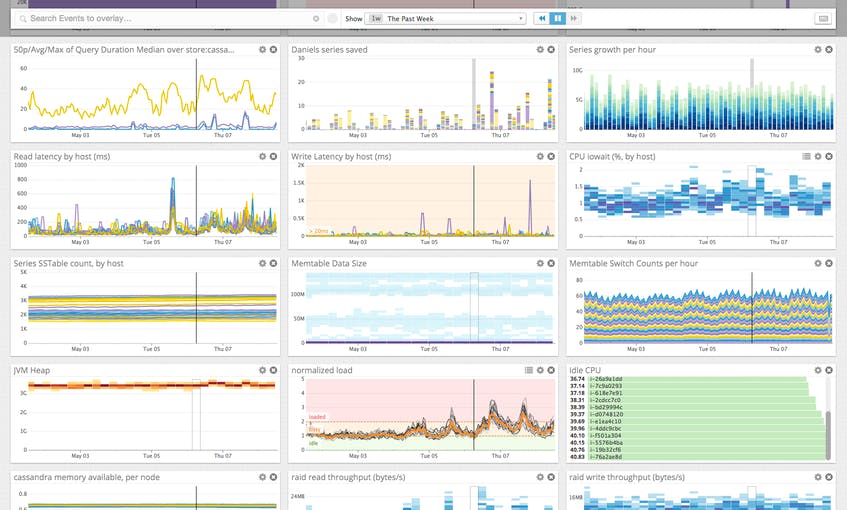
Datadog is a full-stack monitoring tool for your Apache Cassandra clusters as well as an extended set of features needed to monitor your infrastructure, applications, containers, network, and logs. After adjusting the agent configuration, you will be able to use the relevant database, JVM, and operating system metrics for graphing and correlations.
Features:
- Apache Cassandra Application performance monitoring with a large number of additional integrations available and distributed tracing support.
- Logs centralization and analysis allowing you to ship Cassandra logs and correlate them with metrics.
- Network and host monitoring.
- Alerting with machine learning capabilities.
- Collaboration tools for team-based discussions simplifying the handling of multiple large clusters.
- API allowing to work with the data, tags, and dashboards.
All that is needed is installing the DataDog agent. If you already have the agent installed, you are good to go; if you don’t, just download the agent package and follow the instructions. The only thing to keep in mind is that the default limit is 350 metrics per monitored instance. So you may end up being forced to contact DataDog support when you need to collect more metrics or limit the JMX metrics collection in the DataDog JMX agent configuration. You can also automatically gather Apache Cassandra logs if you want to have complete visibility into the distributed database.
Pricing:
Feature, host, and volume-based pricing combined – each part of the solution is priced differently and billed annually or on-demand. The on-demand billing makes the tool about 17 – 20% more expensive than the annual pricing at the time of this writing.
Want to see how Sematext stacks up? Check out our page on Sematext vs Datadog. We have also created a list of Datadog’s top alternatives to help you decide.
4. ManageEngine Applications Manager
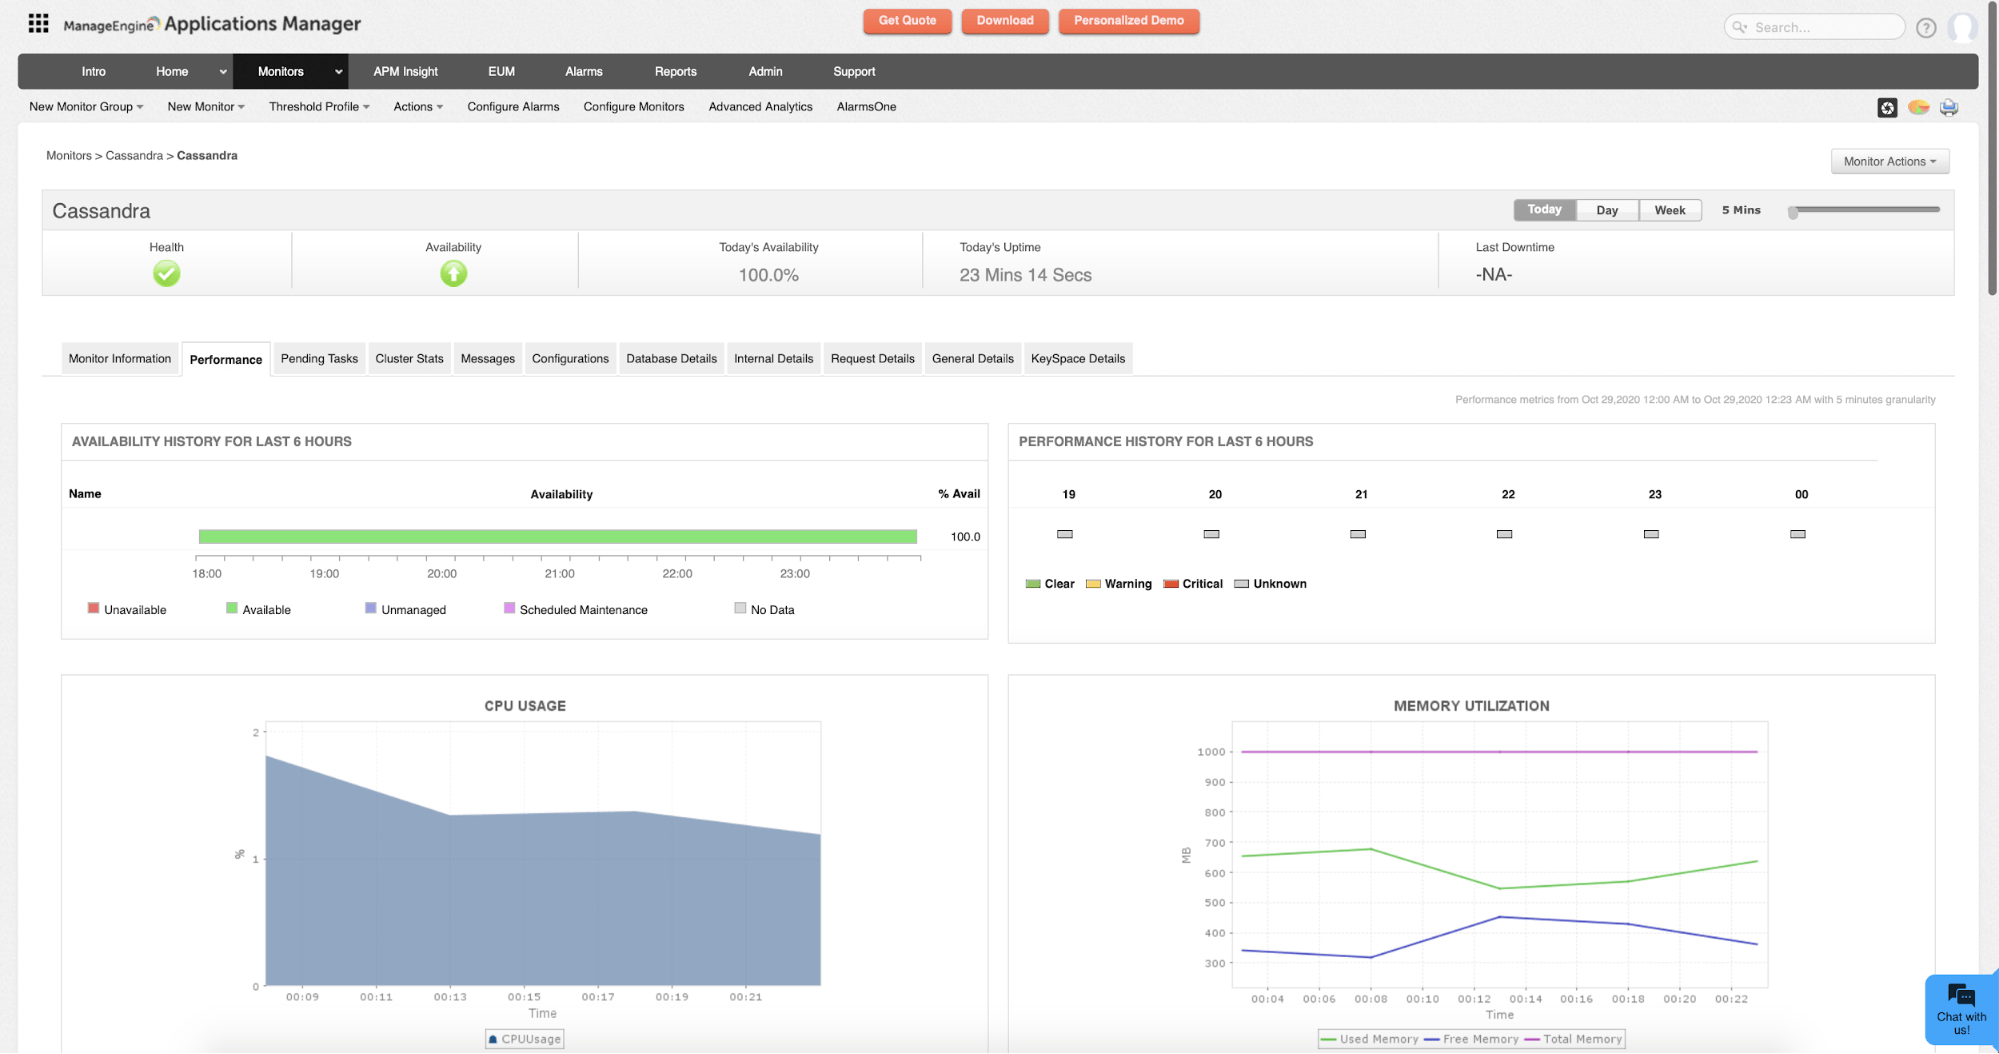
ManageEngine Applications Manager is a single, integrated application performance monitoring for infrastructure and applications, including Apache Cassandra. It supports various infrastructure architecture like bare metal, virtual machines, and containers and includes a wide variety of application integrations. All of that combined with actionable alarms and powerful reporting, gives a proper observability solution for your Apache Cassandra and the whole infrastructure.
Features:
- Apache Cassandra application performance monitoring with a large number of additional integrations available.
- Alerting engine with notifications support.
- Docker and Kubernetes integrations making it easy to monitor Cassandra running in different environments.
- Support for Apache Cassandra metrics when running on common cloud providers like Amazon Web Services, Microsoft Azure, Google Cloud Platform, and OpenStack.
Adding monitoring of Apache Cassandra requires creating a monitoring link with Cassandra type and providing the location on which the database is running and the JMX port which exposes the metrics. You can choose to monitor a single instance of our database or, by default, discover all the nodes forming the cluster and tell the platform to which monitoring group the data should be assigned to. Once that is done, the metrics should be present in the dedicated section of the platform providing the metrics. You can learn which metrics are monitored by looking at the official documentation.
Pricing:
ManageEngine Applications Manager comes in two versions – Professional and Enterprise. The pricing depends on the selected version, the number of monitors, and the number of users using the product with the free version available.
5. AppDynamics APM
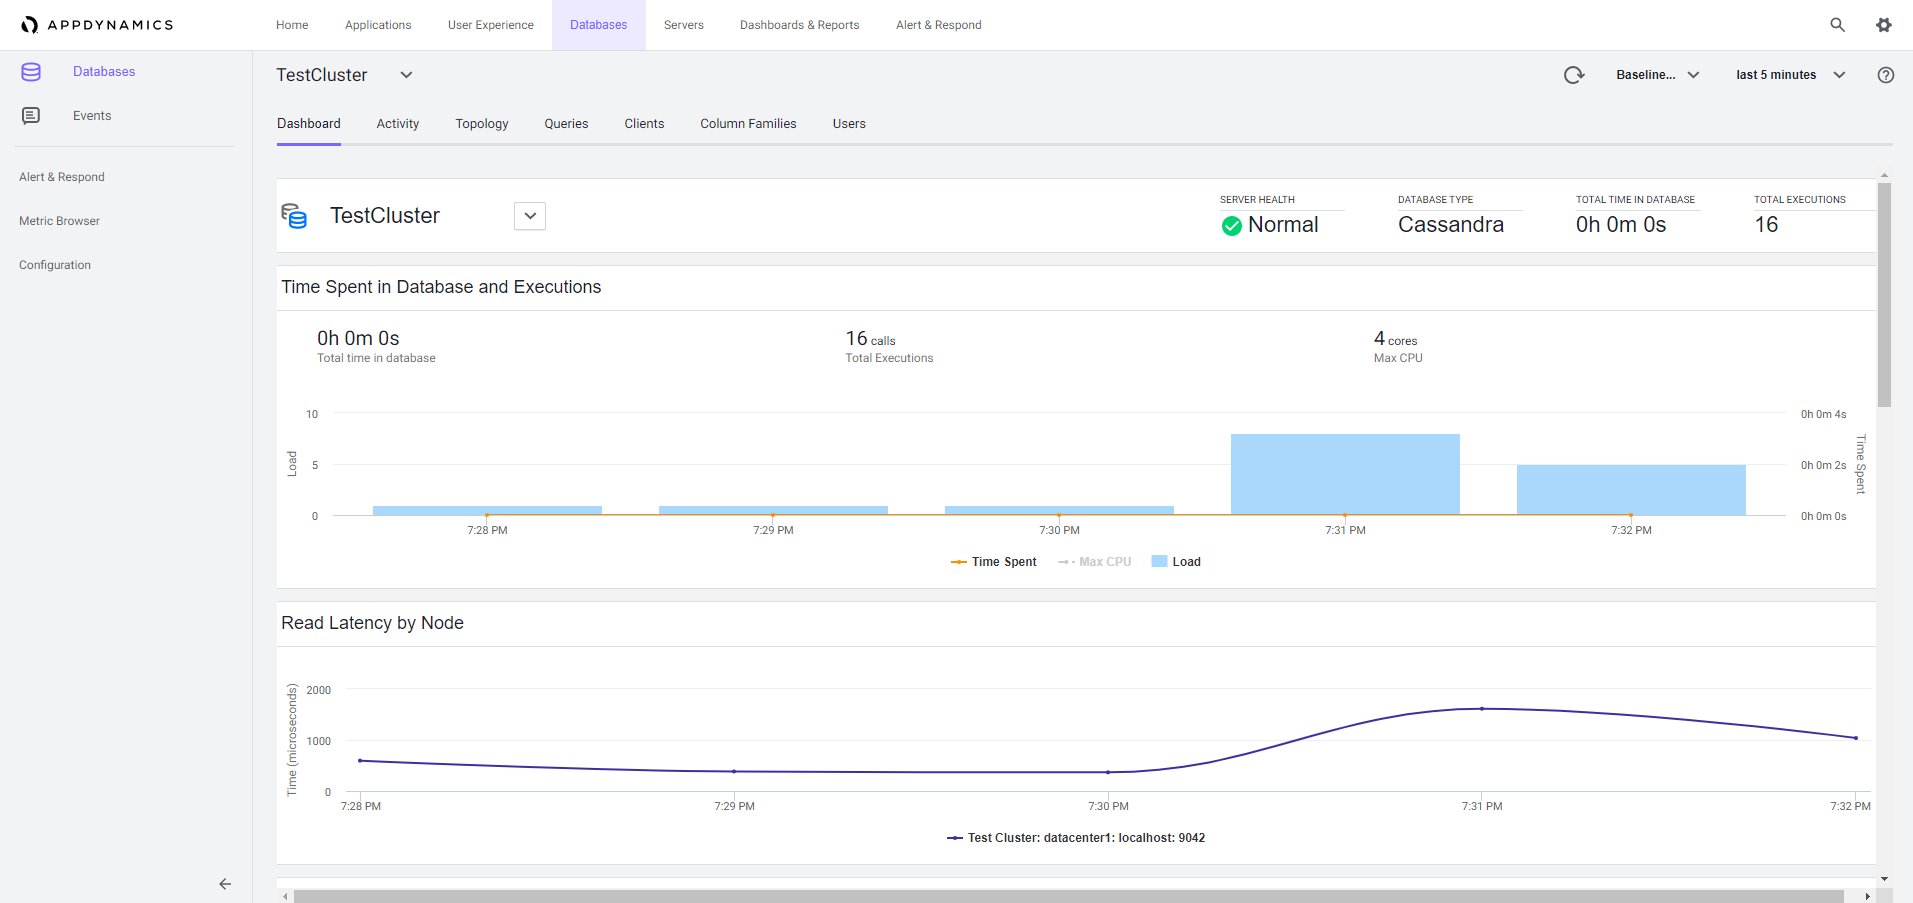
AppDynamics focuses on large enterprises. Available in both software as a service and an on-premise model, AppDynamics provides the ability to connect Apache Cassandra application performance metrics with infrastructure data, alerting, and business-level metrics. A combination of these allows you to monitor Apache Cassandra and the whole stack that runs your services. It gives you insights into your environment – from top-level transactions that the business executives understand to the code-level information useful for DevOps and developers.
Features:
- Apache Cassandra monitoring with visibility from top-level transactions to the backend calls.
- Infrastructure monitoring with network components, databases, and servers visibility providing information about status, utilization, and flow between each element.
- Machine Learning supported anomaly detection and root cause analysis features.
- Alerting with email templating and period digest capabilities.
You will need an extension to enable Apache Cassandra in your already installed AppDynamics Machine Agent or the Server Infrastructure & Monitoring. It requires a few manual steps but is pretty well documented in AppDynamics documentation. Once you go through all the steps, you get a nice view of your Apache Cassandra metrics along with all other already monitored metrics. You can also follow the UI steps with easy installation and configuration instructions. One thing to keep in mind, though not a blocker – the UI didn’t load for me correctly when using Mozilla Firefox, though Chrome worked without any issues.
Pricing:
Agent and feature-based pricing are used, which makes pricing not transparent. The amount of money you will pay for the solution depends on what features you need and want to use from the platform. For example, visibility into the CPU, memory, and disk metrics – which are crucial for Apache Cassandra – requires the APM Advanced plan.
Want to see how Sematext stacks up? Check out our page on Sematext vs AppDynamics.
6. Dynatrace
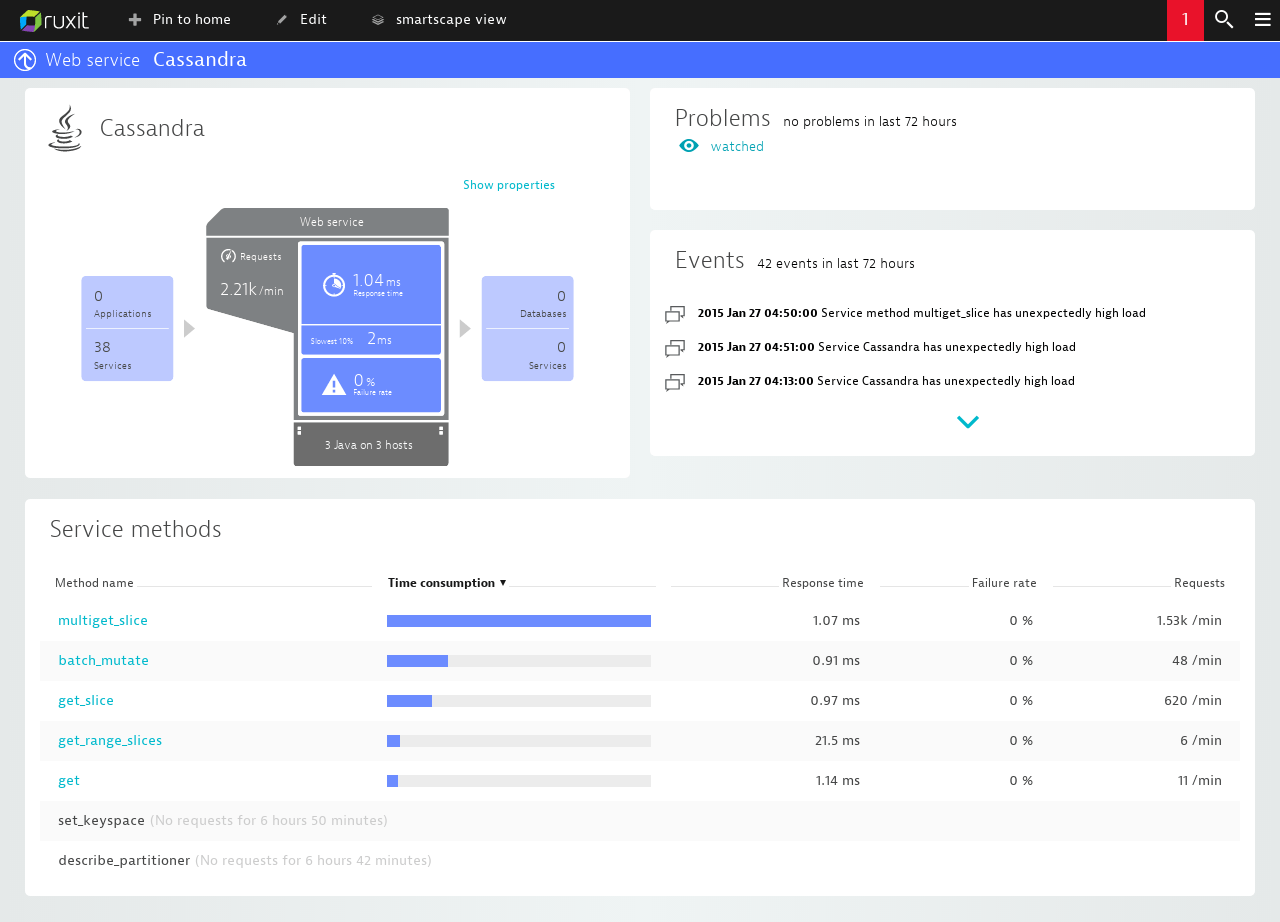
Dynatrace is a full-stack observability solution with support for Apache Cassandra. It provides a user-friendly approach to monitoring your database, infrastructure, and logs. Available in both software as a service and on-premise models, it will fulfill most of your monitoring needs when it comes to Apache Cassandra performance, its logs, and the infrastructure it is running on.
Features:
- Apache Cassandra performance monitoring with dashboarding and additional integrations for commonly used tools and code-level tracing.
- First-class Log analysis support with automatic detection of the common system and application log types.
- Diagnostic tools allow taking memory dumps, exceptions, and CPU analysis helpful in Apache Cassandra troubleshooting.
- Docker, Kubernetes, and OpenShift integrations making it easy to monitor Cassandra running in different environments.
- Support for Apache Cassandra metrics when running on common cloud providers like Amazon Web Services, Microsoft Azure, and Google Cloud Platform.
Once you have the Dynatrace OneAgent installed on a host or multiple hosts, enabling monitoring of Apache Cassandra JMX metrics is as simple as turning on one of the switches in the appropriate settings section. Once you’re done, Dynatrace will start monitoring all your Apache Cassandra clusters, and you will see all the relevant metrics in the dedicated technology.
Pricing:
Pricing is organized around features. The application performance monitoring pricing is tied to hosts and the amount of memory available on a host. Each 16GB is a host unit and the price is calculated based on the number of host units in an hour. The logs part of the solution is calculated based on the volume.
Want to see how Sematext stacks up? Check out our page on Sematext vs Dynatrace. You can also read a broader comparison between Dynatrace and its competitors.
7. SolarWinds Server & Application Monitor
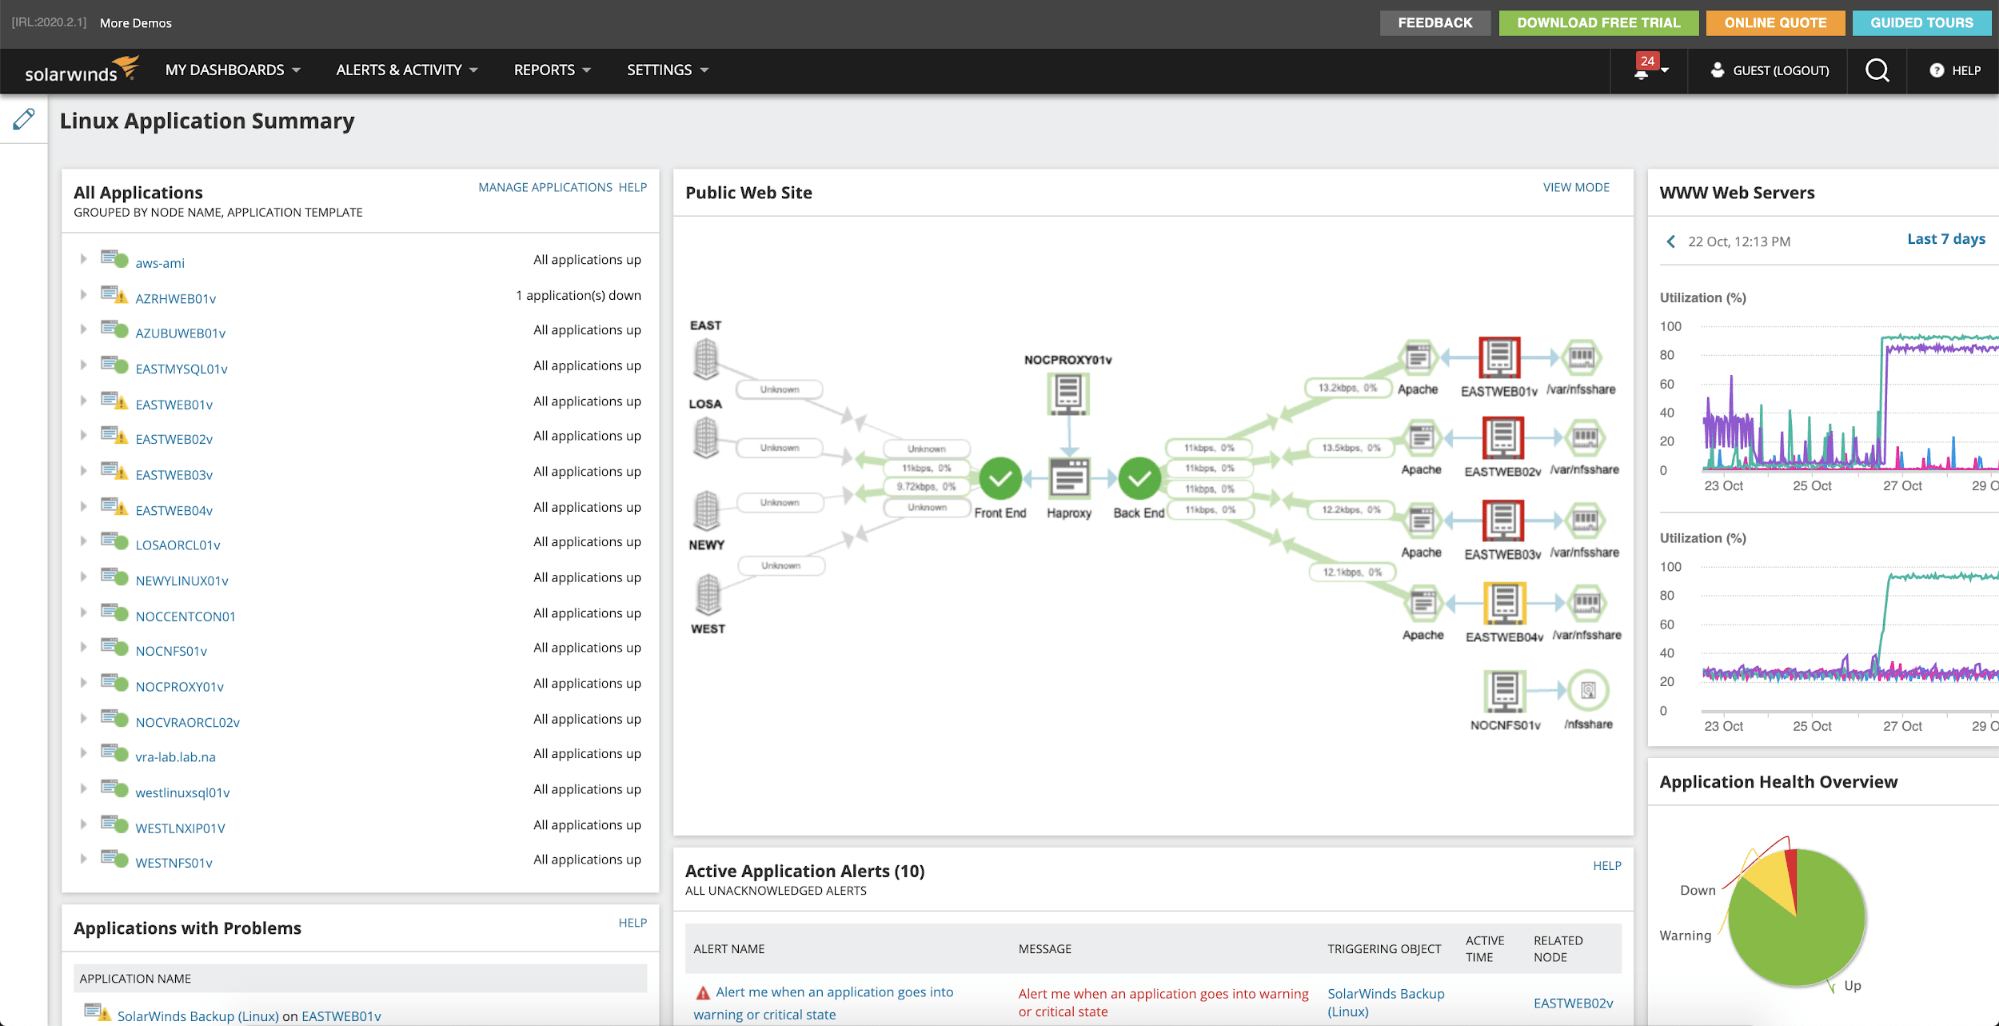
SolarWinds Server & Application Monitor provides monitoring of Apache Cassandra clusters for those of us who would like to run an on-premise monitoring solution on Microsoft Windows. It provides visibility into Apache Cassandra metrics along with Windows and Linux metrics depending on the environment of your choice. With alerting supported out-of-the-box and dashboarding capabilities, the solution is a good candidate for monitoring not only Apache Cassandra but the whole environment as well.
Features:
- Microsoft Windows-based platform for your environment including Apache Cassandra
- Out of the box alerting for keeping an eye on your Cassandra metrics
- Easy integration with Microsoft Windows-based services, like Active Directory or IIS
Pricing:
Subscription and perpetual licensing are possible starting at $1,275, with a 30-days free trial available.
8. Prometheus & Grafana
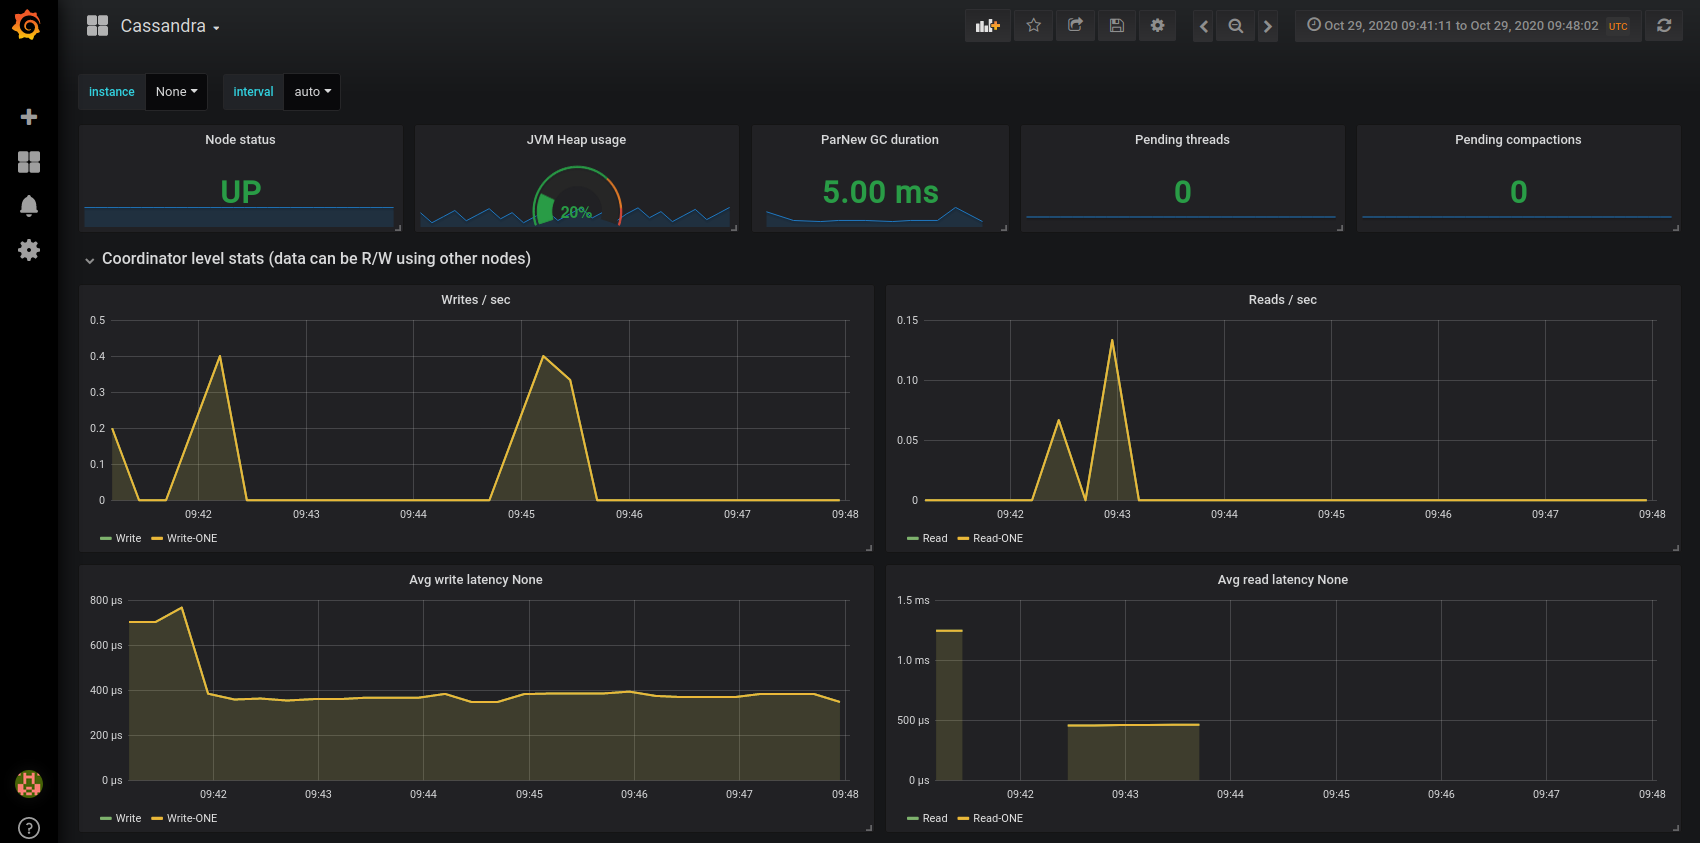
Powerful open-source combo – Prometheus and Grafana bring together great flexibility with backend, providing monitoring for metrics that are not only dedicated to Apache Cassandra. Powerful query language allows retrieving the data and powering the built-in alerting functionality. With a plethora of integration configurations available for both Prometheus and Grafana, it is easy to build an observability platform for the whole environment. However, keep in mind that an initial setup and configuration step – as well as ongoing upgrades, maintenance, etc. – will be required. These may be time-consuming and thus costly, especially if you are not familiar with the tools.
Features:
- Datastore implementing a highly dimensional data store, allowing you to gather every Apache Cassandra metric that you can think of.
- A large number of available integrations maintained by the creators and community, helping with setting up monitoring for Apache Cassandra and more.
- Out-of-the-box alerting based on powerful Prometheus query language to alert on virtually any metrics related to Apache Cassandra.
- Efficient time-series storage.
- Great visualizations flexibility allowing you to graph data that is of interest.
Installing Prometheus and Grafana is straightforward with downloading the Prometheus and Grafana packages followed by straight forward configuration. In addition to that, you only need the exporter configuration and Java Agent jar, which are publicly available. Once that is done, you can use the pre-created Grafana dashboards to go straight to the metrics and explore them in an organized fashion.
Pricing:
Free, but requires you to pay the price of maintenance and storage for your metrics.
9. Zabbix
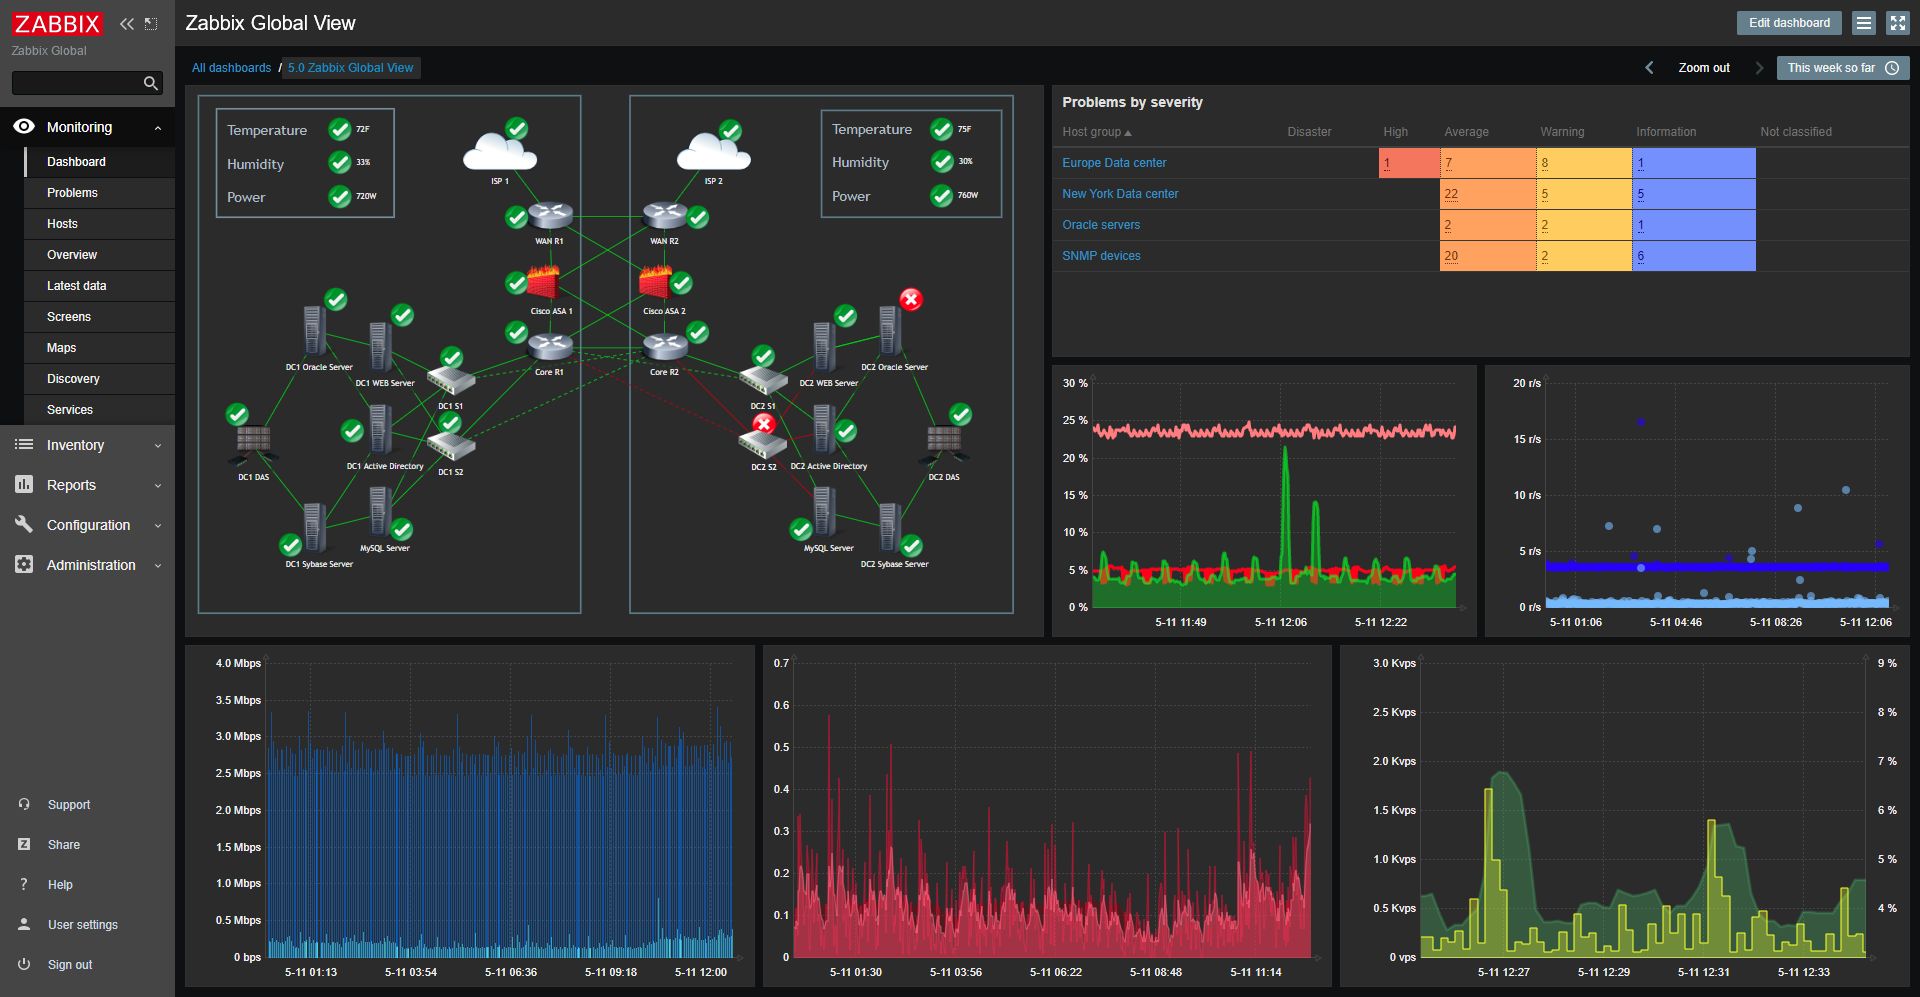
Zabbix is an open-sourced tool capable of real-time monitoring of Apache Cassandra with a proper extension template. It’s popular for database monitoring and as a monitoring solution for large scale enterprises and small companies. If you are looking for a solution with a large community, well supported and free of charge, you should look at Zabbix. Its multi-system agents allow you to gather key performance indicators across your environment and create alerts on them. With the template-based setup and auto-discovery, you can speed up even the largest setups.
Features:
- Problem detection and prediction mechanism with flexible thresholds and severity levels defining their importance helping.
- Multi-lingual, multi-tenant, flexible UI with dashboarding capabilities and geolocation support for large organizations with data centers spread around the world perfectly suitable for multiple Apache Cassandra clusters spread around multiple datacenters.
- Support for adjustable notifications with out-of-the-box support for email, SMS, Slack, Hipchat, and XMPP and escalation workflow.
- Template-based host management and auto-discovery for monitoring large environments and suitable for dynamically changing Apache Cassandra environments.
When installing and configuring Zabbix, I was reminded of the good old times of installing and running Apache with PHP and MySQL. I had to take care of each piece of required software and include additional templates to fetch metrics for Cassandra. Keep that in mind when choosing Zabbix as the solution.
Pricing:
Zabbix is open-sourced and free. However, you can subscribe for support, consultancy, and training around it if you want to quickly and efficiently extend your knowledge about the platform.
10. Graphite & Grafana

Graphite and Grafana is another open-source monitoring mix combining great flexibility with the backend to measure Apache Cassandra’s metrics and more. You can use out-of-the-box Graphite UI, but if you prefer, Grafana may be the UI of choice and give you even more possibilities and graphing options. Like with Prometheus and Grafana, it is easy to build an observability platform for the whole environment with multiple solutions supporting Graphite as the metrics storage. Keep in mind that an initial setup and configuration step will be required and may be time-consuming.
Features:
- Efficient time-based datastore allowing you to gather every Apache Cassandra metric that you can think of.
- A large number of available integrations helping with setting up monitoring for Apache Cassandra and more.
- Alerting based on Grafana functionality.
- Great visualizations flexibility allowing you to graph data that is of interest.
Similar to Zabbix, Graphite required a bit of work when it came to installation and configuration, but once I got it to work everything I needed was there. The additional plus is that Grafana supports Graphite as the source for the metrics, so not only do you get a very efficient metrics storage, but also modern and flexible software for building out dashboards that I needed.
Pricing:
Free, but requires you to pay the price of maintenance and storage for your metrics.
What Tool Will You Choose for Cassandra Monitoring?
Apache Cassandra isn’t a simple system. It’s a complicated distributed database capable of handling large quantities of data without having a single point of failure and being fault-tolerant. It is designed to spread data across multiple data centers spread across different geographical locations. Such software requires special treatment and you need a good observability solution to be able to monitor its activity.
You want to be sure you have each crucial metric under control. Your platform needs to provide out-of-the-box alerting working in real time so that you are notified about issues as soon as they start happening and before your users notify the degradation of the service.
Finally, choose a tool that will provide monitoring for your whole infrastructure and software stack. Not only when it comes to metrics, but logs, real user monitoring, and so on. You need a solution that enables you to correlate everything in one place, such as Sematext. There’s a 14-day free trial for you to try all its functionalities. Give it a try!