Infrastructure Monitoring
Get complete visibility into your infrastructure
Detect performance issues before they even occur. Map and monitor your whole infrastructure in real-time, on-premise or in the cloud.
Get Started
Free for 14 days. No credit card required.
Top-rated solutions in the industry
Case Studies

CoEnterprise
...by far the best-priced "OOTB" logging solution we found
BlockGen (Stratumsphere)
Sematext just worked as we wanted it to, end of story....we are glad we found it
 Zach Aufort, BlockGen CEO

iQmedia
We gained valuable insight into usage of our processes in addition to precisely knowing the location of processes without going to a manually maintained map

Pygmalios
Combining server monitoring with Docker container monitoring and logging was the product feature we found most helpful
 Ján Antala, Pygmalios VP Engineering

UALA
...it is the ideal monitoring tool for our infrastructure

Fenom Digital
...Sematext provided the perfect balance of full-featured functionality combined with transparent pricing
Transparent pricing based on your needs. No sales quotas.
Customize each plan based on daily data volume and retention period. You pick the plan with the features you like and customize it to meet the needs of your business. It’s as simple as that.
Fast and reliable support team you can count on.
In any circumstance, whether it’s through email, live chat, or phone calls, you will have a premium experience and be a priority to us.
One platform to troubleshoot your entire stack. Enjoy.
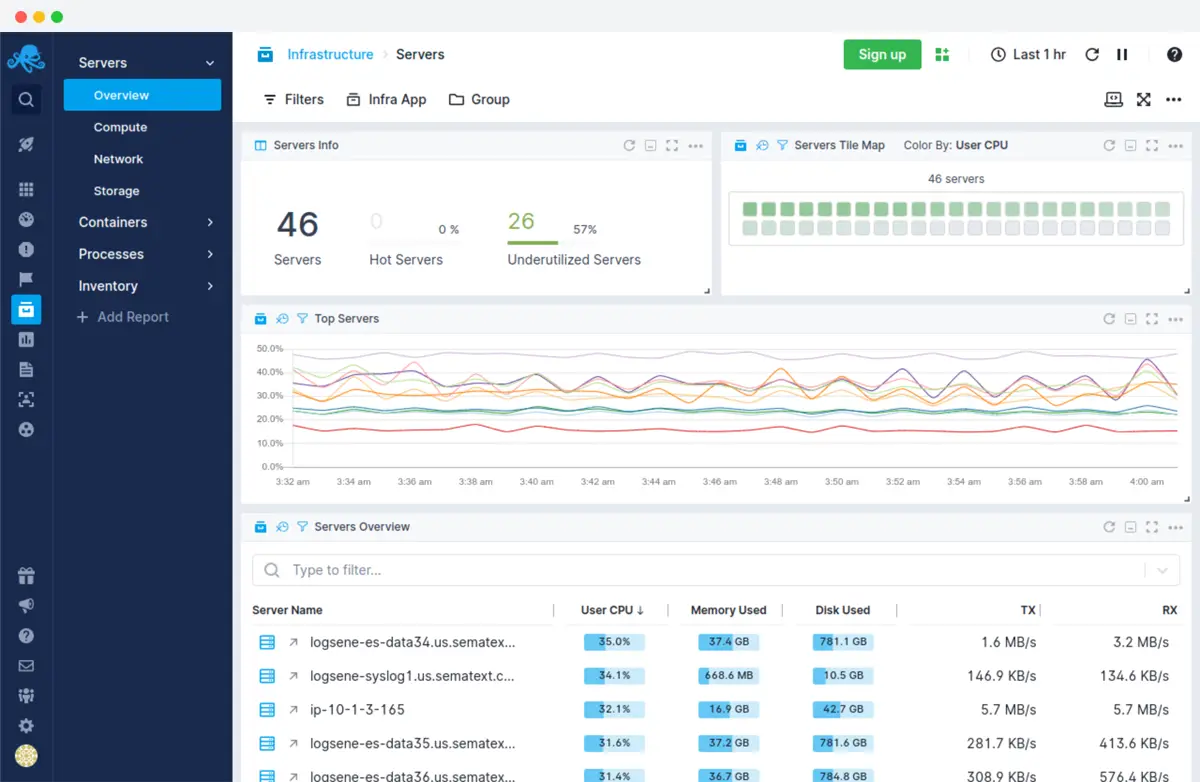
Troubleshoot performance issues proactively and detect potential business impacts and opportunities with real-time data. All your performance data in one place.
Resolve production issues fast and easily.
Get out-of-the-box monitoring charts, collect logs, key metrics and events to cut troubleshooting time in half. Save time and effort by tracking only the metrics that matter without spending time building your own dashboards.
- Integrated log monitoring, infrastructure, website and API monitoring
- Detect anomalies and receive alerts for latencies, error rates, throughput, etc.
- Easily share access to logs and metrics dashboards with your team
- Combine metrics and logs to cut troubleshooting time in half
- Out-Of-The-Box charts and alerts for the most important metrics
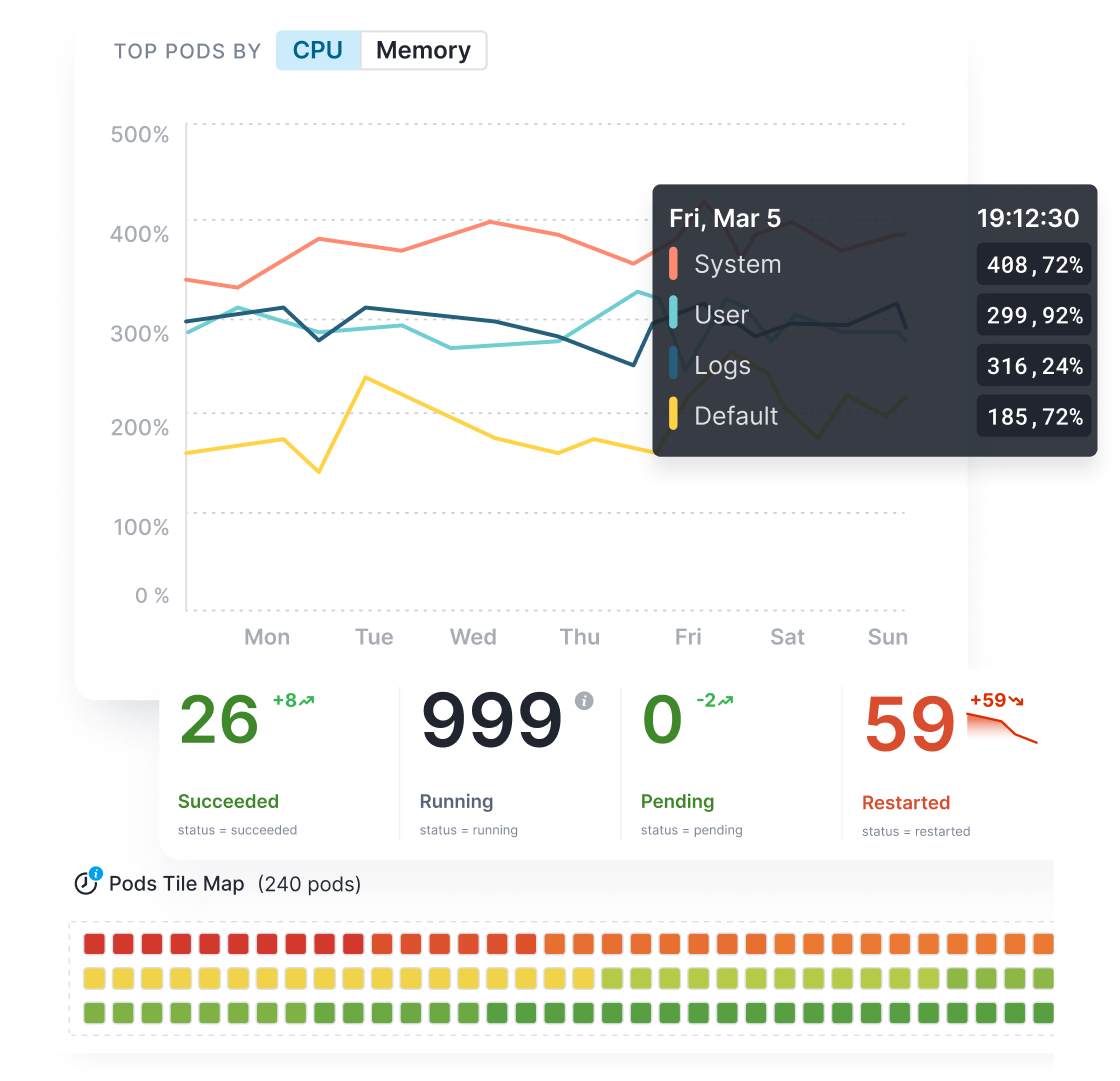
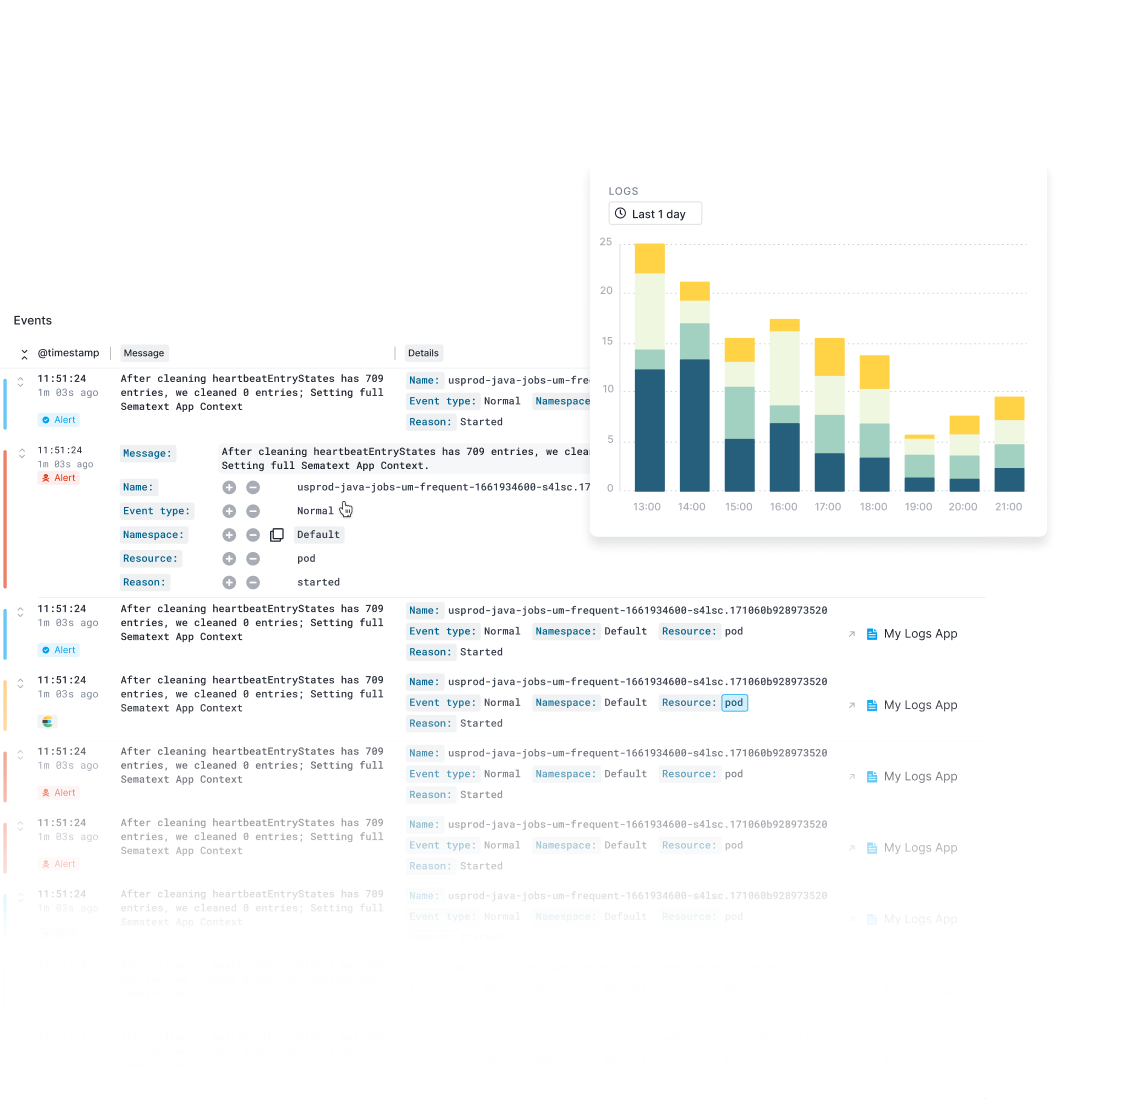
Streamline metrics and logs in one, unified view.
Combine metrics with application and server logs, events, alerts, anomalies, and more to monitor and troubleshoot faster from a single dashboard.
- Get to the root cause in minutes
- Find similar metric patterns with built-in metric correlation
- Forget about ssh-ing to servers and grepping logs
- Instantly see your apps' and servers' logs based on metric spikes
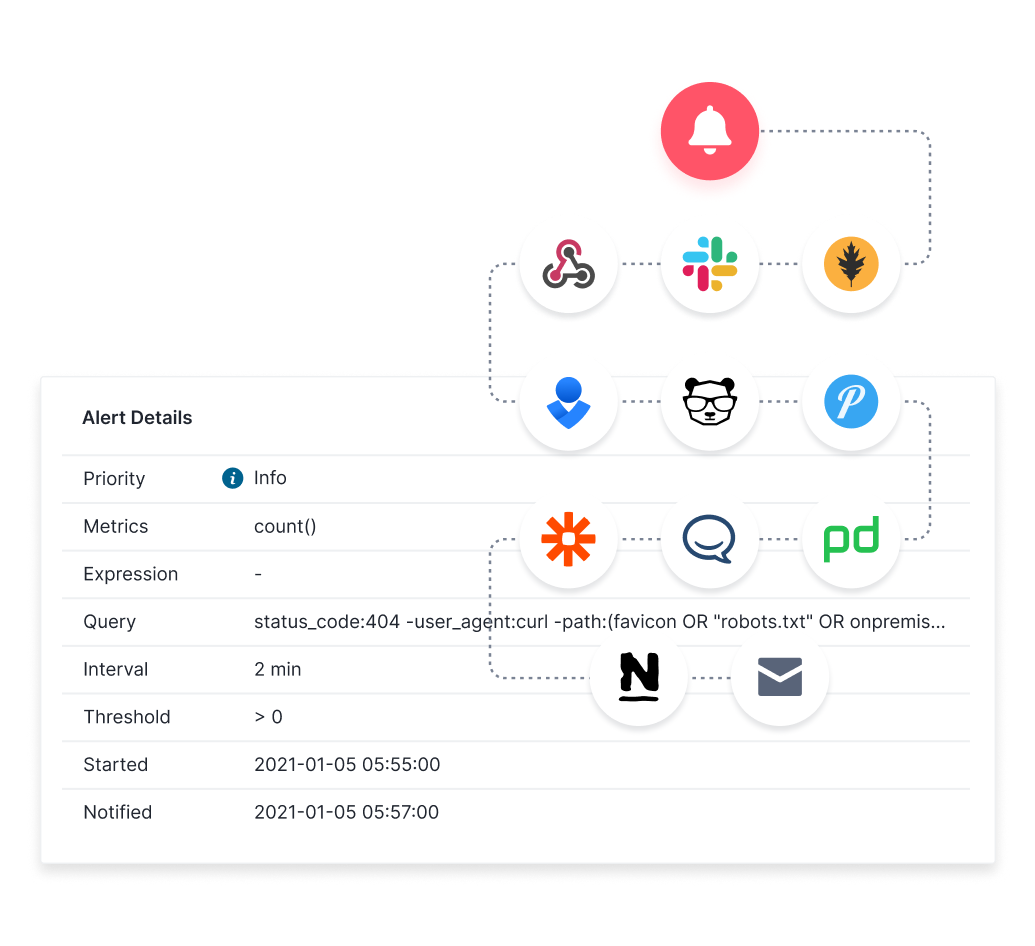
Stack-wide alerting system that has your back.
You can alert on metrics, as well as logs.
- Create an alert rule on any metric, set a priority level, and use metric filters to narrow down alert rules
- Set up custom anomaly detection or threshold alerts
- Use heartbeat alerts for each Monitoring App. If Sematext does not hear from any instance of your application for over N minutes, it will alert you.
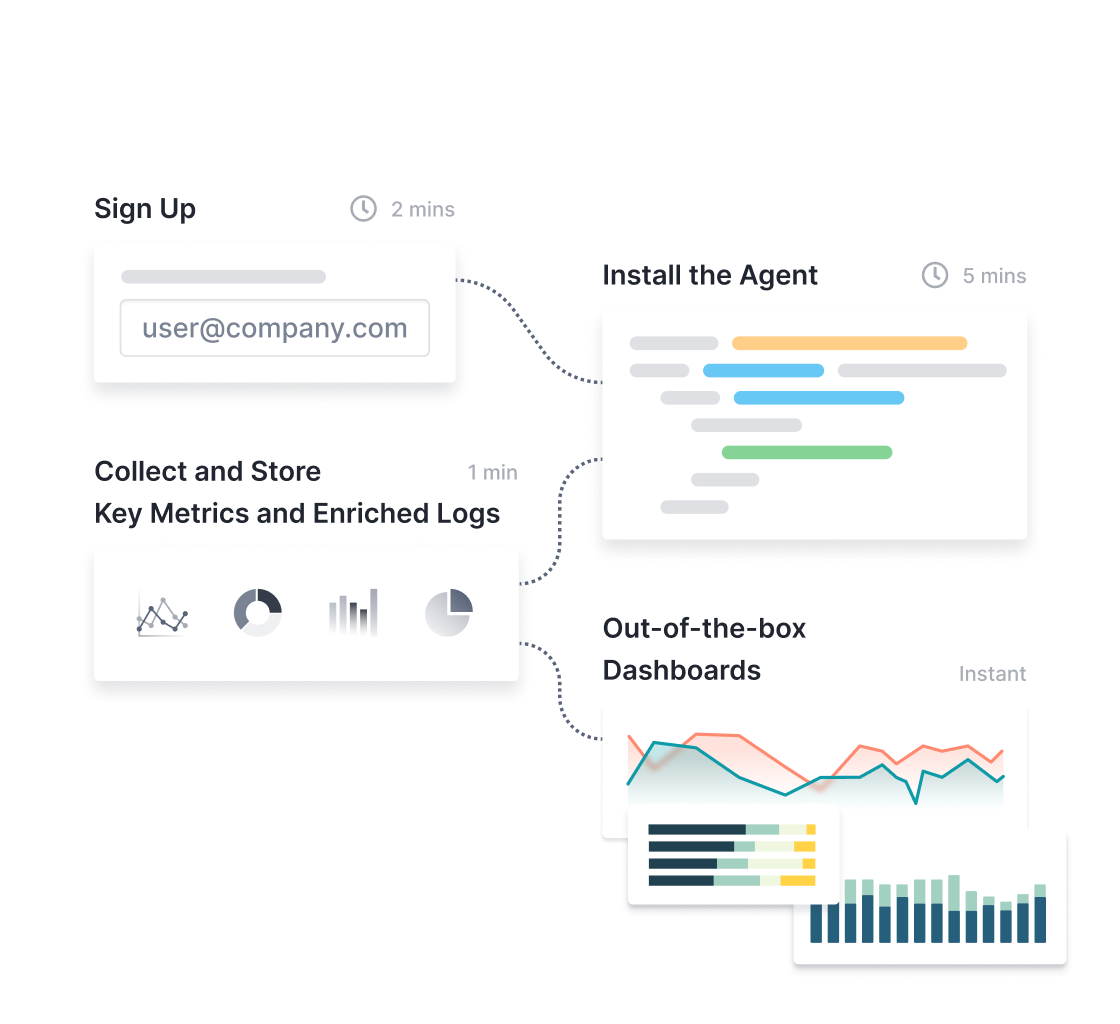
Simple agent installation, zero maintenance.
Monitor your infrastructure and centralize all of your logs with a simple agent installation. Copy, paste, and you're done. Sematext now has your logs, is monitoring your infrastructure, and has set up alerting for you already.
By DevOps, for Devops.
Custom Metrics? APIs? We've got 'em! Open HTTP APIs let you ship Custom Metrics from your apps. Capture and send app, business, and other event data. Sematext also supports Influx Line Protocol, which is popular among monitoring tools. Using this protocol, developers can send metrics in an easy-to-parse and ingest format. To send metrics using the Influx Line Protocol, developers can use tools such as Telegraf.