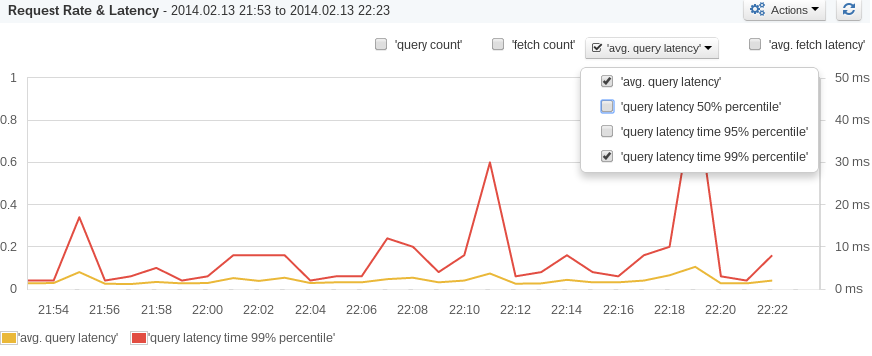
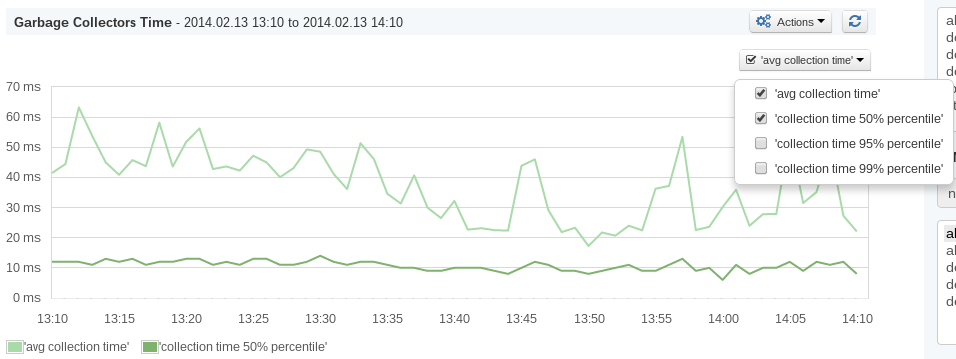
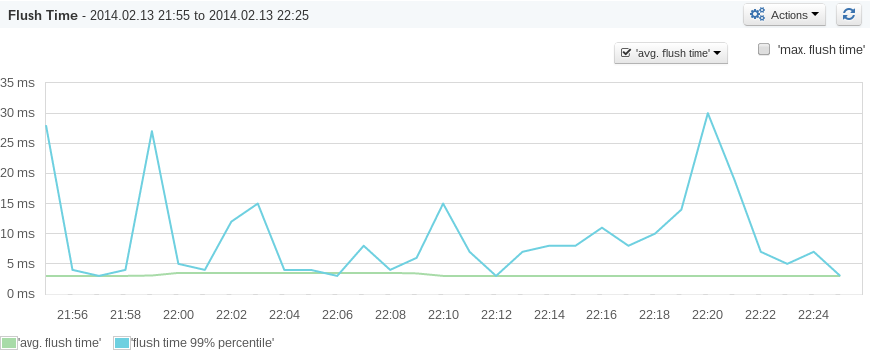
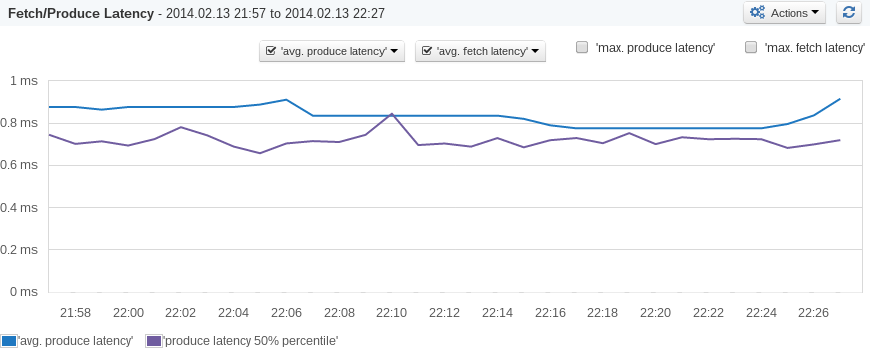
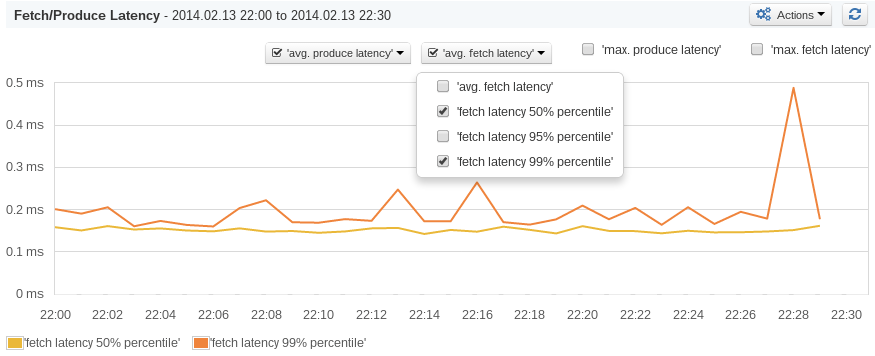
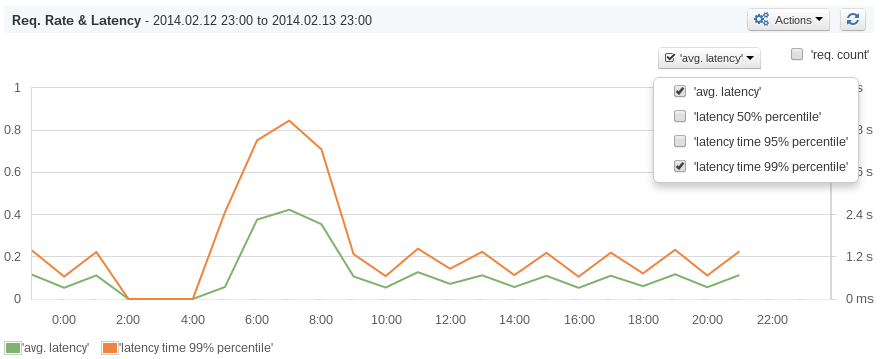
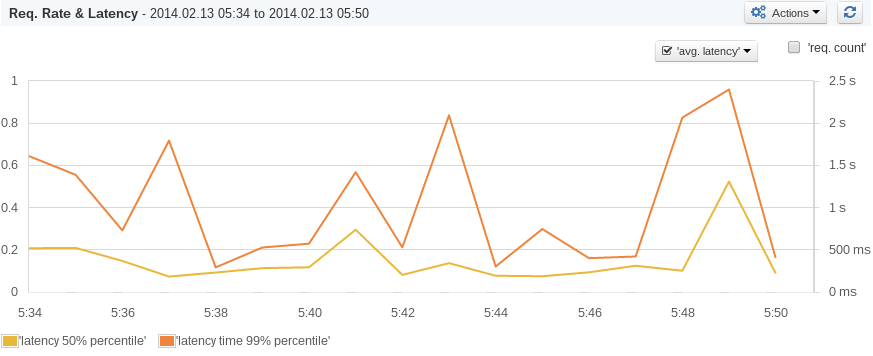
In the spirit of continuous improvement, we are happy to announce that percentiles have recently been added to SPM’s arsenal of measurement tools. Percentiles provide more accurate statistics than averages, and users are able to see 50%, 95% and 99% percentiles for specific metrics and set both regular threshold-based as well as anomaly detection alerts. We will go more into the details about how the percentiles are computed in another post, but for now we want to put the word out and show some of the related graphs — click on them to enlarge them. Enjoy!
Elasticsearch – Request Rate and Latency
Garbage Collectors Time
Kafka – Flush Time
Kafka – Fetch/Produce Latency 1
Kafka – Fetch/Produce Latency 2
Solr Req. Rate and Latency 1
Solr – Req. Rate and Latency 2
If you enjoy performance monitoring, log analytics, or search analytics, working with projects like Elasticsearch, Solr, HBase, Hadoop, Kafka, Storm, we’re hiring planet-wide!
