[Note: This post is part of a series on Transaction Tracing — links to the other posts are at the bottom on this post] As mentioned in the Transaction Tracing for Performance Bottleneck Detection and Transaction Tracing Reports and Traces posts, when you enable Transaction Tracing in SPM you will also automatically get:
- Request Throughput
- Request Latency
- Error & Exception Rates
- AppMap
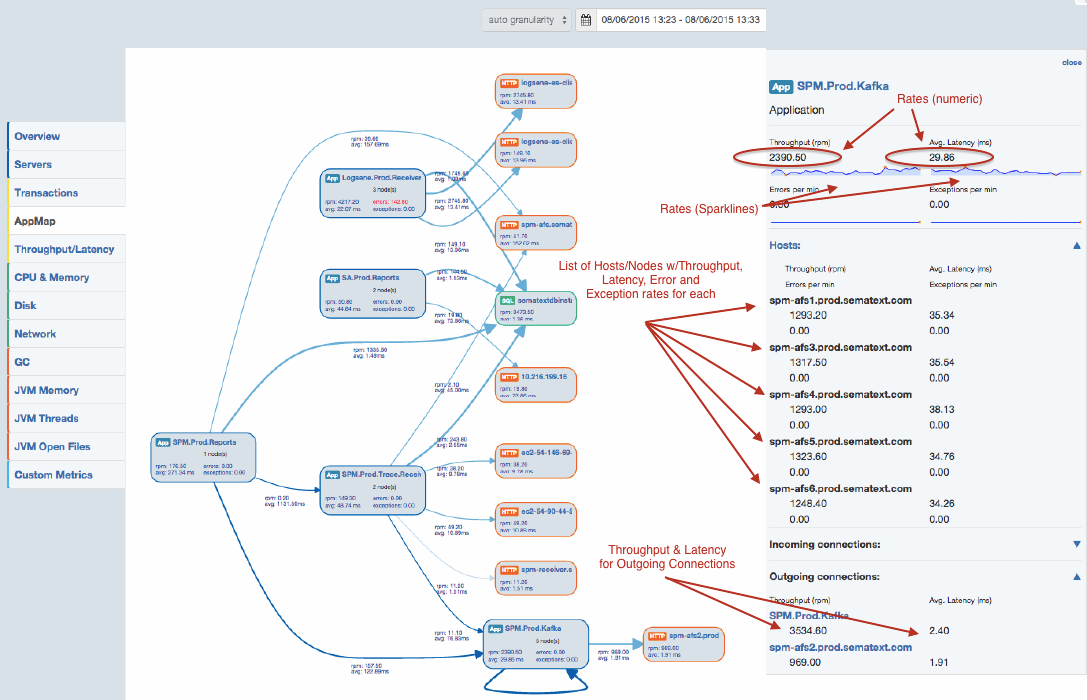
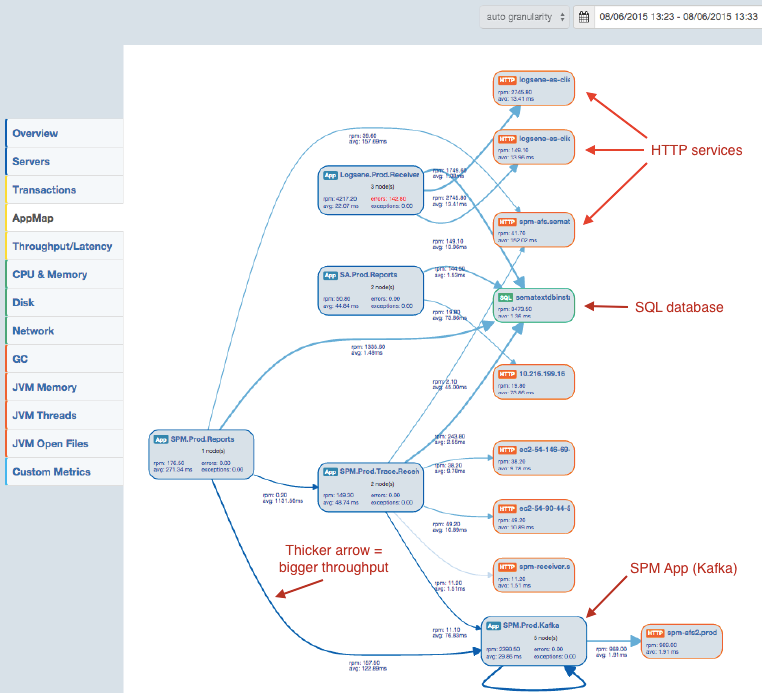
Today we’re happy to officially introduce AppMaps. What’s AppMap? As you can see below, AppMap is a map-like visual representation of your complete application architecture. AppMaps show which components are communicating with which components, at what throughput and latency, at what network speed, whether there are any errors between them, etc. Connections to external services and databases are also captured and visualized. As such, AppMaps help you:
- Instantly see your whole architecture and its operational state and health
- Bring up to speed new team members by showing them the current architecture instead of showing them outdated architecture diagrams;
- Keep the whole team up to date about the latest architecture
- Errors and exceptions are shown in red when they are detected
- Components are color-coded:
- Orange components represent external HTTP services
- Green components are databases (e.g., SQL server has its own shade of green; other databases have their own shades)
- Blue components are other SPM Apps (e.g., Elasticsearch has its own shade, etc., etc.)
- Arrows between components have variable thickness – thicker arrows mean bigger throughput (rpm).
- Greater opacity means smaller latency.
Clicking on any of the components on the AppMap shows more details about that component, such as:
- Overall Throughput, Latency, Error and Exception rates (also shown as sparklines)
- Incoming and Outgoing connections and Throughput and Latency between them
- List of Hosts/Nodes when an SPM App is selected with Throughput, Latency, Error and Exception rates for each of them
 If you’d like to see AppMap for your applications, do the following:
- Add SPM Apps for your applications that talk to your backend services. If you use SPM for monitoring Solr or Elasticsearch or HBase or Cassandra or Kafka or MySQL or …. now add SPM agent to your applications that talk to such backends.
- Grab the latest version of the SPM client (it has some optimizations, too!)
- Run SPM monitor in embedded (aka javaagent) mode, not standalone
- Enable SPM Transaction Tracing in all Java and Scala apps that you want to see on the AppMap
That’s it! Not using SPM yet, but would like to trace your apps? Easy: register here — there is no commitment and you can leave your credit card in your wallet. You get 14 days Free for new SPM Apps so even if you don’t end up falling in love with SPM for monitoring, alerting and anomaly detection, or Logsene for your logs, you can use the Distributed Transaction Tracing to quickly speed up your apps! Oh, and if you are a young startup, a small or non-profit organization, or an educational institution, ask us for a discount (see special pricing)! ——- Here are the other posts in our Transaction Tracing series:
- Part 1: Transaction Tracing for Performance Bottleneck Detection
- Part 2: Transaction Tracing Reports and Traces
- Part 4: Custom Pointcuts (coming soon!)
