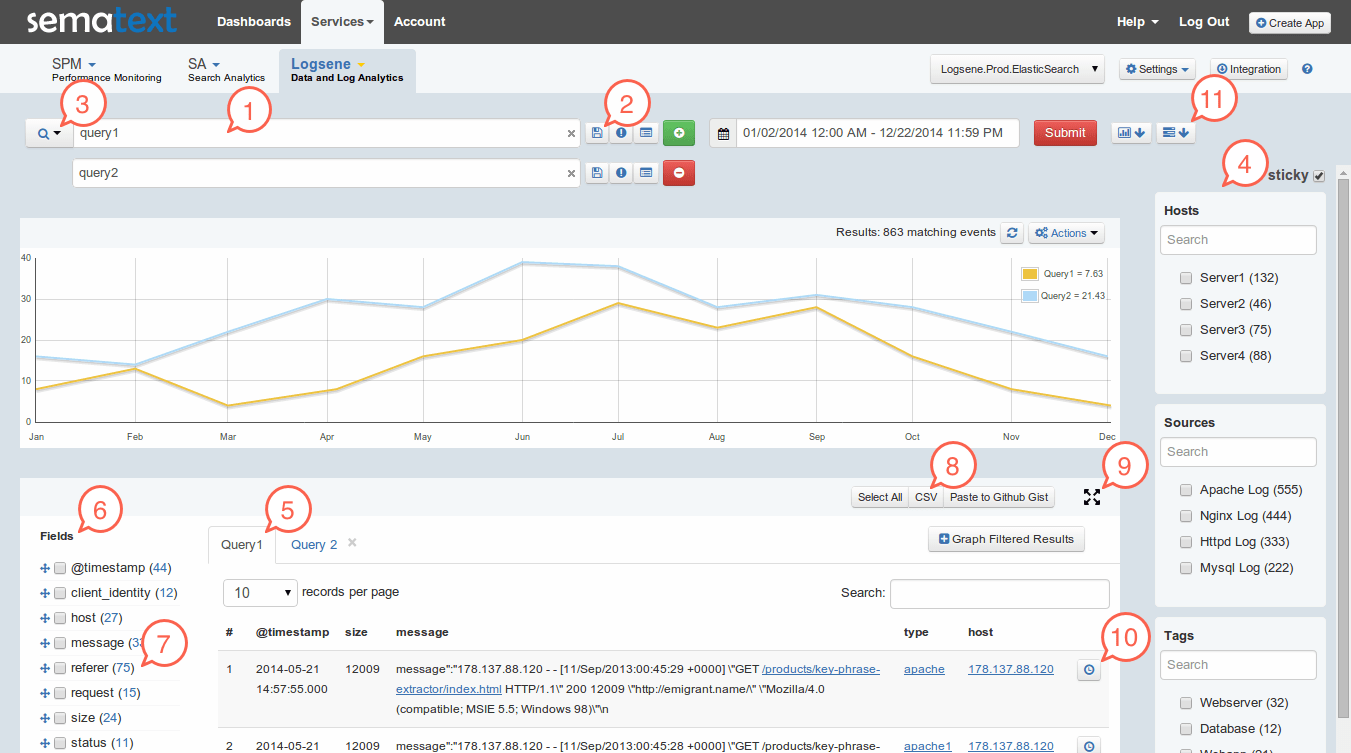
There are exciting changes on the immediate horizon for Sematext’s comprehensive logging solution: Logsene Log Management and Analytics. We just announced the seamless integration of Logsene with SPM Performance Monitoring, Alerting and Anomaly Detection (more on that below) and we have a new release of Logsene just weeks away from production. Here’s a glimpse of the new Logsene UI. Watch for more log analytics and management goodies on our blog soon.
New Logsene UI sneak peek
Of course, the new Logsene will keep the option to use the Kibana UI directly from Logsene.
New Logsene Functionality in Words
- We support multiple queries in a single view; each query’s data get added to the graph (hence 2 lines in this screenshot).
- Queries can be saved, converted to scheduled queries (get email with log graphs every day/week/month type of functionality), or to alert queries (i.e., “email me when we see log messages with XYZ in them”). Those little gray icons next to search fields are for that.
- Clicking on the icon to the left of the top search field will show more functionality.
- Filtering by various log attributes.
- Raw log events in what we internally call Logs Table (or LT). Multiple tabs on top correspond to multiple queries one can enter.
- On the left is a list of available fields that are shown in LT. Checking them adds them to LT. They can be dragged and reordered. Reordering them controls the order of columns in LT.
- Number behind field names shows the number of distinct values for that field.
- Logs can be downloaded as CSV or published to Github Gist or Pastebin services.
- Arrows in top-right of LT expand the LT into a “Kiosk mode.”
- Little icon in each row in LT can be clicked. It expands on click and lets you see context around the given log.
- Clicking on the two gray buttons in top right with down arrows will expose metrics from SPM and Events.
If you currently use Splunk or another log management tool then there is a good chance that you will find Logsene to be an easy and useful way to index, search and analyze your logs.
But Why Use Logsene?
In short: Logsene and SPM provide a single pane of glass for performance monitoring, centralized log management, alerts, anomalies, custom events, and custom KPIs. Unlike competing products, SPM and Logsene together not only tell users that SOMETHING happened, it now tells them exactly WHAT happened. No need for a mish-mash of individual open-source or commercial tools for monitoring, for alerting, for logging, for custom dashboards, etc., each with its own configuration, its own UI, etc.
Not only that, but Logsene offers a unique pricing plan that, unlike those of other log management products, does NOT charge for the amount of data and retention. You only pay for the number of logs in the index – you don’t pay for data transfer or data retention.
We also offer Plan Auto-Upgrade, a unique feature that can automatically switch you to the next higher plan if you exceed your log threshold — preventing you from losing logs which could contain critical information, without forcing you to keep this higher plan.
Moreover, because Logsene usage is “by day”, when auto-upgrade happens the extra cost is really minimal — at any time after the auto-upgrade you can adjust retention and/or plan and go back to the old plan
Check out a Live Demo
See SPM and Logsene (note: old UI and Kibana UI, the new UI will be in the next release) for yourself by viewing a live demo. You’ll also be able to poke around and see Storm, Kafka, Solr, Elasticsearch, Hadoop, HBase, MySQL, and other types of apps being monitored.
Try Logsene and/or SPM Performance Monitoring for Free for 14 days by registering here. There’s no commitment and no credit card required.
We’re Hiring!
If you enjoy performance monitoring, log analytics, or search analytics, working with projects like Elasticsearch, Solr, HBase, Hadoop, Kafka, and Storm, then drop us a line. We’re hiring planet-wide! Front end and JavaScript Developers, Developer Evangelists, Full-stack Engineers, Mobile App Developers…get in touch!
