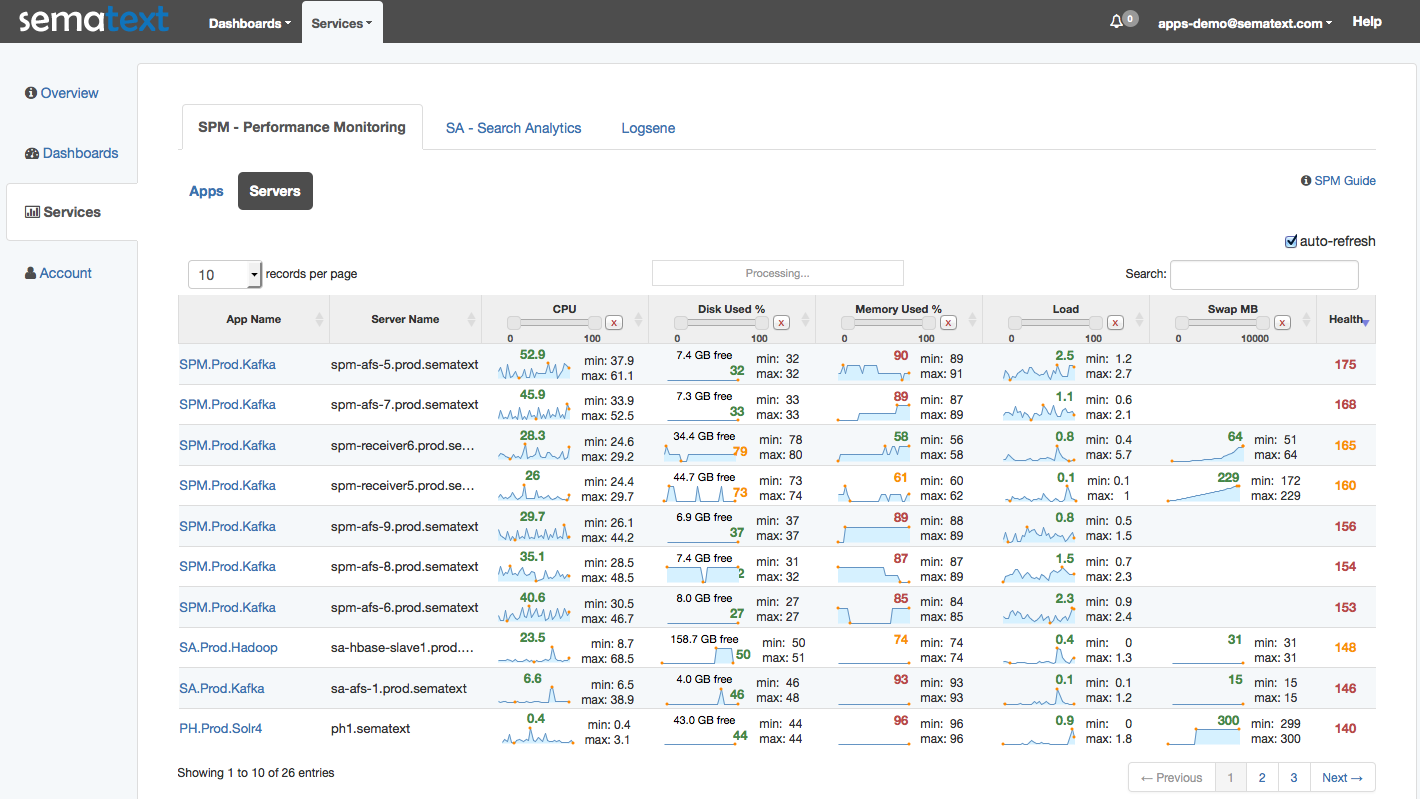
Everyone’s infrastructure is growing – whether you run baremetal servers, use IaaS, or use Containers. This just-added SPM functionality, a new view in SPM that we call BEV (aka Birds Eye View) helps you get better visibility into all your servers requiring attention — especially the hot ones!
Up until now SPM provided you with very detailed insight into all kinds of metrics for whichever SPM App you were looking at. SPM, of course, lets you monitor a bunch of things! Thus you, like lots of other SPM users, might be monitoring several (types of) applications (e.g. real-time data processing pipelines). This means you also need to be able to see how servers running those apps are doing health-wise. Do any of them have maxed out CPUs? Any of them close to running out of disk? Any of them swapping like crazy? Wouldn’t it be nice to see various metrics for lots or even all your servers at a glance? BEV to the rescue!
With BEV you can get an instant, real-time, and consolidated look at your key server and application-specific metrics, including: CPU utilization, Disk used %, Memory used %, Load, and Swap. From these metrics SPM computes the general health of the server, which it uses to surface the most problematic servers and, by using red, orange, and green coloring, bring the most critical servers to your attention.
Cross-app Server Visibility
BEV is especially valuable because it gives you the overall view of all your servers, across all your SPM Apps – yet with the ability to filter by app and hostname patterns. BEV is like top + df for all your servers and clusters. In fact, BEV was designed to give users at-a-glance capabilities in a few different ways:
Sparklines: Whereas the typical application performance monitoring (APM) chart is designed to show as much data as possible, sparklines are intended to be succinct and give users an instant idea if whether a specific application is encountering a problem.
Colored Metric Numbers: Getting an instant sense of server health is as easy as driving up to a traffic light. Green — sweet, looks good. Orange — hmmm, should watch that. Red — whoa, better check that out asap!
While BEV already surfaces the hottest servers, you can also set min/max ranges for any of the metrics and thus easily hide servers that you know are healthy and that you don’t want to even see in BEV. Just use the sliders marked in the screenshot below.
Hope you like this new addition to SPM. Got ideas how we could make it more useful for you? Let us know via comments, email, or @sematext.
Not using SPM yet? Check out the free 30-day SPM trial by registering here (ping us if you’re a startup, a non-profit, or education institution – we’ve got special pricing for you!). There’s no commitment and no credit card required. SPM monitors a ton of applications, like Elasticsearch, Solr, Hadoop, Spark, Node.js & io.js (open-source), Docker (get open-source Docker image) Kafka, Cassandra, and more.

