It’s 2 AM, and your phone buzzes with an urgent alert—your primary server application is down, and users are flooding the support channels with complaints.
As you dive into the logs, the cause is elusive, buried somewhere in the sea of system events.
Is it a rogue service eating up memory?
A failing disk?
Or a network bottleneck?
Without powerful Windows monitoring tools, you’re left troubleshooting in the dark.
The Challenges of Windows Monitoring
Windows servers and services are fundamental to the operations of many businesses.
Monitoring Windows servers and services involves tracking performance metrics, detecting issues, and ensuring that all components run smoothly. Without effective Windows monitoring tools, organizations can face significant problems, such as:
- Downtime: Unplanned outages of servers or critical services can lead to significant business disruptions and financial losses.
- Performance Degradation: Slow server or service performance can affect user satisfaction and productivity.
- Security Risks: Unmonitored servers and services are vulnerable to security breaches, which can compromise sensitive data.
- Complex Troubleshooting: Identifying and resolving server and service issues without proper tools can be time-consuming and inefficient.
In this post, we’ll delve into the best Windows monitoring tools. They give you the visibility and control to catch these issues before they escalate, ensuring your infrastructure is resilient and your nights are uninterrupted.
Top 10 Server Monitoring Tools and Software in 2024
Here are some of the best tools available on the market right now:
1. Sematext
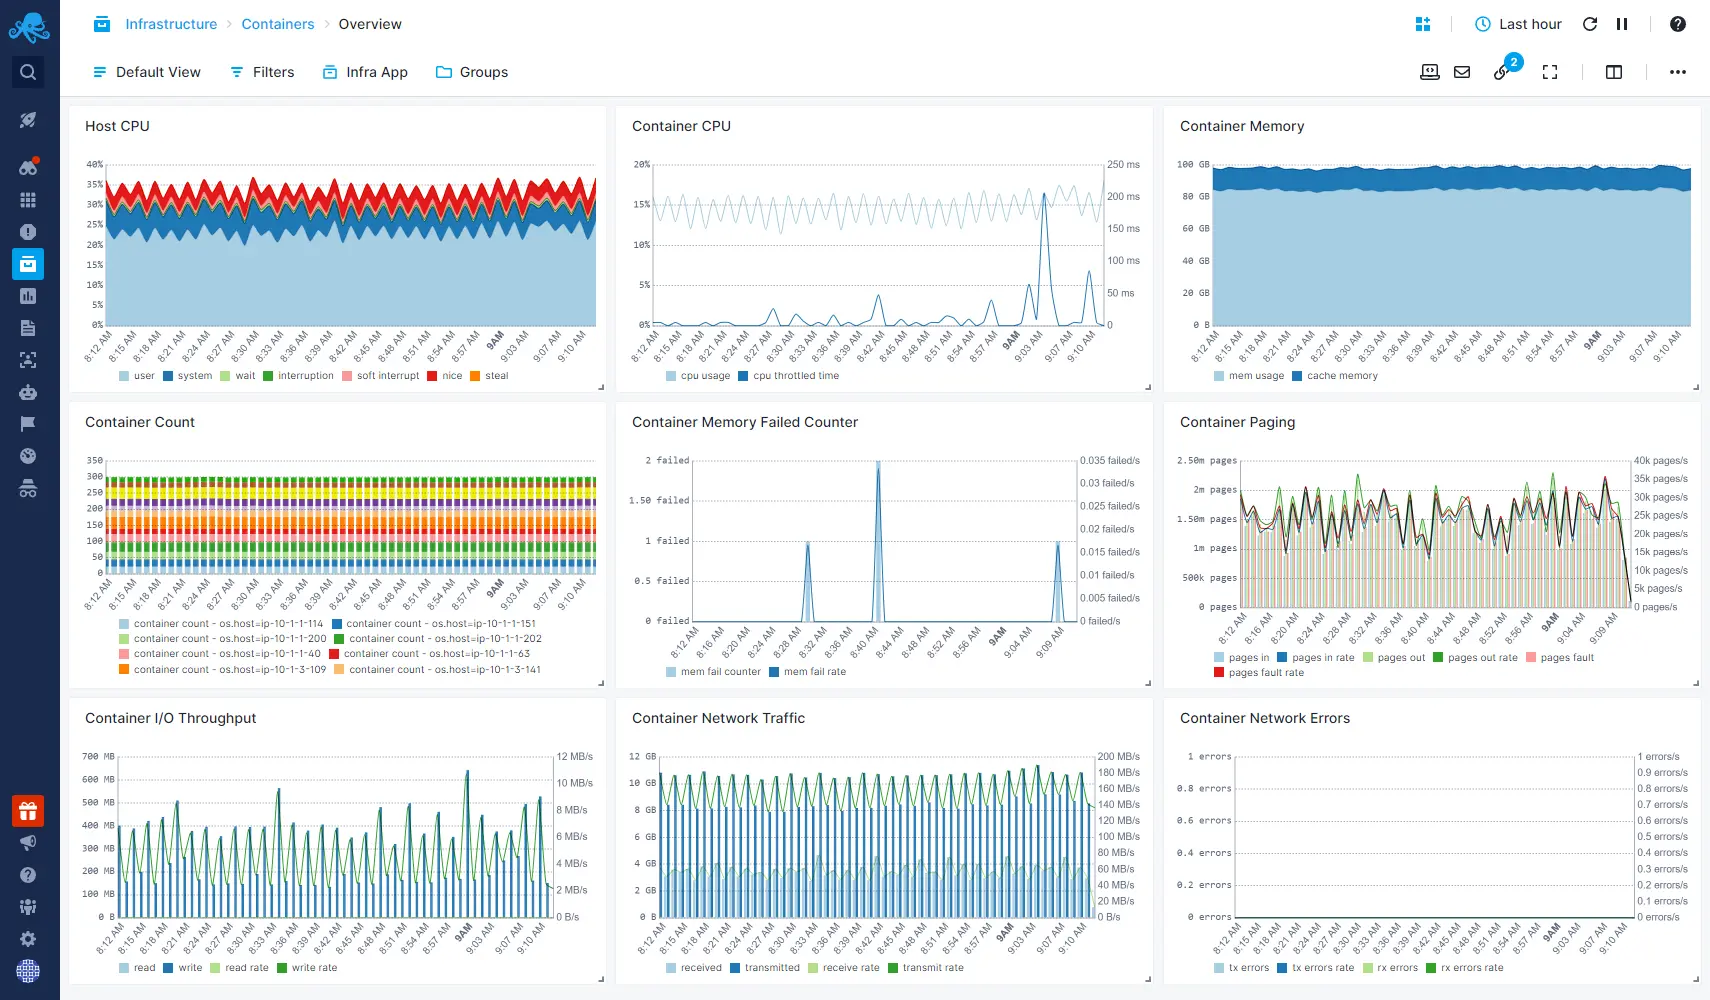
Sematext Infrastructure Monitoring offers a robust solution for Windows monitoring, ensuring high availability and peak performance of servers and applications running on Windows platforms. Intuitive dashboards allow users swift troubleshooting and visualization of metrics including CPU, memory, disk usage, network statistics, and more.
Setting up Sematext is easy thanks to the auto-discovery feature, which quickly identifies applications and sets up pre-configured checks and alerts.
Sematext enhances server infrastructure management by offering a single-pane-of-glass view, enabling easy identification of underutilized resources to cut costs, optimization of server performance, and detection of failing servers with heartbeat alerts.
It also provides comprehensive cloud-aware monitoring that is agnostic to the cloud provider, supporting major container and Kubernetes solutions, and automatically collecting essential metrics and cloud-specific tags.
It’s designed to be lightweight yet comprehensive, ensuring minimal system overhead while providing deep insights into the infrastructure’s health and performance.
Features:
- Current & historical resource utilization view
- CPU, memory, disk usage, network metrics
- Flexible filtering with tags, hosts, etc.
- Aggregate top-like infrastructure view
- Monitoring alerts on any metric
- Visualizations for capacity planning
- Easy installation and deployment options
- Lightweight agent with minimal resource usage
- Identify underutilized resources
- Detect failing servers with heartbeat alerts
Pros:
- Fast integration via open-source Agent
- Monitor logs and events and correlate them for deeper insights into infrastructure health
- Inventory tracking alerts to inconsistencies, discrepancies, or outdated packages
- Detailed process monitoring to identify and resolve performance bottlenecks
- Easy installation and excellent support
- Out-of-the-box dashboards and alert rules save time
- Flexible subscription pricing and pay-as-you-go options
- Provides both internal and external monitoring capabilities
- Integrates with incident management systems for seamless response
- Detailed browser checks for anomaly detection
- Provides full stack observability
Cons:
- Limited capabilities for transaction tracing.
- Fewer integrations than some larger competitors
- Lacks a comprehensive profiling feature.
Pricing:
Sematext offers a free plan with basic features, moderate data retention, and alert capabilities, all without requiring a credit card.
Paid plan starts at only $3.60 per host per month with various retention options. The highest tier plan starts at $5.76 and provides the most comprehensive feature set, and retention plans.
Sematext provides a 14-day free trial allowing you to evaluate the full capabilities of the product for a limited period.
Annual commitments also offer additional discounts, making it an even more attractive option for long-term monitoring solutions.
Ideal for:
Organizations of all sizes looking for a cost-effective and user-friendly monitoring and troubleshooting solution. Very large enterprises might require more specialized features.
Want to see more? You can check out our full range of packages by visiting the pricing page.
2. SolarWinds Server and Application Monitor (SAM)
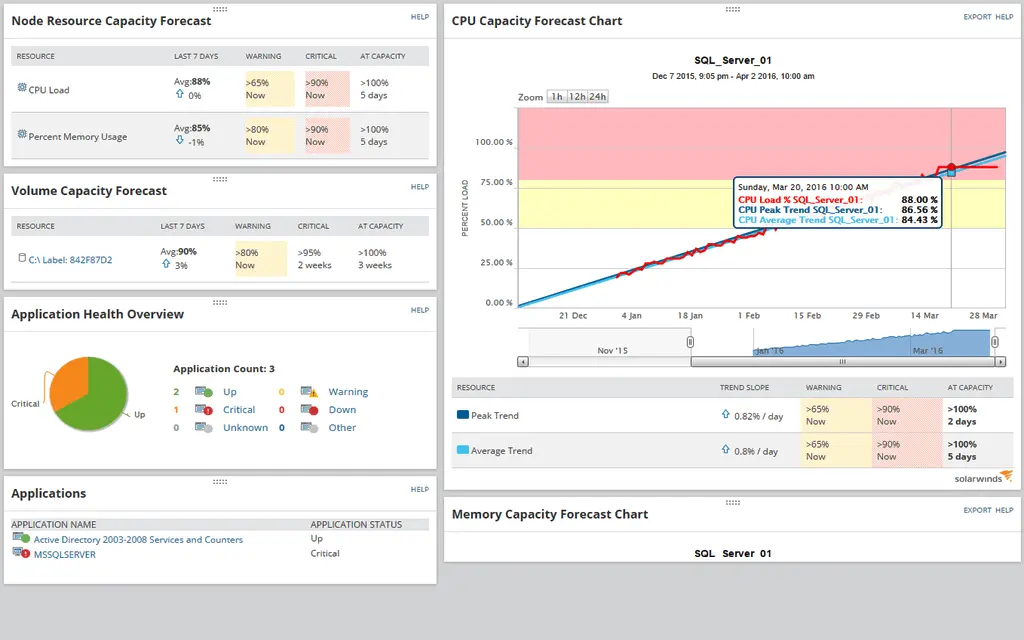
SolarWinds Server and Application Monitor (SAM) helps keep Windows servers running smoothly by tracking important details like CPU, memory, and disk usage. It watches over 1,200 applications, including Windows Server, Active Directory, and SQL Server. You can even create custom templates to monitor specific apps.
SAM alerts allow you to fix issues quickly and provide charts to help you see when resources like memory or CPU are running low.
It automatically finds applications and maps out their dependencies.
The tool can monitor virtual environments like VMware and Hyper-V, giving you a clear view of your virtual machines’ performance. It also supports cloud services like AWS and Azure, so you can see how your cloud resources are being used.
Features:
- Application Availability and Performance Monitoring
- Application Dependency Mapping
- Cloud Application Monitoring
- Cross-Stack IT Data Correlation
- Customizable Reports and Alerts
- Real-time Monitoring
- Pre-configured Templates
- Agentless Monitoring
- Optional Agent Deployment
- Auto-Discovery
- Customizable Interface
Pros:
- Extensive feature set
- Customizable
- Strong Visualization Tools
- Integration with SolarWinds Orion Platform
- Application Performance Insights
- Cross-Platform Monitoring
- Suitable for small to large IT environments.
Cons:
- High cost
- Complexity
Pricing:
They don’t publicly disclose specific pricing details which usually tells that your Windows server monitoring could be a quite substantial “investment”.
Here’s what we were able to find…
SolarWinds SAM starts at ~$2,955 per year for 150 max number of elements and 1-year support, reflecting its extensive capabilities and enterprise-level features.
For specific pricing details, it’s recommended to contact SolarWinds directly or request a quote through their website.
Ideal for:
Large enterprises in need of detailed application and server monitoring to ensure optimal performance and quick resolution of issues.
3. Datadog
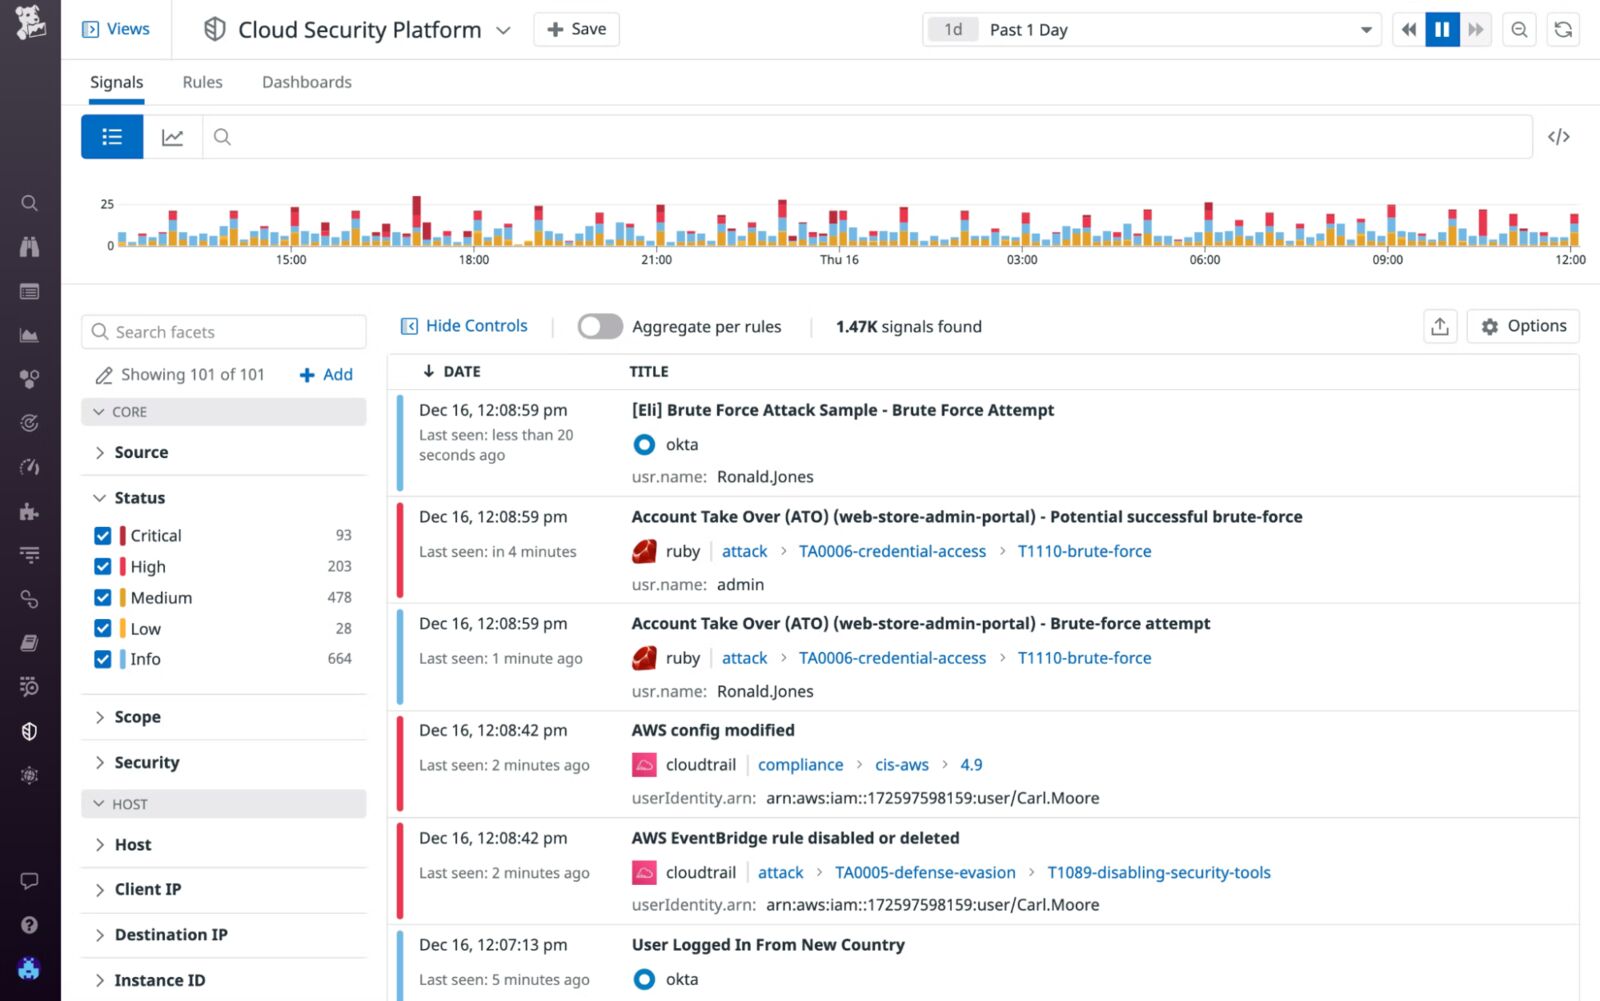
Datadog is a massive, full-stack monitoring solution renowned for its strong cloud integrations and comprehensive monitoring capabilities. Its market value is approximated to an astonishing $40B, making it by far the most comprehensive performance monitoring tool… with massive cost associated. It provides detailed insights across servers, infrastructure, applications, and logs, making it a preferred choice for enterprises with significant cloud infrastructure.
The platform provides real-time monitoring of Windows servers, containers, and applications, allowing users to visualize performance metrics instantly. Key metrics such as CPU usage, memory utilization, disk activity, and network performance are tracked using Windows Performance Counters.
In short, Datadog provides pretty much everything you can need for your monitoring needs, but at an enterprise-level price, without overage protection.
Features:
- Infrastructure monitoring
- Application performance monitoring (APM)
- Real user monitoring (RUM)
- Log management
- Security monitoring
- Cloud monitoring
- Container monitoring
- Customizable dashboards & alerts
- Integrations with various tools
Pros:
- Easy to use and deploy
- Unified view of IT infrastructure
- Powerful visualizations
- Scalable
- Helpful customer support
Cons:
- Very expensive
- No overage protection!
- Users report poor customer service
- Users report a steep learning curve
Pricing:
Infrastructure monitoring starts at $18 per month per host, providing you with 750+ integrations, out-of-the-box dashboards, and 15-month metric retention. Enterprise plan, on the other hand, starts at $27/mo without annual commitment and provides everything available in pro, with additional features like Machine learning-based alerts and Live Processes.
For a detailed comparison, visit our page on Sematext vs Datadog. We’ve broken down their pricing and compared it to Sematext, providing a clear visual of the potential savings you could achieve.
Ideal for:
Enterprises with significant cloud infrastructure require a detailed and integrated monitoring solution. Its comprehensive capabilities and strong cloud integrations make it a valuable tool for maintaining system health and performance.
4. PRTG Monitor
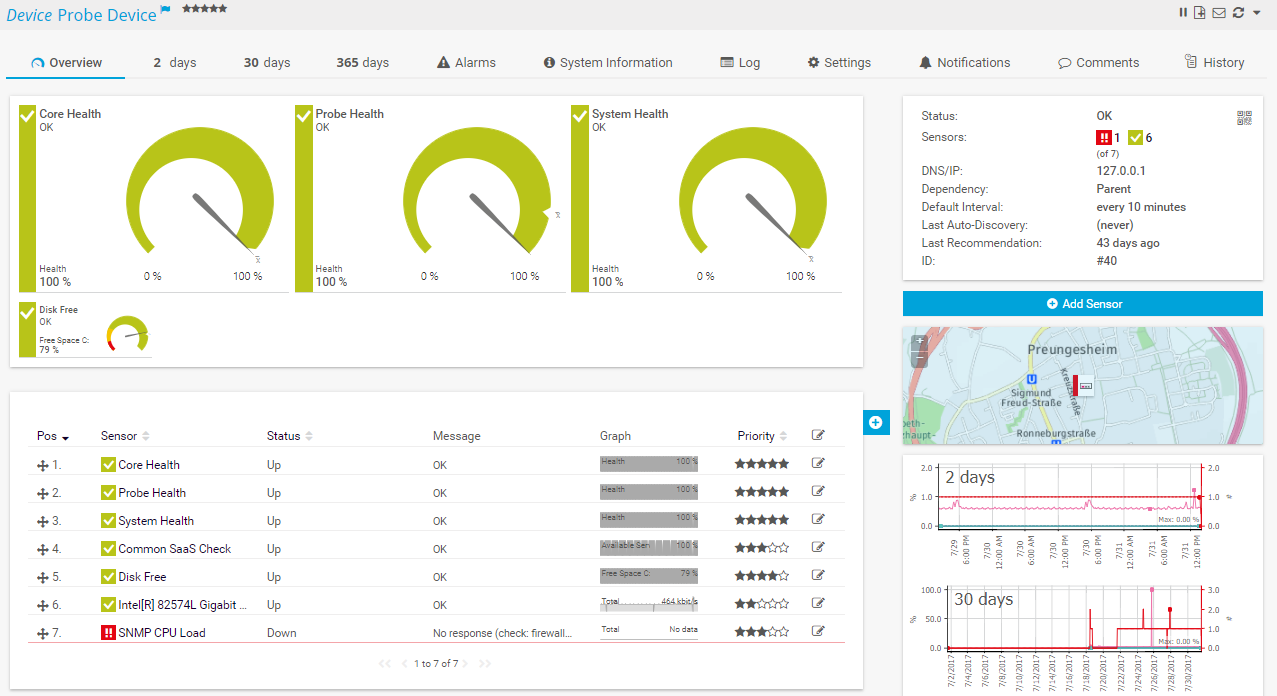
PRTG Network Monitor is a versatile and powerful monitoring tool designed by Paessler to manage and monitor both servers and network devices. Its extensive range of features and user-friendly interface make it a popular choice for organizations seeking a flexible and detailed monitoring solution.
PRTG Network Monitor offers a comprehensive solution for monitoring Windows environments, providing real-time insights and ensuring the reliability of your IT infrastructure. It includes predefined sensors for monitoring key metrics such as CPU usage, memory load, disk health, and network performance. PRTG can monitor both physical and virtual servers, including Hyper-V and VMware, as well as applications like Microsoft Exchange, SQL Server, and IIS.
One of the standout features is its automatic network discovery. This makes the initial setup process straightforward and efficient.
Features:
- Network device monitoring (servers, routers, switches, etc.)
- Application monitoring (HTTP, ping, etc.)
- Traffic monitoring (bandwidth usage)
- Uptime monitoring
- Sensor-based monitoring (customizable data collection)
- Real-time alerts and reports
- Auto-discovery of devices
- Mobile app for remote monitoring
- Free tier available (limited sensors)
Pros:
- User-friendly interface
- Agentless monitoring for some devices
- Scalable with tiered pricing
- Customizable dashboards and alerts
- Excellent customer support
- Free tier for basic needs
- On-premise & cloud hosting
Cons:
- Can become expensive
- Steep learning curve
- Can be complex for very large network environments
- Fewer integrations compared to some competitors
Pricing:
PRTG Network Monitor is priced at €1,649 per license for the on-prem version giving you 1 server installation, up to 10,000 monitoring aspects, and only email support. PRTG Hosted Monitor, on the other hand, is cloud-based and starts at €1,349 per year for the same features.
For more installations, better support, and a richer feature set, you’ll need to consider PRTG Enterprise Monitor which starts at ~ €16,000 per year.
Ideal for:
Organizations looking for a flexible and detailed monitoring solution that can be customized to meet their specific needs. Its versatility and comprehensive feature set make it suitable for businesses of all sizes, particularly those with diverse and complex monitoring requirements.
5. Nagios XI
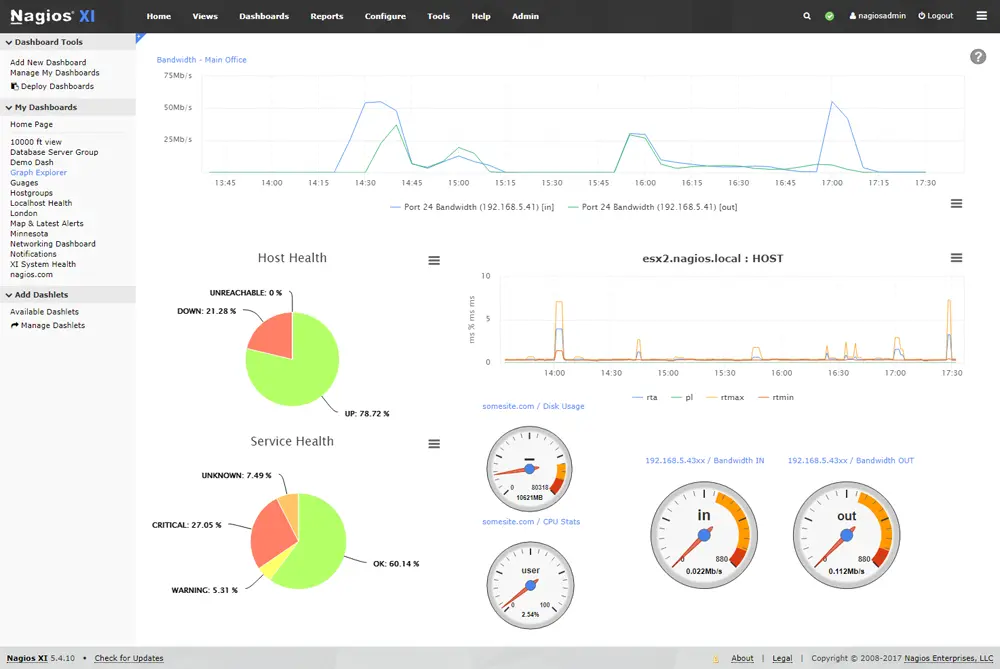
Nagios XI is a comprehensive IT infrastructure monitoring tool designed to provide real-time insights into the performance and health of your entire IT environment. Nagios XI excels at monitoring a wide range of IT infrastructure, including Windows environments.
It offers both agent-based and WMI (Windows Management Instrumentation) monitoring for comprehensive coverage of Windows servers. This allows you to track critical metrics, services, and applications running on your Windows machines.
Features:
- Monitors IT infrastructure (networks, servers, apps, services)
- Comprehensive Windows server monitoring (agent-based, WMI)
- Tracks Windows metrics, services, applications
- Real-time monitoring and alerts
- Customizable dashboards, reports
- Supports plugins for extended functionality
Pros:
- Extensive features, strong Windows server monitoring
- Scalable for large, complex environments
- Open-source option (Nagios Core)
- Highly customizable dashboards, alerts, plugins
Cons:
- Complex setup and management (beginner difficulty)
- Paid version has licensing costs
- Limited user interface compared to some competitors
Pricing:
You can start using Nagios XI for free if 7 nodes and 100 services (whichever reached first) without any support is enough for your organization. If not, Nagios XI paid plans start at $2,495, which reflects its extensive capabilities and enterprise-level features.
Ideal for:
Nagios XI is ideal for enterprises requiring extensive and customizable infrastructure monitoring. Its robust feature set and scalability make it well-suited for large organizations with complex IT environments, including those needing Windows server monitoring tools and Windows service monitoring tools open source.
6. AppDynamics
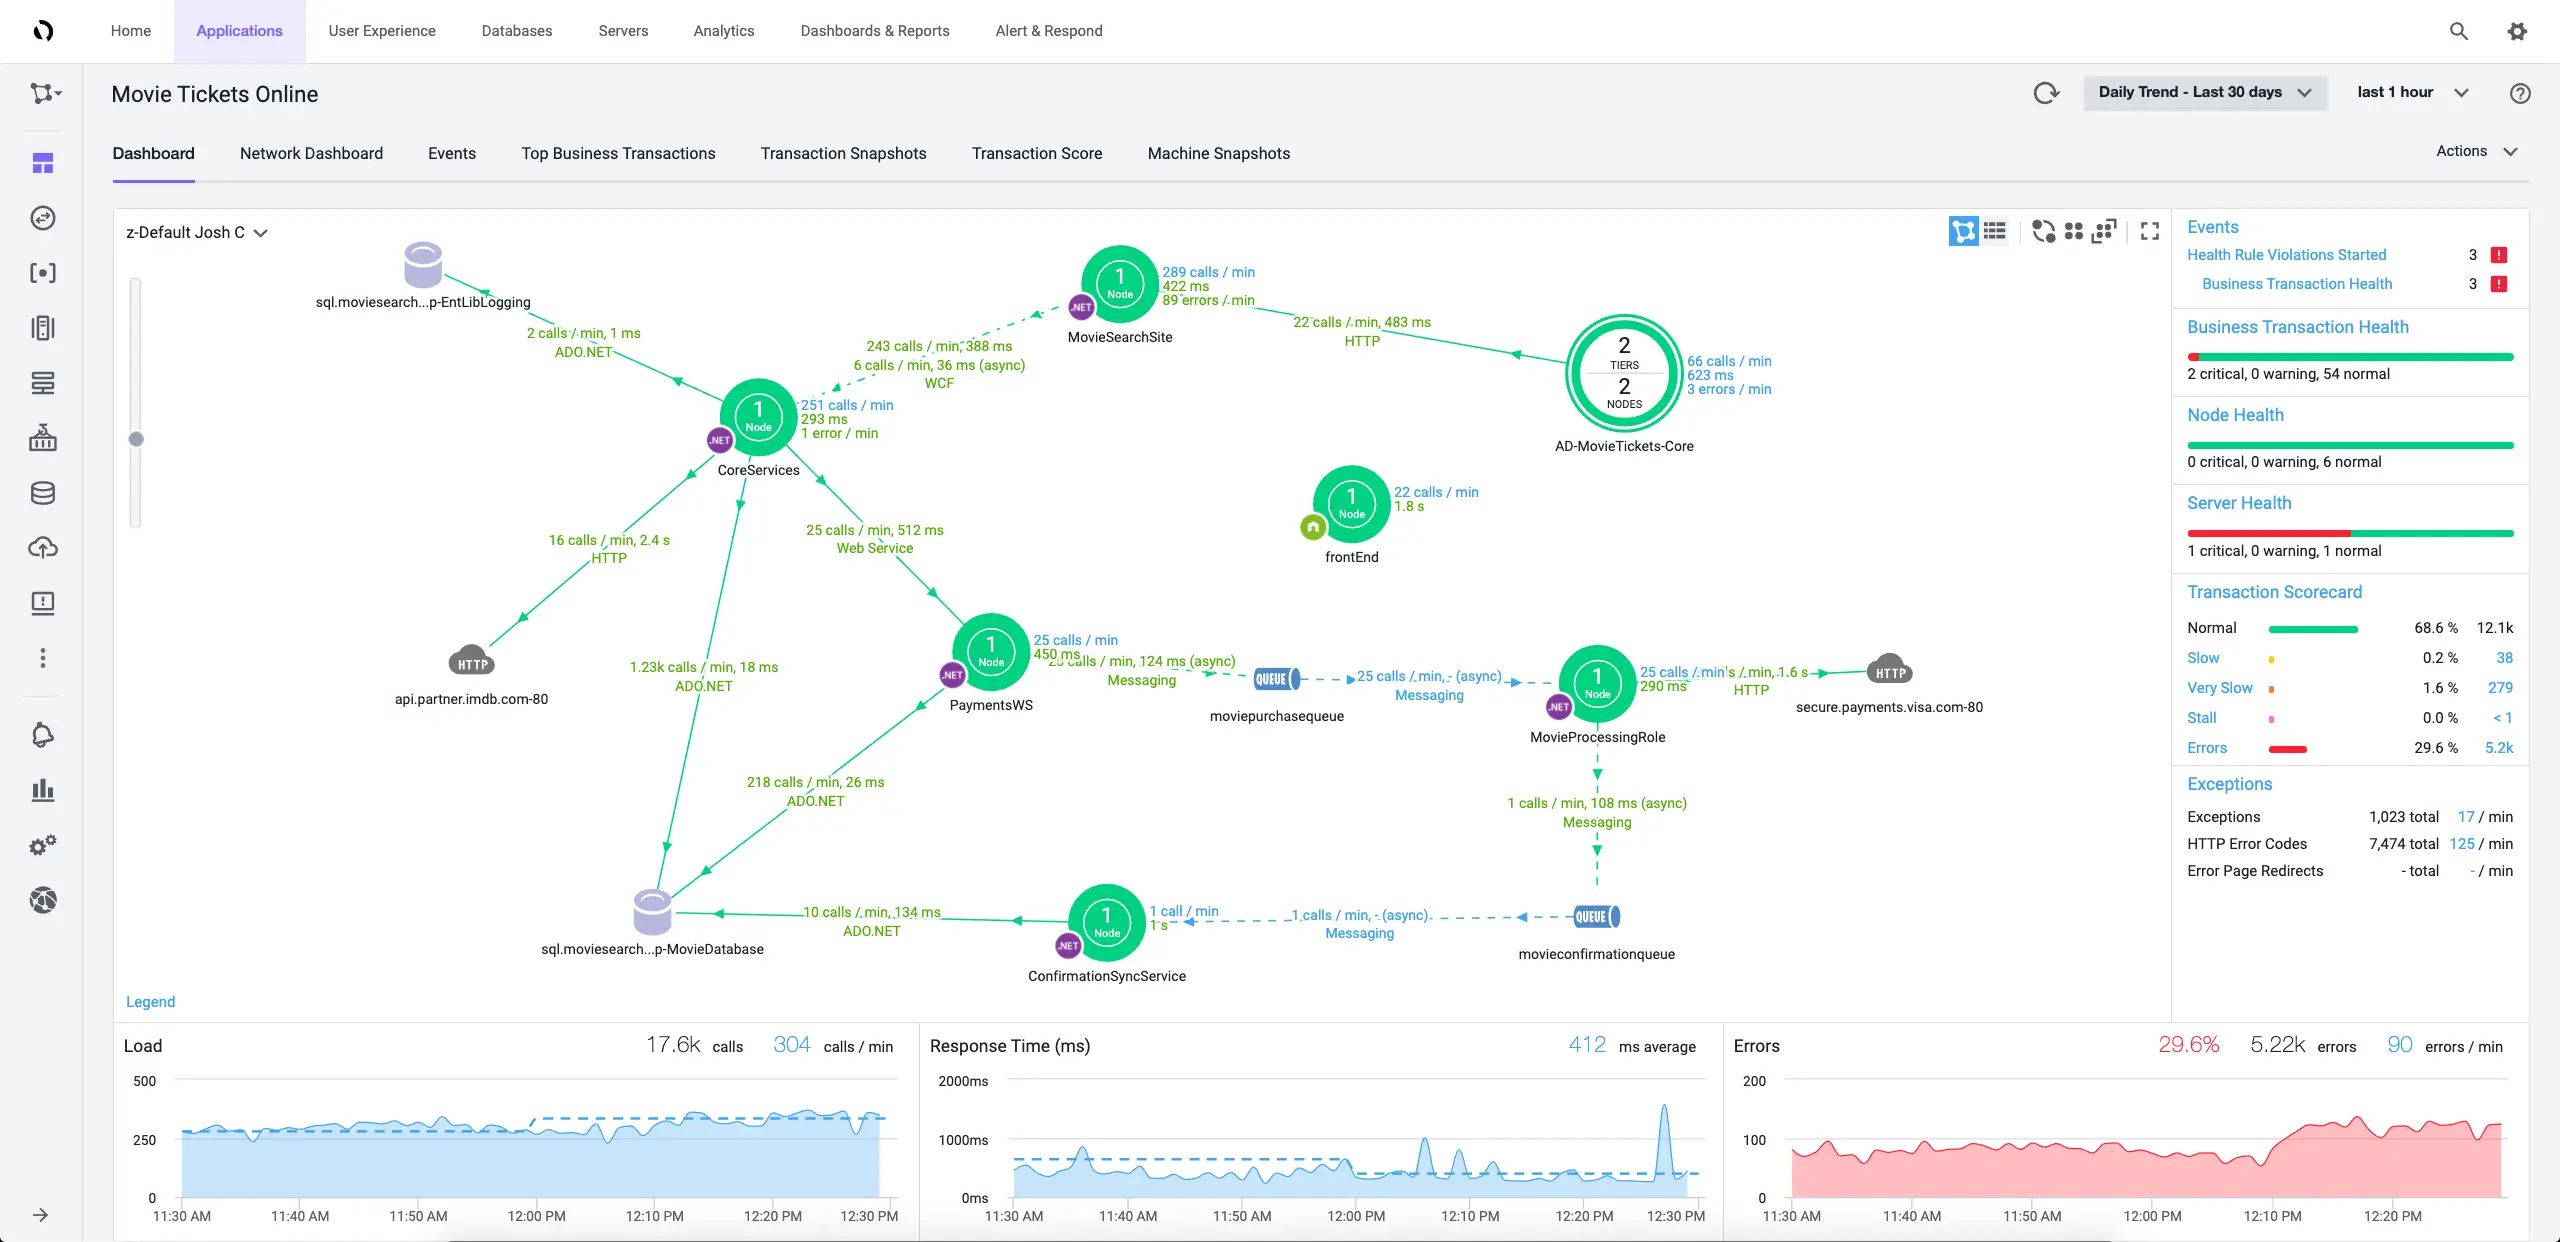
AppDynamics is an enterprise-grade monitoring solution designed to provide comprehensive insights into applications and infrastructure. It excels in application performance monitoring (APM), making it a top choice for enterprises focused on optimizing application performance and enhancing user experience.
It supports end-to-end transaction tracing, infrastructure resource monitoring, and service health checks. The platform integrates seamlessly with Microsoft Azure, providing extensive support for cloud services.
Features:
- Deep application performance monitoring (APM)
- End-to-end transaction tracing
- Infrastructure monitoring (CPU, memory, disk I/O, network traffic)
- Windows service health monitoring and alerts
- Integration with Microsoft Azure services
- Customizable dashboards and alerts
- Code-level visibility for .NET applications
- Alerts and notifications
- Customizable dashboards and reports
- Business performance monitoring
- Log Analytics
Pros:
- Powerful APM capabilities
- Real-user experience monitoring
- End-to-end visibility
- Scalability
- Easy new application deployment
- Code-level visibility option for deep performance analysis
- Intuitive workflow monitoring within application tracking
- Predictive intelligence provides valuable insights into tool usability
- High transaction visibility for detailed performance analysis
Cons:
- Costly (for smaller businesses)
- User reviews complain of various difficulties across the entire platform
- Challenges with integrating with different event sources
- User Review complains of 3rd-party tools required to start/stop instances being monitored
- Limited free options
Pricing:
AppDynamics is priced at $6 per CPU core per month. This cost can add up quickly, especially for organizations with extensive infrastructure, but it provides significant value in terms of performance optimization and user experience enhancement.
Ideal for:
AppDynamics is ideal for enterprises that prioritize application performance and user experience. Its robust APM features and real-time insights make it an invaluable tool for maintaining high-performance standards and quickly addressing issues as they arise.
7. CheckMK
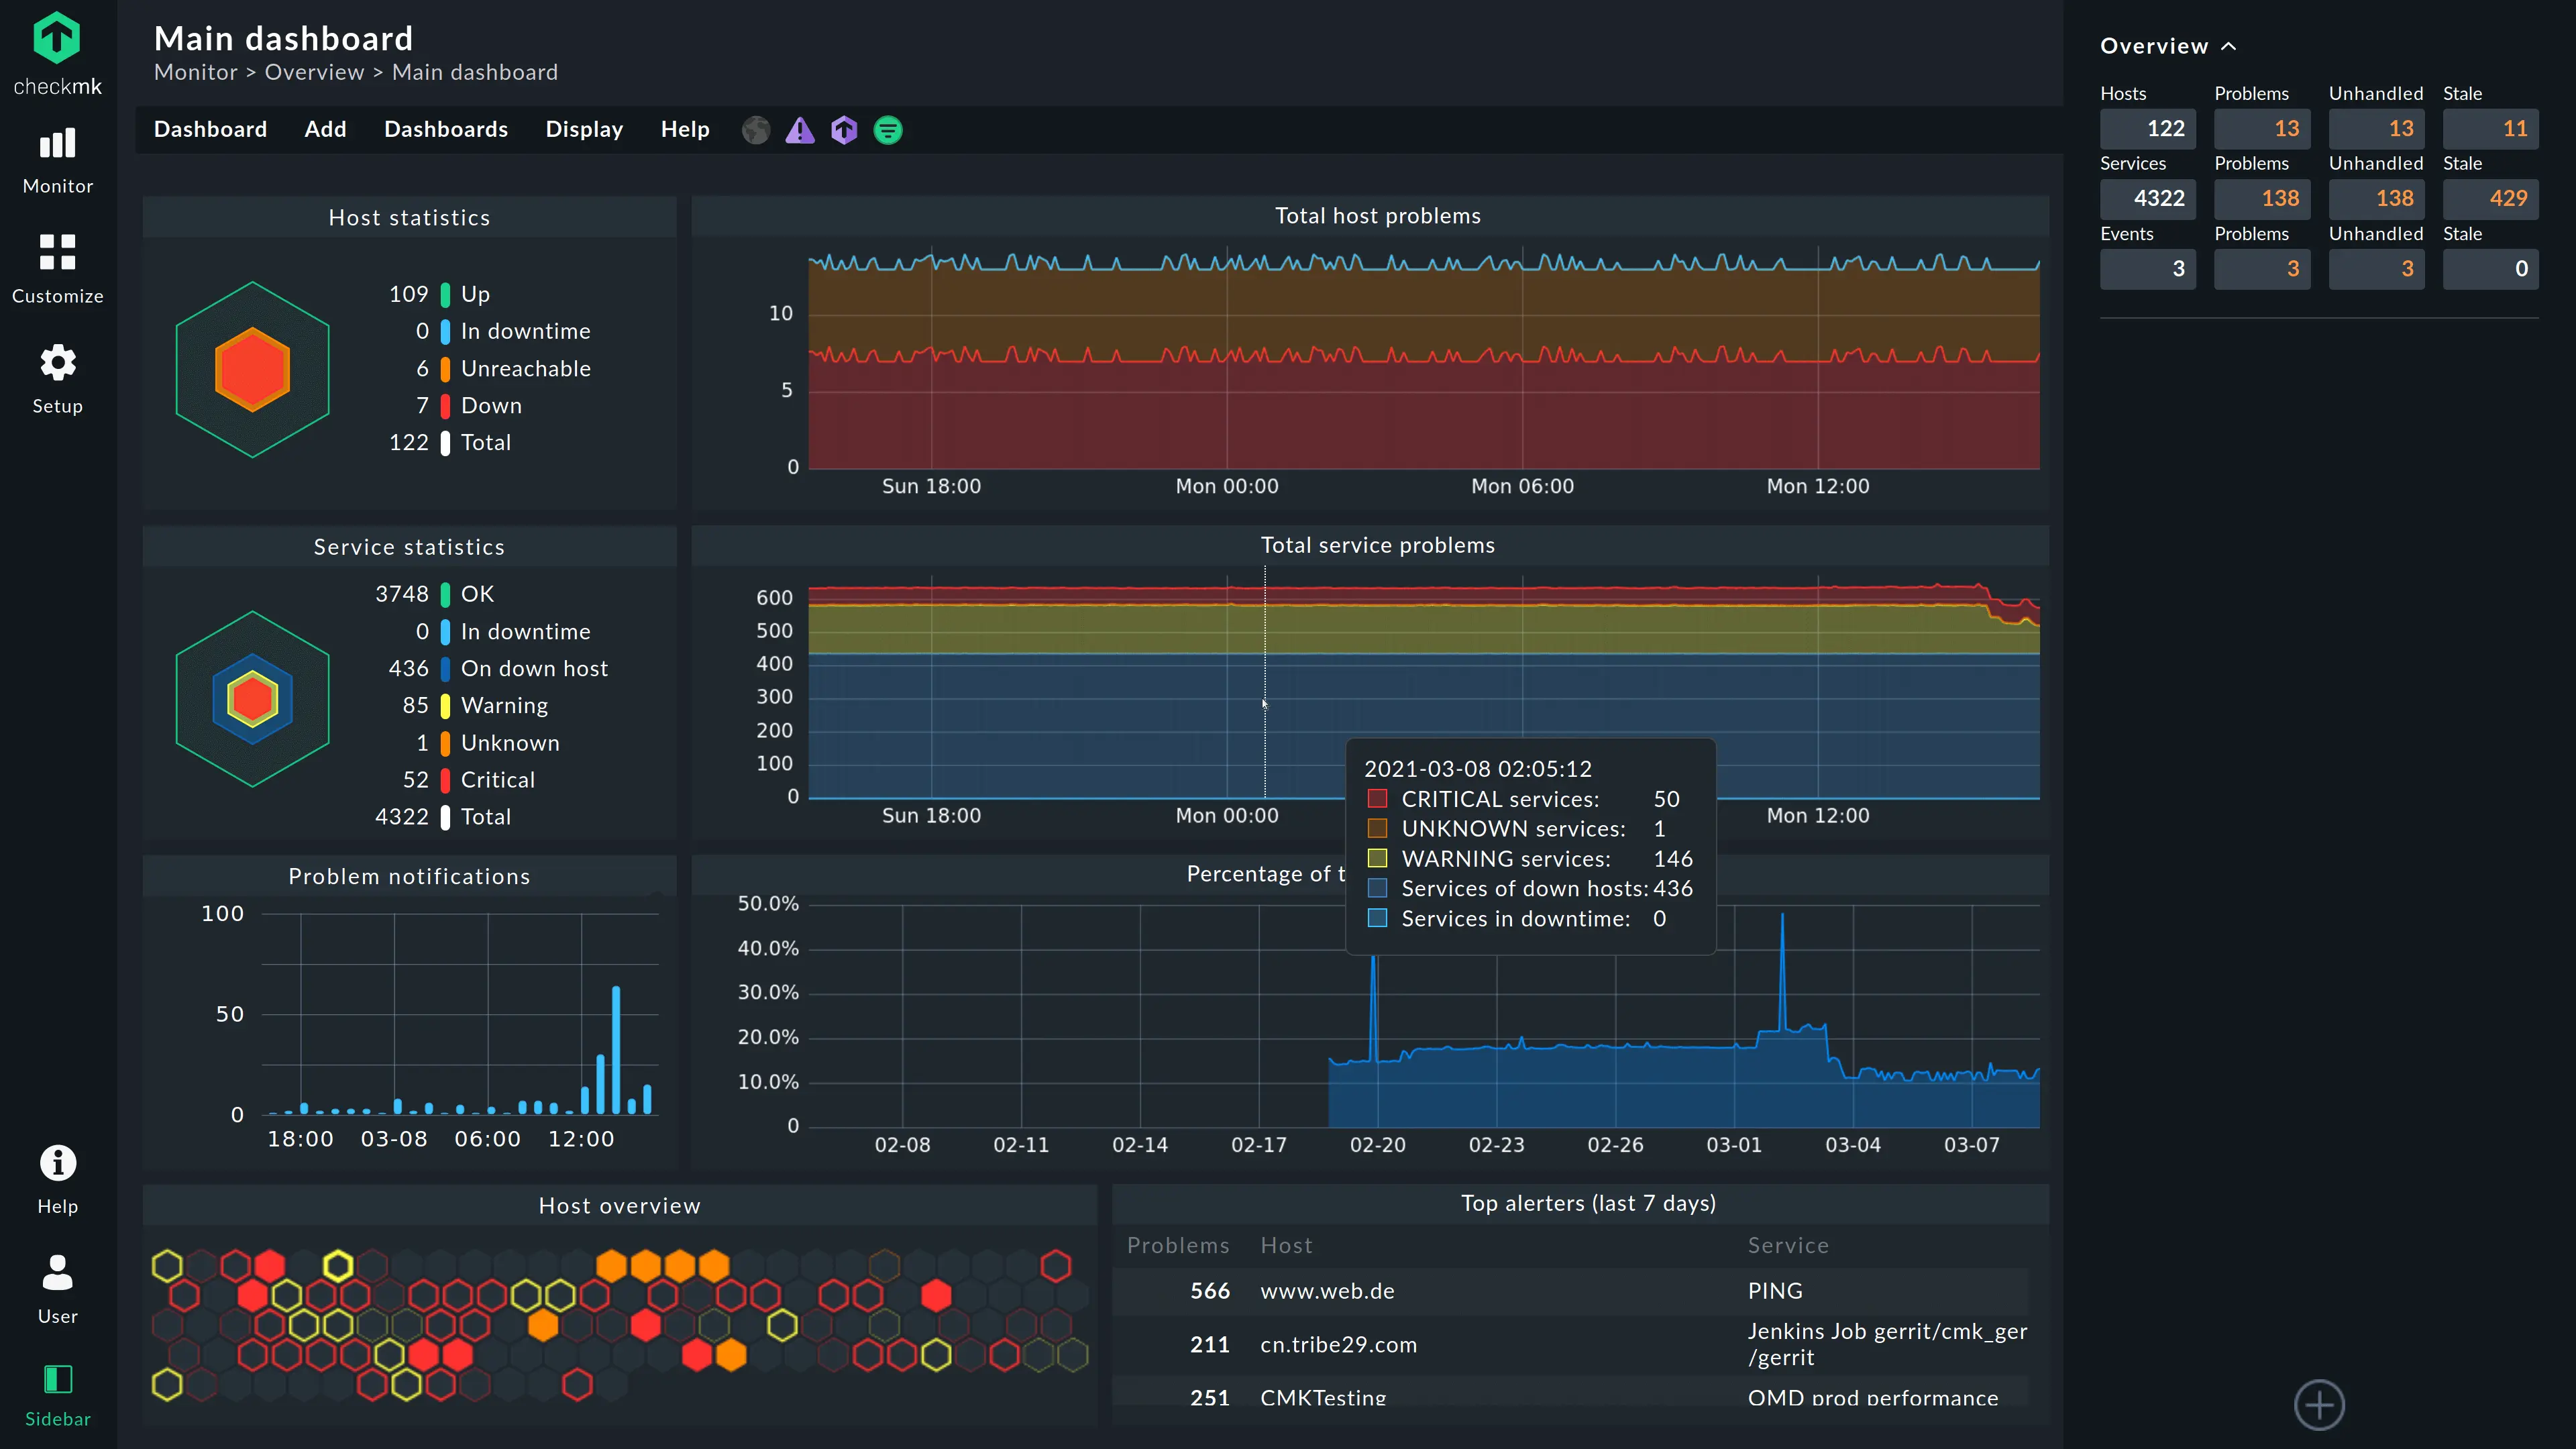
Checkmk is a comprehensive monitoring tool designed to provide detailed insights into servers, networks, and applications. It is particularly noted for its scalability and extensive feature set, making it a robust choice for organizations with complex monitoring needs. CheckMK is a valuable tool for organizations monitoring the health and performance of their Windows servers. It offers agent and agentless monitoring methods for flexibility. CheckMK automates tasks like server discovery and configuration, saving IT teams time.
Features:
- Monitors IT infrastructure (servers, networks, applications)
- Supports various monitoring methods (agents, agentless)
- Automates monitoring tasks (host discovery, configuration)
- Customizable dashboards and reports
- Integrates with various tools and platforms
- Auto-discovery
- Customizable dashboards
- Real-time monitoring
- Extensive plugin support
- Alerting and notification
Pros:
- Scalable
- User-friendly interface
- Strong community support
- Flexible configuration
- Easy to use and deploy
- Manages large, complex environments efficiently
- Cost-effective compared to some competitors
Cons:
- Initial setup complexity
- Requires technical expertise
Pricing: Checkmk offers a flexible pricing model based on the number of services and hosts monitored. It provides cost-effective solutions for businesses of all sizes.
Ideal for:
Medium to large organizations needing flexible and scalable Windows monitoring tools.
8. ManageEngine OpManager
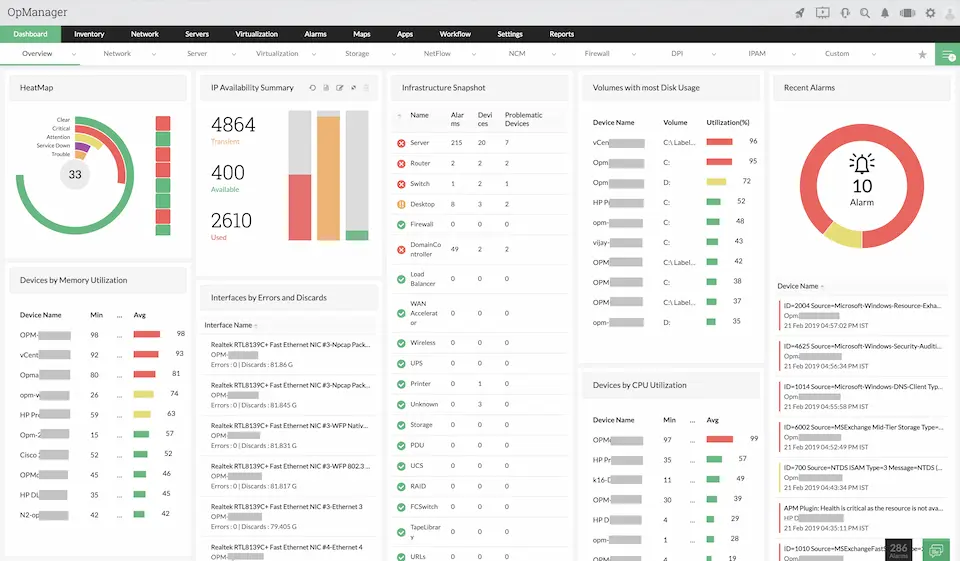
ManageEngine OpManager is a comprehensive network management solution designed to provide in-depth monitoring of both servers and network devices. Its extensive range of features and user-friendly interface make it a reliable choice for businesses of all sizes.
It offers robust Windows server monitoring with both agent and agentless monitoring options, providing flexibility in your deployment strategy. It automates tedious tasks like server discovery and configuration, saving you valuable time.
Features:
- Monitors Windows servers (agent & agentless)
- Automates setup tasks (discovery, configuration)
- Pre-built templates for Windows servers
- Customizable dashboards for focused monitoring
- Alerts and reports for server health
Pros:
- Flexible deployment (agent/agentless)
- Saves time with automation
- Tracks key metrics with pre-built templates
- Tailored views with customizable dashboards
- Proactive with alerts and reports
Cons:
- Can be resource-intensive
- Initial setup can be complex
Pricing:
ManageEngine OpManager uses a tiered pricing model based on the number of monitored devices (including Windows servers, network devices, applications, etc.). It’s a real effort to find their pricing, but we were able to do so.
The standard edition starts at $245 for 25 devices and offers basic features. The professional edition, starting at $345 provides an almost full feature set. If you want everything, plus multi-site / distributed network monitoring, the price skyrockets to $11,545 for 250 devices.
Ideal for:
Organizations looking for a robust and scalable network and server monitoring solution. It is particularly well-suited for environments with a diverse range of devices and applications.
Comparing the 8 Best Windows Server Monitoring Tools
| Tool | Best for | Price | Free trial | Free plan |
| Sematext | SMBs who are looking for an affordable, full-stack monitoring tool with advanced features and stellar support. | Starts at $3.60 per host per month for infrastructure monitoring. | Yes | Yes |
| SolarWinds Server and Application Monitor (SAM) | Large enterprises needing detailed application and server monitoring | Starts at ~$2,955 per year for 150 elements and 1-year support. | No | No |
| Datadog | Full stack observability for large organizations with a large budget. | Infrastructure monitoring starts at $18 per month per host. | Yes | Yes |
| PRTG Monitor | Organizations of any size seeking flexible, comprehensive monitoring. | €1,649 per license for on-premise version with 10,000 monitoring aspects. | Yes | No |
| Nagios XI | Large organizations requiring highly customizable infrastructure monitoring. | Paid plans start at $2,495. | No | Yes |
| AppDynamics | Enterprises and large-scale APM (Application Performance Monitoring). | $6 per CPU core per month. | Yes | No |
| CheckMK | Medium to large organizations needing scalable, cost-effective monitoring. | Starting at Starting at €175.00 for 3000 Services | Yes | Yes |
| ManageEngine OpManager | Businesses seeking comprehensive network and server monitoring with flexible deployment options. | Starts at $245 for 25 devices (Standard Edition). | No | No |
Top 5 Open source Server Monitoring Tools
While there are many paid solutions available, open-source tools offer a cost-effective alternative. These free open source network monitoring tools for Windows provide robust features without the hefty price tag.
Open-source Windows monitoring tools come with numerous advantages.
They are often highly customizable, allowing you to tailor them to your specific needs. Additionally, the strong community support around these tools can be invaluable for troubleshooting and expanding functionality. Free Windows service monitoring tools and free open source network monitoring tools are particularly appealing for organizations looking to optimize their monitoring capabilities without significant investment.
However, it’s important to acknowledge the hidden costs associated with open-source tools.
Configuring Windows service monitoring tools open source and Windows system monitoring tools open source can be complex and requires significant manual work, setup, and maintenance, which can ultimately be more expensive due to the time and expertise needed.
This is where paid solutions can offer a significant advantage, providing ease of use, professional support, and advanced features that streamline the monitoring process.
1. Zabbix
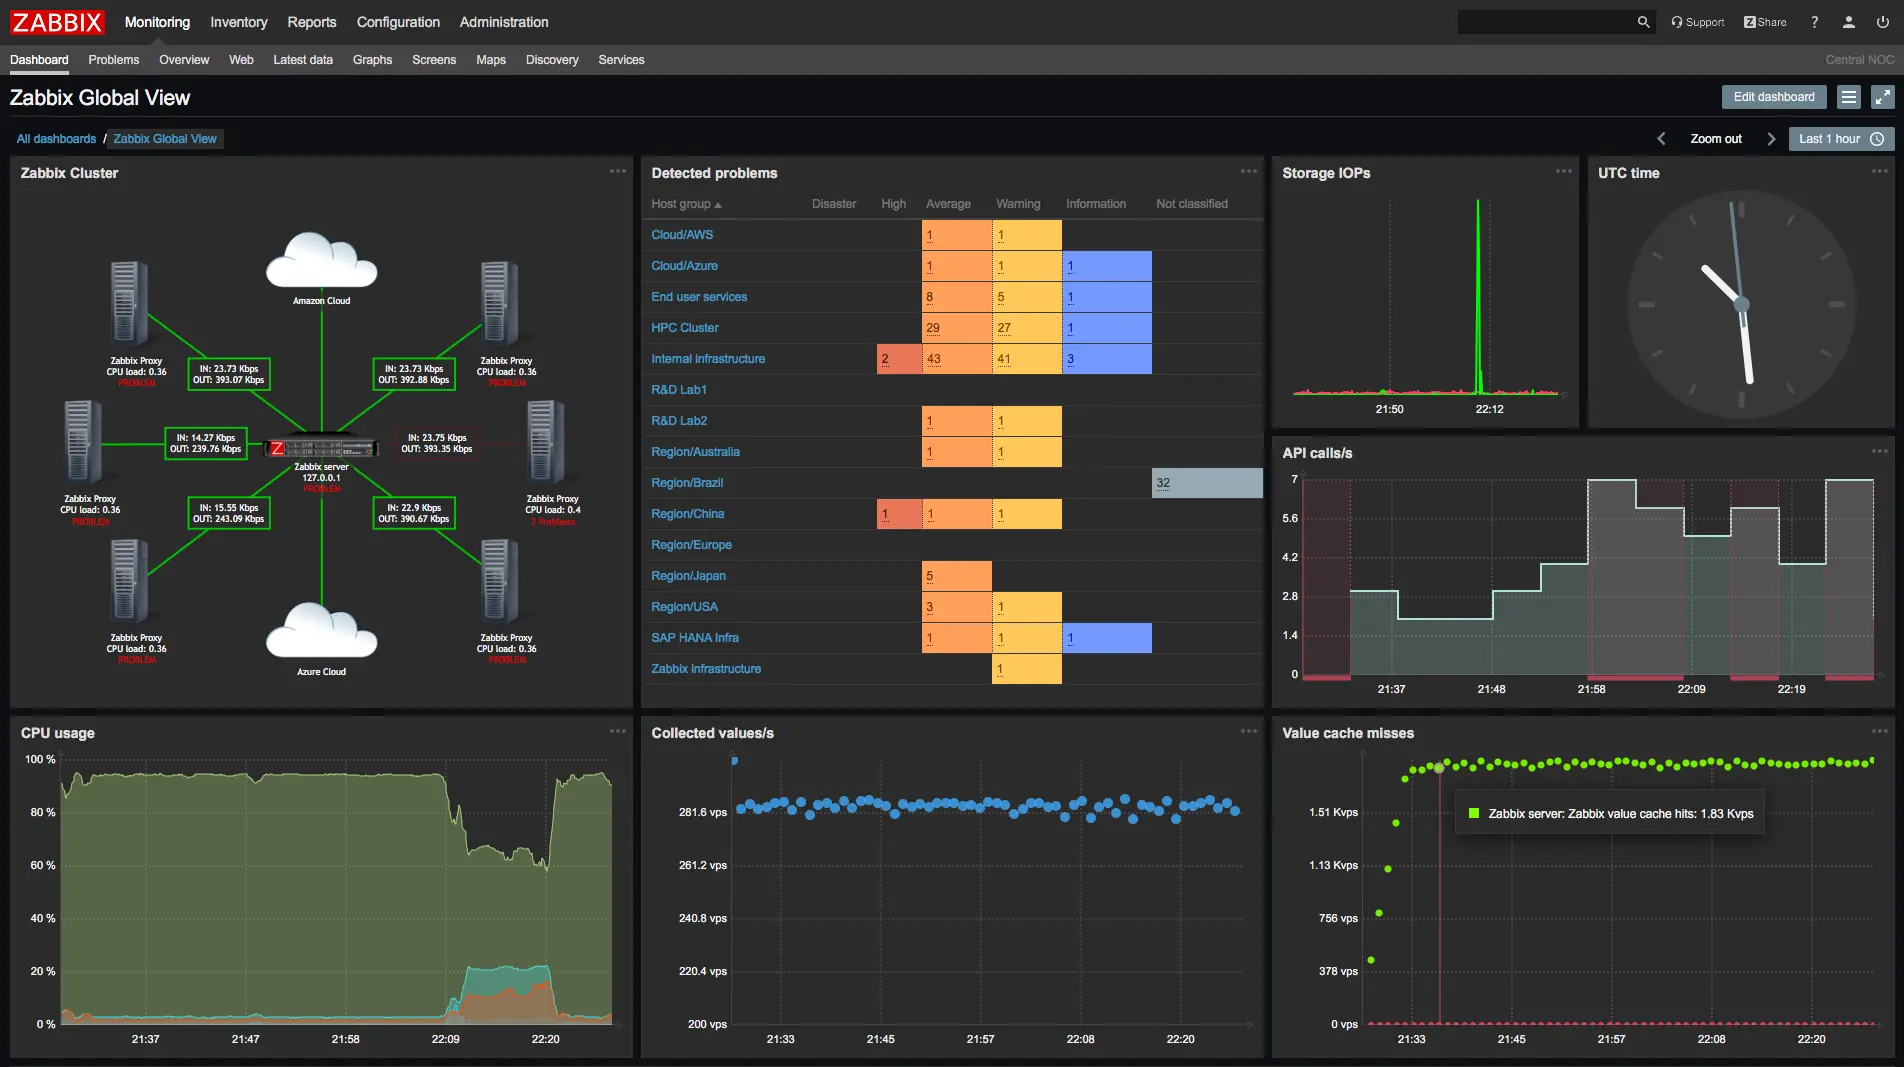
Zabbix is a free and open-source monitoring tool that keeps a watchful eye on everything from your network to your applications and servers. It’s flexible and powerful, letting you customize exactly how you see your IT health. While it might require a bit more learning to set up compared to some paid options, the active community and scalability make it a popular choice.
For Windows servers specifically, Zabbix can dive deep with agent-based monitoring, giving you detailed insights into performance and health. It can even integrate with Windows Management Instrumentation (WMI) to keep an eye on specific services and configurations.
Features:
- Open-source monitoring
Pros:
- Deep server insights
- Cost-effective
- Scalable
- Flexible
Cons:
- User reviews complain about a steep learning curve
- Less user-friendly interface
- Ongoing maintenance required
- High upfront cost (time & expertise)
Ideal for:
Small organizations with technical expertise looking for a free, customizable solution who don’t mind spending hours on setup, and maintenance.
2. Prometheus
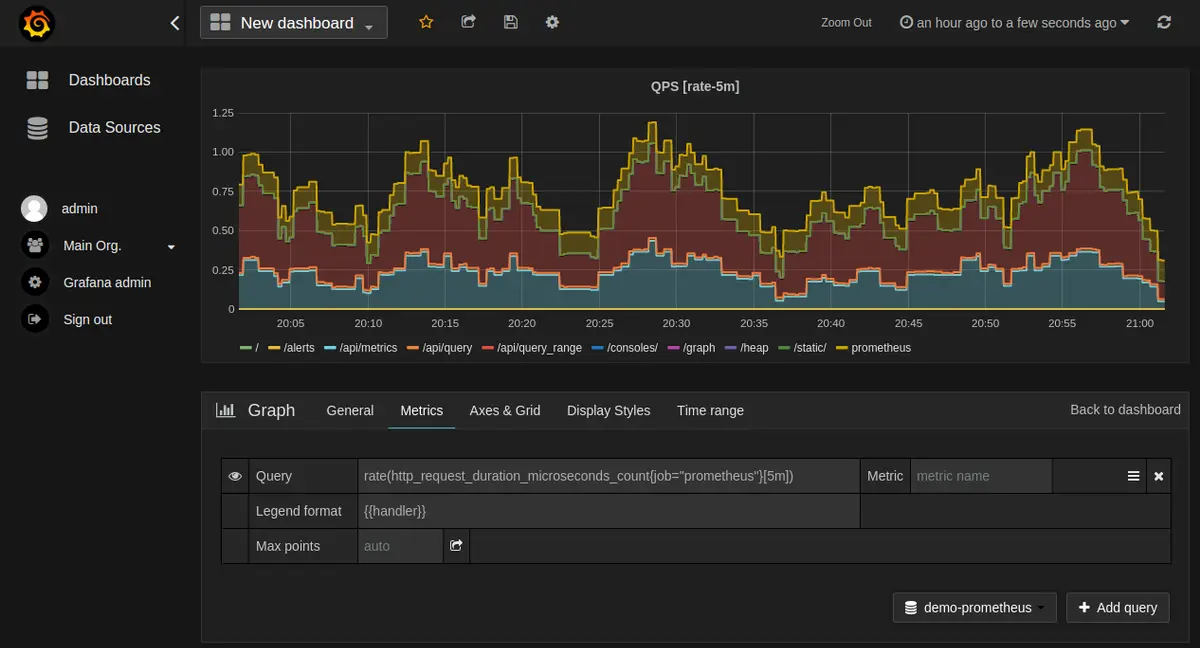
Prometheus is a powerful, open-source monitoring solution known for its robust capabilities in data collection and analysis. It excels in real-time monitoring, providing a flexible data model and a powerful query language that make it an invaluable tool for DevOps teams.
Prometheus is an excellent choice among free Windows server monitoring tools, effectively monitoring Windows server performance, collecting detailed metrics, and providing real-time alerts. While primarily agentless, it can integrate with Windows service monitoring tools open source and use exporters to pull detailed performance data from Windows servers.
Features:
- Open-source monitoring
Pros:
- Highly scalable
- Strong community support
- Extensive documentation
- Seamless integration with third-party tools
Cons:
- Requires configuration
- Limited built-in visualization tools
- Free tools require significant manual work, setup, and maintenance
- High upfront cost (time & expertise)
- User reviews complain about needing third-party tools for better visualization
- User reviews complain about queries being complex and hard to learn
Ideal for:
Ideal for organizations with technical expertise and resources to manage open-source solutions. It is especially suitable for DevOps teams and enterprises looking for a highly scalable and customizable monitoring tool.
3. Nagios Core
Nagios Core is an open-source IT infrastructure monitoring solution known for its robust plugin ecosystem and flexibility. It can monitor things like servers, network devices, applications, and more.
Nagios Core can track the health of your Windows machines, but it usually requires installing an agent on each server. This agent allows Nagios Core to delve deeper and monitor things like specific services or disk usage.
Features:
- Open-source monitoring
Pros:
- Strong community support
- Extensive plugin ecosystem
- Highly customizable
- Community-created plugins available to extend Nagios Core’s functionality
Cons:
- Complex configuration
- Outdated interface
- High upfront cost (time & expertise)
- User reviews complain about difficulties with installing plugins
Ideal for:
Nagios Core is ideal for organizations with in-house technical expertise looking for a free, robust monitoring solution. It is particularly suitable for those needing Windows monitoring tools open source and free Windows server monitoring tools that can be extensively customized to meet specific requirements.
4. Sensu
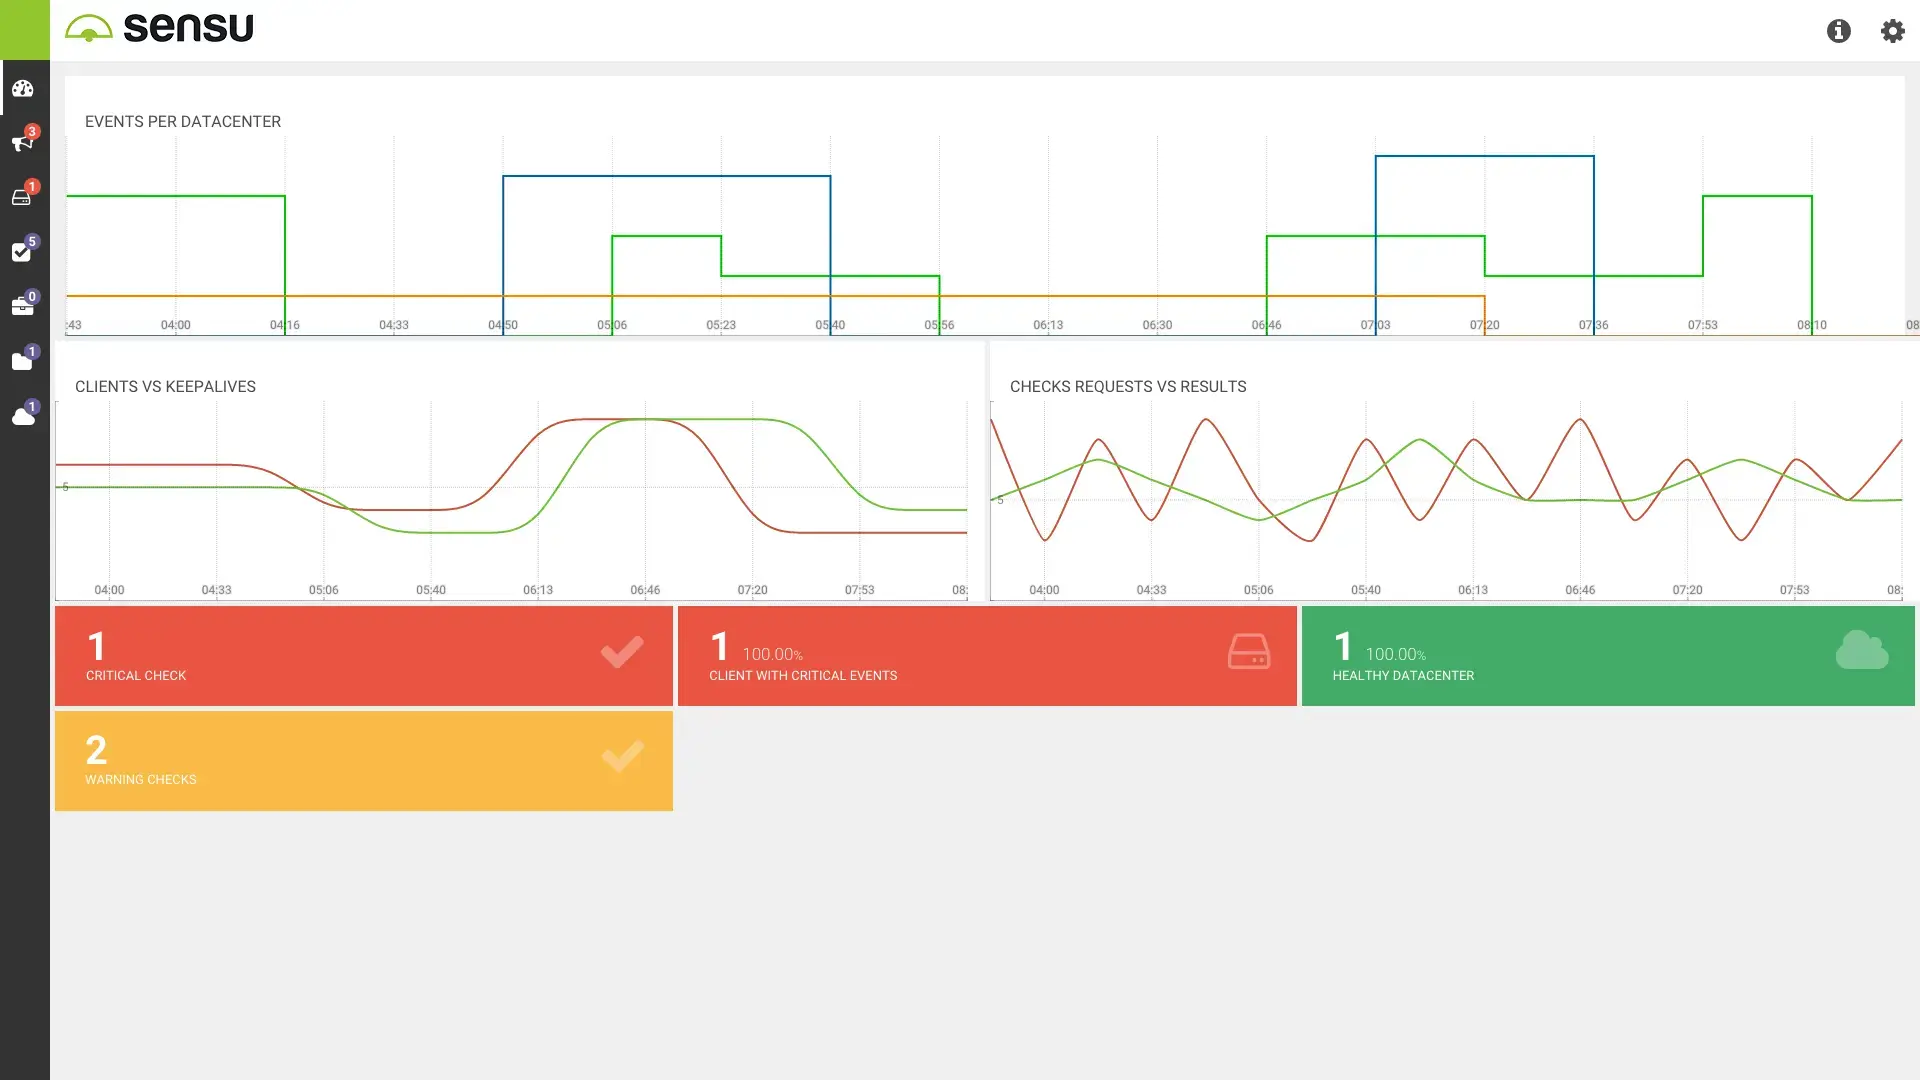
Sensu, like Nagios Core, is an open-source monitoring tool for IT infrastructure. However, Sensu focuses on scalability and flexibility, making it particularly well-suited for cloud environments and modern applications. Sensu works for Windows server monitoring too. It installs an agent on each Windows machine to gather in-depth data on services, disk usage, and other key metrics.
Features:
- Open-source monitoring
Pros:
- Flexible
- Scalable
- Strong community support
Cons:
- Requires configuration
- Can be resource-intensive
- High upfront cost (time & expertise)
Ideal for:
Sensu is ideal for enterprises needing a flexible and scalable monitoring solution. It suits organizations looking for Windows service monitoring tools open source and free open source network monitoring tools that can be tailored to specific needs.
5. Icinga
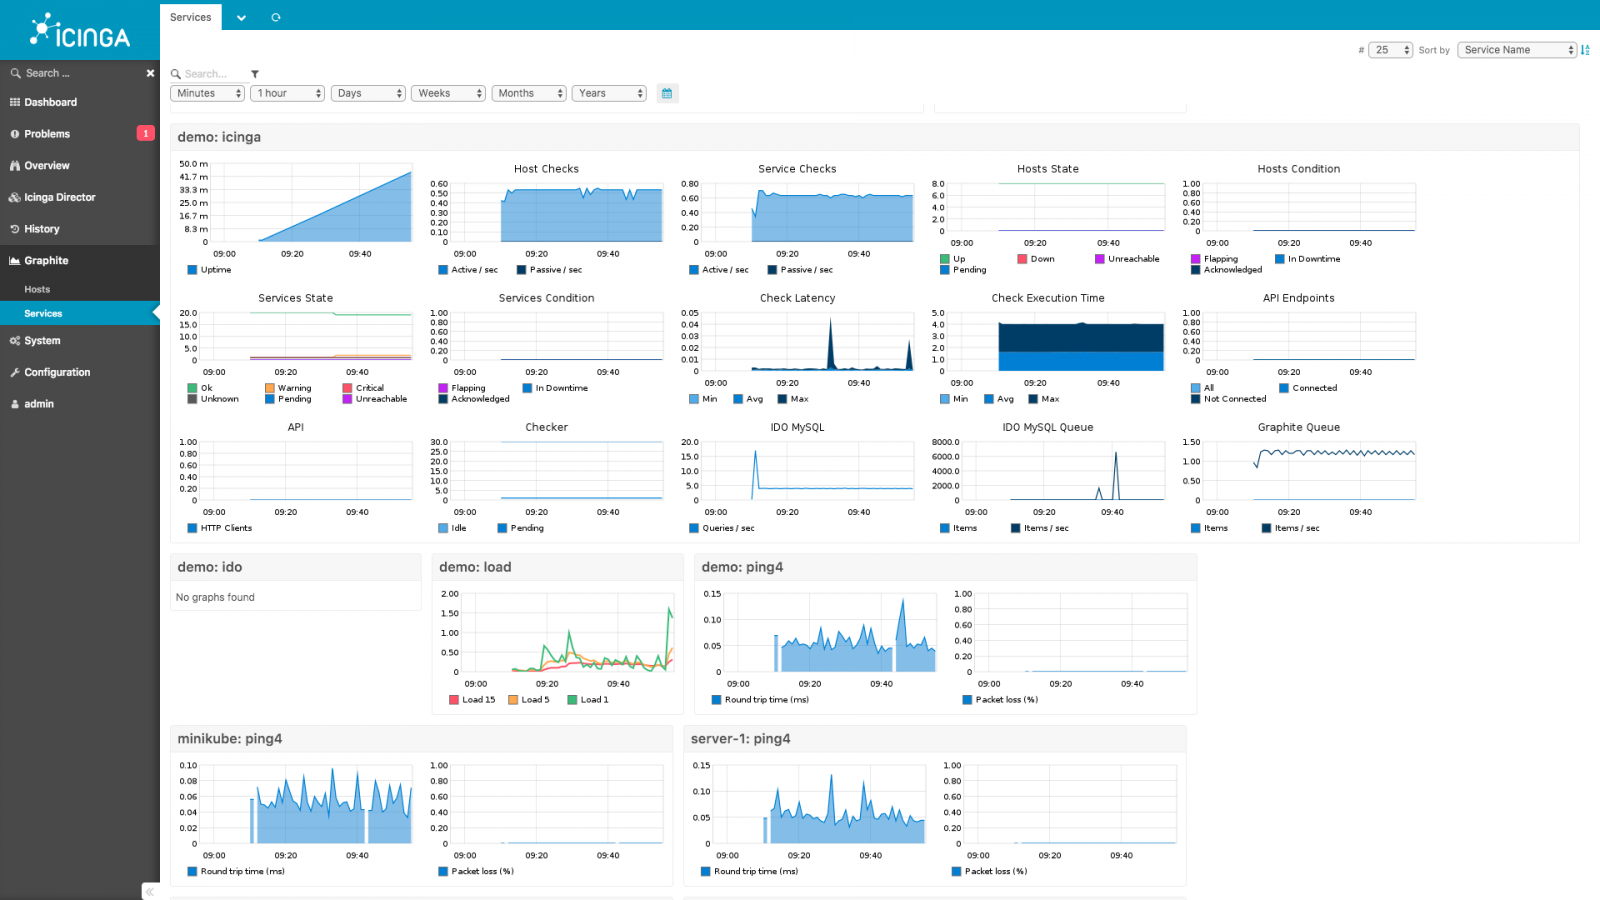
Icinga Core, similar to Nagios, is a free and open-source monitoring powerhouse. It keeps a watchful eye on your entire IT infrastructure, including servers, network devices, and applications. When things go south, Icinga Core fires off alerts to notify you before users are affected.
Icinga can monitor the health of Windows servers but typically requires an agent on each machine. This agent unlocks deeper monitoring, checking specific services or disk usage. Plus, Icinga has a vibrant community creating plugins to expand its Windows monitoring capabilities.
Features:
- Open-source monitoring
Pros:
- Highly customizable
- Strong community support
- Scalable
Cons:
- Complex setup
- Requires technical expertise
- High upfront cost (time & expertise)
Ideal for:
Icinga is ideal for medium to large organizations needing flexible and scalable monitoring. It is particularly well-suited for those requiring Windows system monitoring tools open source and open source network monitoring tools for Windows.
Conclusion
Finally, our list ends here.
As much as the tools might look great on the screen, actually testing and using the tool will prove to be the biggest indicator of success.
For organizations seeking a balance between functionality, ease of use, and cost-effectiveness, Sematext emerges as a top choice among Windows server monitoring tools and Windows service monitoring tools.
Its user-friendly interface, out-of-the-box dashboards, and alert rules save time and effort, while its flexible pricing model ensures that businesses only pay for what they need.