Sematext Monitoring provides Akka monitoring via Kamon and has been doing that for quite a while now. With Sematext and Kamon you get out-of-the-box metrics about Akka Actors, Dispatchers and Routers, Akka’s JVM metrics, and system metrics.
We’ve recently made a few nice Akka monitoring improvements that should be of interest to anyone using Akka, and especially those using Play! Framework.
Want to see a demo and don’t feel like reading?
Go to https://apps.sematext.com/demo and look for any monitoring App with “Akka” in its name.
Want to see an example Akka app that uses Kamon SPM backend for monitoring?
See https://github.com/sematext/kamon-spm-example/
Transaction Traces, Trace Segments & Errors
We’ve expanded our Transaction Tracing support and now support Kamon’s Traces and Trace Segments. Note that Traces don’t necessarily have to be initiated by an HTTP request. Sematext Transaction Tracing lets you specify where a transaction starts. You can see that in our Demo Akka App, which is not actually a web app, so we specified where in code its transactions start and end. Traces can be produced by instrumentation libraries like kamon-play or manually in the code using something like this:
val tContext = Kamon.tracer.newContext("name")
And for segments:
val segment = tContext.startSegment("some-section", "business-logic", "kamon")
// your code that is a part of this transaction would be here
segment.finish()
tContext.finish()
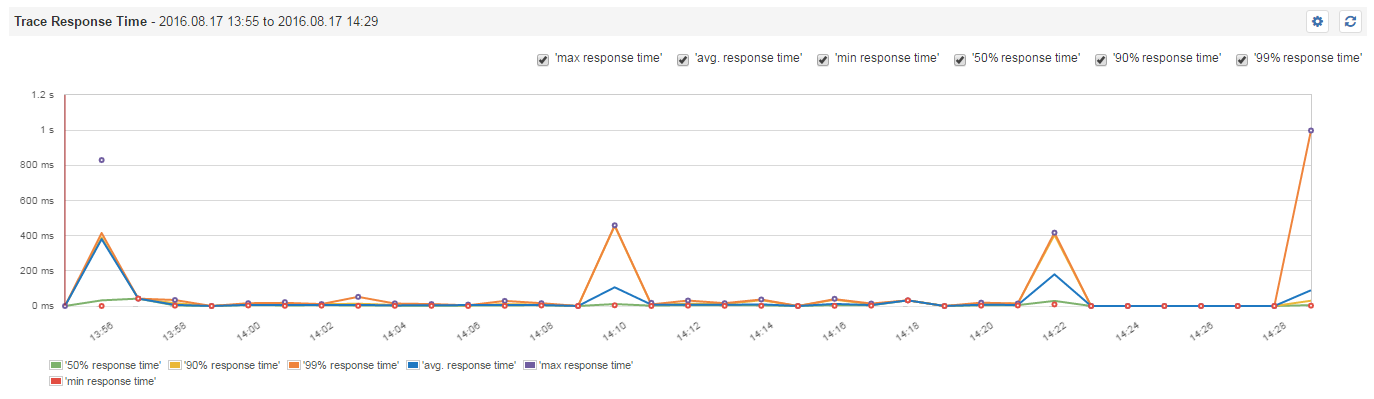
So what exactly do these Akka monitoring reports look like? Here are some examples:
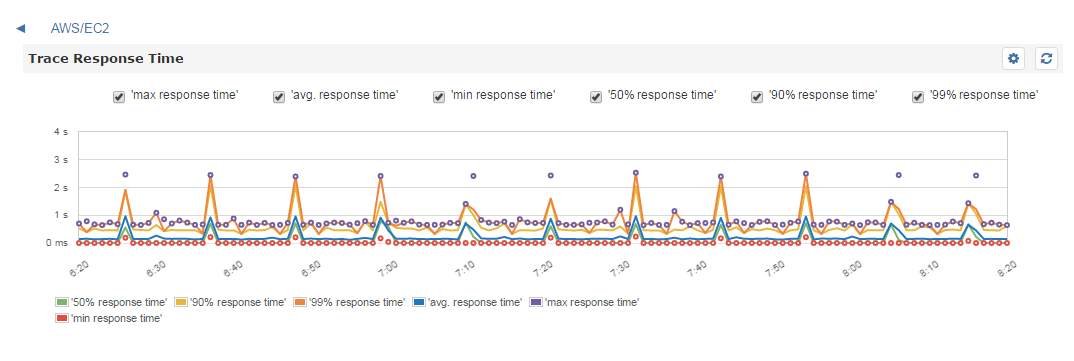
Trace response time for AWS/ECS request trace
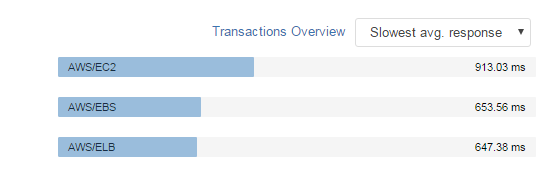
Slowest traces
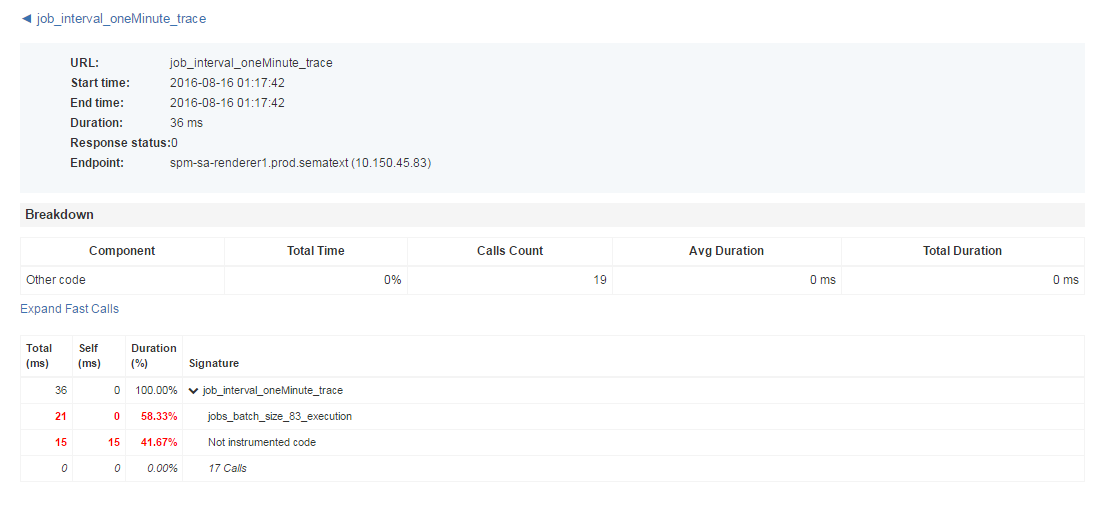 Trace and trace segment information
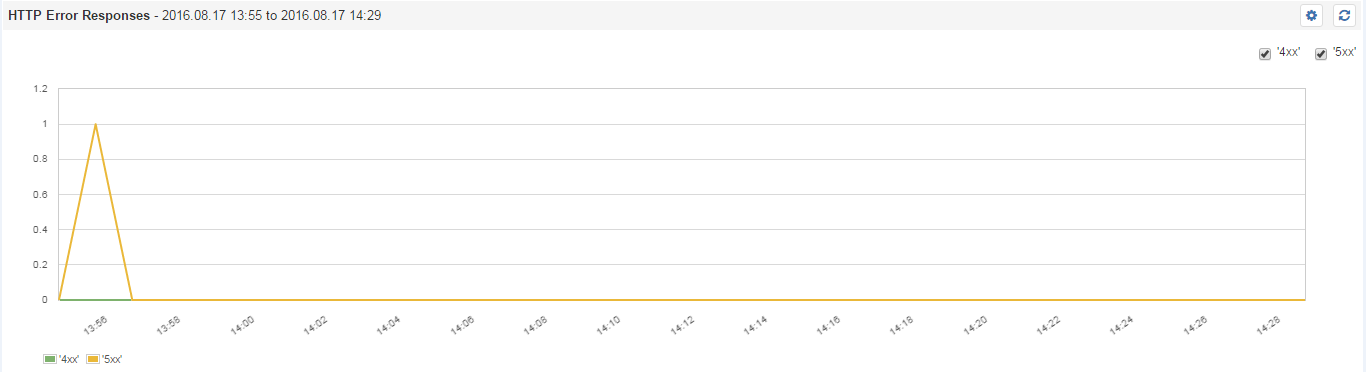
Sematext will also show you charts with the number of transaction errors if you are using Kamon 0.6.3 or newer:

To enable this in your app just add the following to your application.conf (see example application.conf):
trace = [ "**" ]
trace-segment   = [ "**" ]
And add
"org.apache.thrift" % "libthrift" % "0.9.2"
to your dependencies in build.sbt.
If you are using Maven just add the following to your pom.xml:
<dependency>
<groupId>org.apache.thrift</groupId>
<artifactId>libthrift</artifactId>
<version>0.9.2</version>
</dependency>
Play! Framework Monitoring
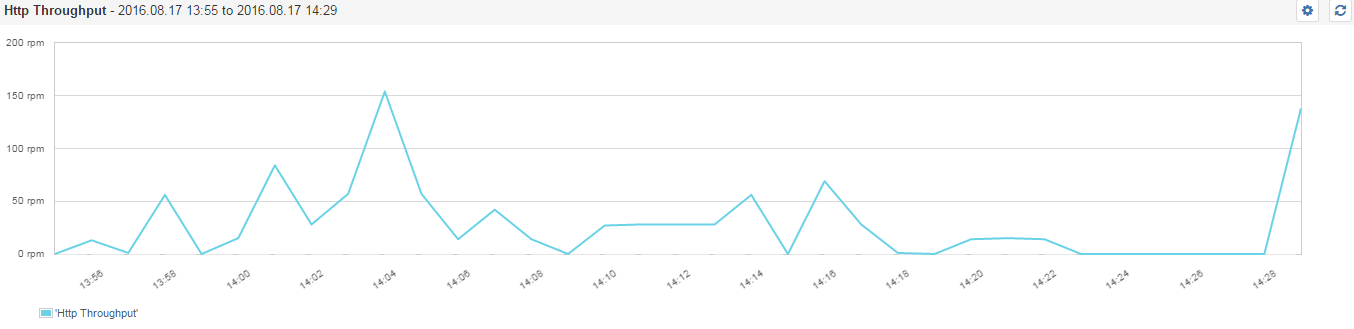
Kamon includes a kamon-play module, which ships with bytecode instrumentation aimed at automatic traces and segments management and automatic trace token propagation to your Play! applications. Sematext now has support for monitoring Play Framework metrics, too, and now collects traces, HTTP error counts, trace response times, and throughput.
To enable this in your Play! app just add the following to your application.conf (see example application.conf):
trace = [ "**" ]
trace-segment   = [ "**" ]
http-server     = [ "**" ]
Add “org.apache.thrift” % “libthrift” % “0.9.2” to dependencies
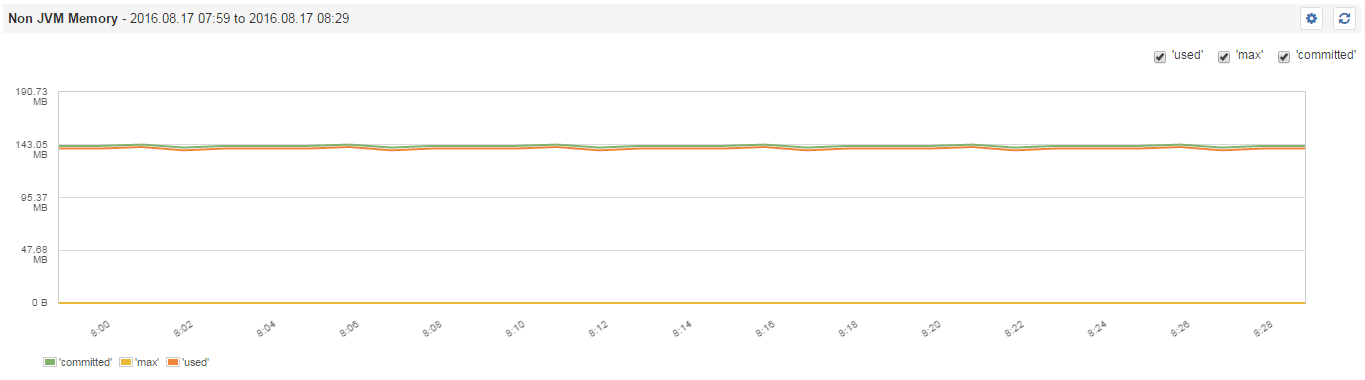
Akka Memory Monitoring
For any apps that run on the JVM Sematext will give you out of the box reports for various JVM metrics, like garbage collection counts and latency, size and utilization of every JVM memory pool, and JVM thread counts. For Akka memory monitoring we go a bit further and provide additional reports for JVM heap and non-heap memory as well as class loading. Here are some samples:
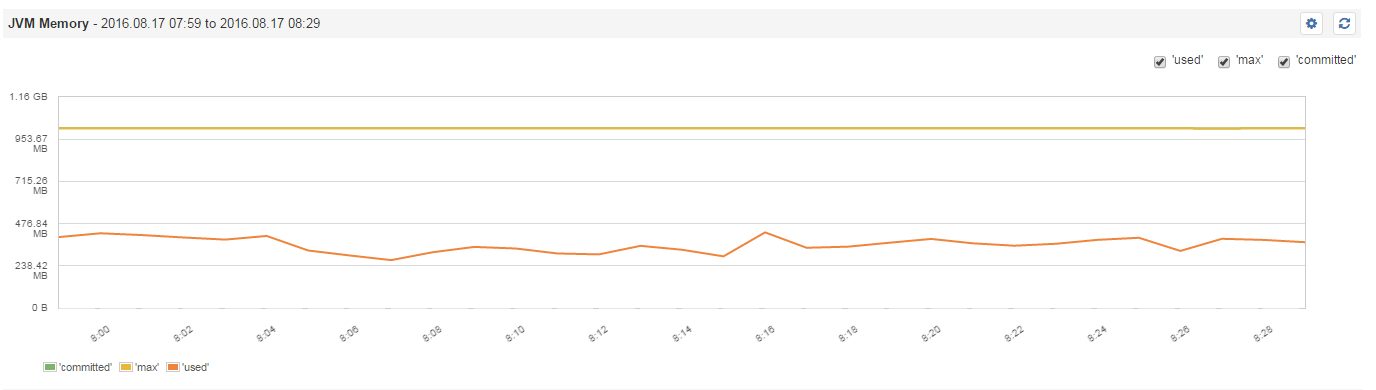
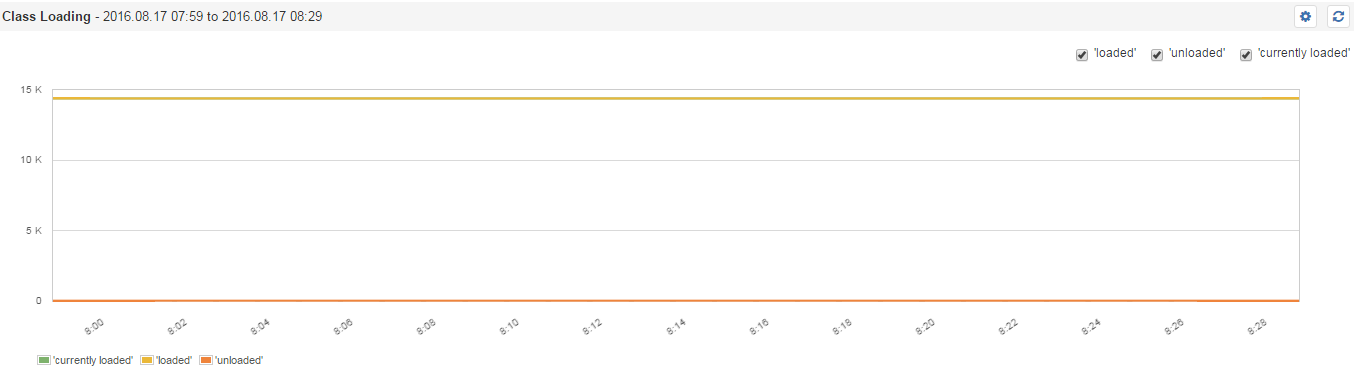
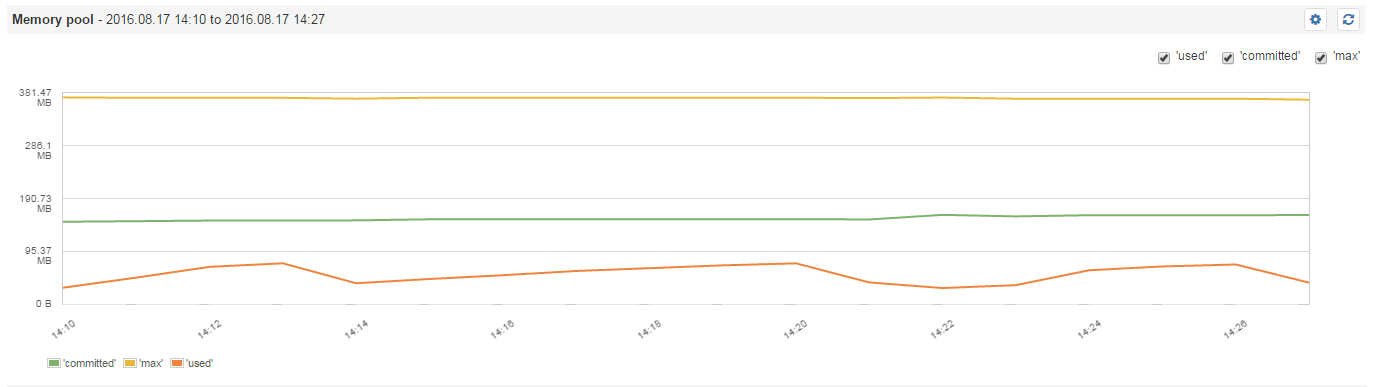
To get these reports you don’t have to do anything — you’ll get them out of the box.
Custom Metrics Monitoring
Besides giving you out the box monitoring with a number of integrations, you can also send custom metrics to SPM. They can be performance metrics, business metrics, or really anything you want to graph, alert on, stick on dashboards, correlate with other metrics or logs (see Logsene!) and so on. You can now send Custom Metrics via Kamon, too.
To start sending metrics to SPM, just add the following to kamon.spm.subscriptions {…} (see example application.conf):
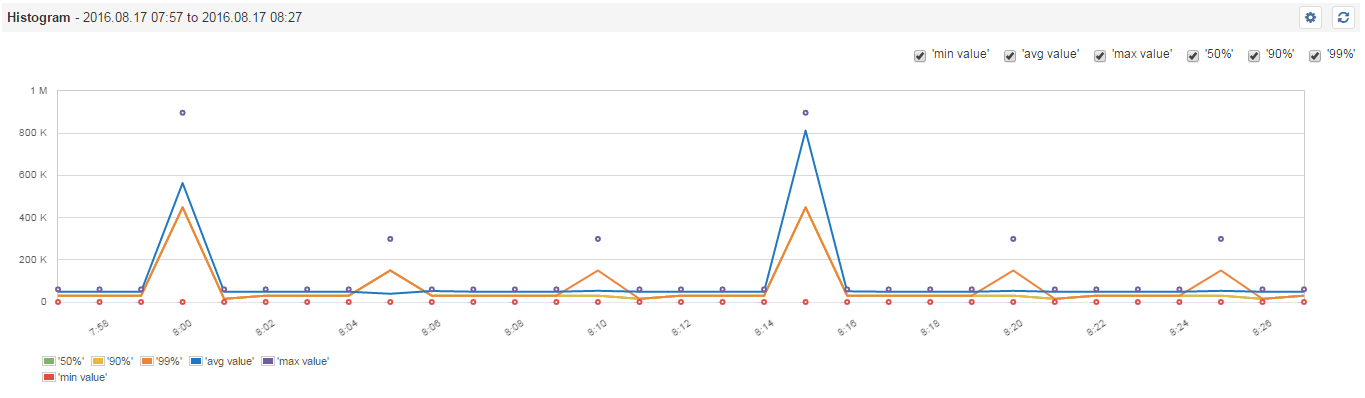
histogram       = [ "**" ]
min-max-counter = [ "**" ]
gauge           = [ "**" ]
counter         = [ "**" ]
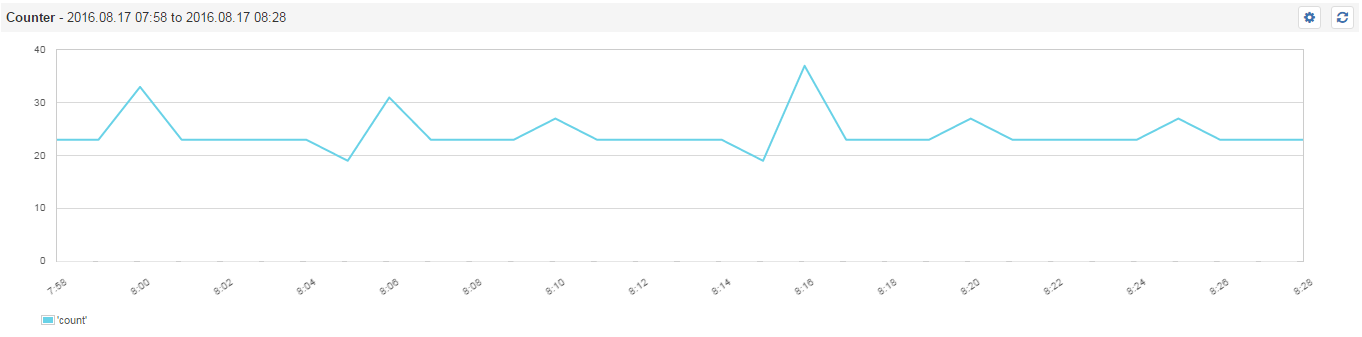
What do you get with that? You get custom custom histograms on whichever metrics you send:
…. or custom counters:
We hope Sematext Akka monitoring helps you optimize run your Akka and Play apps better and faster!
Any question or feedback? Get in touch with us via Twitter or e-mail.