Update: Elasticsearch 2.x and above require a setup with standalone monitors. Why? A very restrictive Java security policy got implemented in Elasticsearch 2.x. This security policy forbids loading of 3rd party libraries – including in-process monitoring libraries from SPM. Here is an example with Docker Compose and SPM-Client standalone monitor, working with Elasticsearch > v2.x.
The official Elasticsearch Image on Docker Hub has already generated more than 1.6 million pulls. It is probably the easiest way to get a development setup — which includes Elasticsearch — to the application stack. The reason for this crazy number? A rapidly growing number of organizations are using Elasticsearch and Docker in production. Needless to say, monitoring Elasticsearch is essential in production, and you can find a detailed analysis of this topic (including the “top 10 Elasticsearch metrics to watch”) in the free eBook: ElasticsearchMonitoring Essentials. Docker is disruptive in many ways, and there are many things that are slightly different and worth mentioning. These include:
- Changed deployment for Elasticsearch and its monitoring tools using Dockerfile, Docker Compose or various Orchestration Tools
- There is a new Layer to monitor: Container Metrics and Events, see: Docker Events and Metrics monitoring and SPM for Docker
- Logging has changed: containers log to the console and logs needs to be retrieved from Docker-Daemon instead of getting them from the Elasticsearch log file. Check out our post on the subject: Innovative Docker Log Management
- Official Images may not provide options for monitoring (such as JMX). However, the official Image for Elasticsearch provides an option to pass parameters to the Java Runtime Environment. We will use this option for Elasticsearch monitoring in this post. You should also be aware that the official Elasticsearch Image does not include any plugins, and commercial monitoring from Elastic can’t be distributed in this Image for licensing reasons. Our monitoring tool of choice is SPM. If you are not familiar with SPM — but have heard of it — or if you use Marvel, have a look at Marvel vs. SPM.
Next, I’m going to demonstrate a setup to monitor multiple Elasticsearch nodes on a single Docker Host. The final setup will provide the full Monitoring and Logging package:
- Detailed Application Metrics for Elasticsearch, deployed on Docker
- Detailed Container Metrics and Docker Events
- Centralized Logs for all Containers by SPM for Docker
So let’s first decide on one of the following options to monitor Elasticsearch on Docker. You can:
- Build your own Elasticsearch container with the included monitoring components. I’m not going to go into details about this option today; rather, I’m going to focus on the official / trusted build.
- Use a standalone agent, which queries metrics from the Elasticsearch container. This requires a setup for JMX and Docker networking configurations for the monitor and Elasticsearch. The metrics, gathered by remote agents, are limited and, in the Docker context, running an external monitoring process plus Elasticsearch processes consumes more resources. And the next option …
- Inject an SPM in-process monitoring agent into Elasticsearch. This option has the lowest resource usage and has support for advanced monitoring functions like Transaction Tracing and AppMap.
I chose to implement Option #3 in this blog post because it provides the best insights into Elasticsearch. This means the Elasticsearch container needs file-system access to the SPM monitoring agent. Sematext provides the SPM Client (which includes the monitoring agent and metrics sender) pre-installed in a Docker Image, referred as “SPM Client Image/Container” in the following instructions and published on Docker Hub as “sematext/spm-client”. The main trick here is to mount a volume from SPM-Client Container into Elasticsearch Containers in order to load the monitoring library.
Let’s have a look at the desired setup and how to get there:
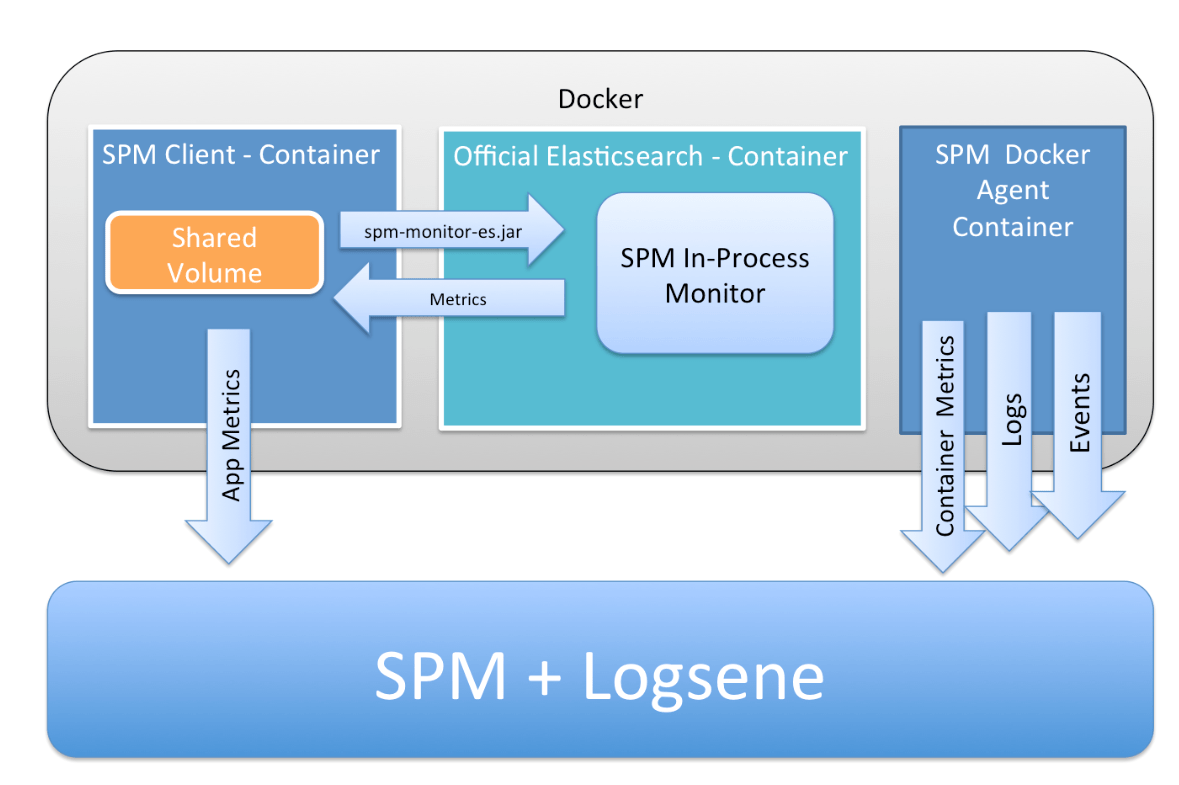
Monitoring Setup for Elasticsearch on Docker
1) Pull the Docker Image for SPM Client
Here is the SPM Client Image – the important thing to know about this image is that it provides a VOLUME (/opt/spm), which can be mounted from the Elasticsearch Container. Download SPM-Client Image:
docker pull sematext/spm-client
2) Configure and start SPM-Client Container
The SPM Token is a unique identifier for monitored applications – if you haven’t yet created an SPM App for Elasticsearch, then create one here.
Save the SPM Token in an Environment Variable
export SPM_TOKEN=4feb144c-4da8-xxxx-xxxx-b0b8e06e743a
Choose name for the Elasticsearch nodes
export ES1=ES_1
export ES2=ES_2
Create SPM Config String - let's configure 2 nodes in this example
export SPM_CONFIG="${SPM_TOKEN} es javaagent jvmname:${ES1}"
export SPM_CONFIG="${SPM_CONFIG};${SPM_TOKEN} es javaagent jvmname:${ES2}"
Start SPM-Client with the defined configurations
docker run -d --name spm-client -h spm-client -e SPM_CONFIG="$SPM_CONFIG" -v /var/run/docker.sock:/var/run/docker.sock sematext/spm-client
3) Start Elasticsearch Containers
We are ready to fire up multiple Elasticsearch nodes (in our example the nodes ES_1 and ES_2). In the command we see options for the SPM In-Process monitor to inject a .jar file from SPM Client Volume — the ES_JAVA_OPTS string is taken from SPM install instructions — using the SPM Token and naming the JVM (because we like to run N instances on the same host)
start first node
export ES_JAVA_OPTS_1="-Dcom.sun.management.jmxremote -javaagent:/opt/spm/spm-monitor/lib/spm-monitor-es.jar=${SPM_TOKEN}::${ES1} -Des.node.name=${ES1}"
docker run --name $ES1 -h $ES1 -e ES_JAVA_OPTS -p 9200:9200 -d --volumes-from spm-client elasticsearch
start second node
export ES_JAVA_OPTS_2="-Dcom.sun.management.jmxremote -javaagent:/opt/spm/spm-monitor/lib/spm-monitor-es.jar=${SPM_TOKEN}::${ES2} -Des.node.name=${ES2}"
docker run --name $ES2 -h $ES2 -e ES_JAVA_OPTS -d --volumes-from spm-client elasticsearch
Almost done! After a minute or so metrics for the Docker Host, JVMs and Elasticsearch nodes will arrive to our SPM App.
Please note, because we chose a consistent naming for Elasticsearch Nodes (-Des.node.name), Container Hostname (-h) and JVM Name (-javaagent:/opt/spm/spm-monitor/lib/spm-monitor-es.jar=${SPM_TOKEN}::${ES1}) we can immediately see in every chart the relevant filters named “ES_1/ES_2” – much better than some random Container IDs or automatically generated Elasticsearch Node-Names!
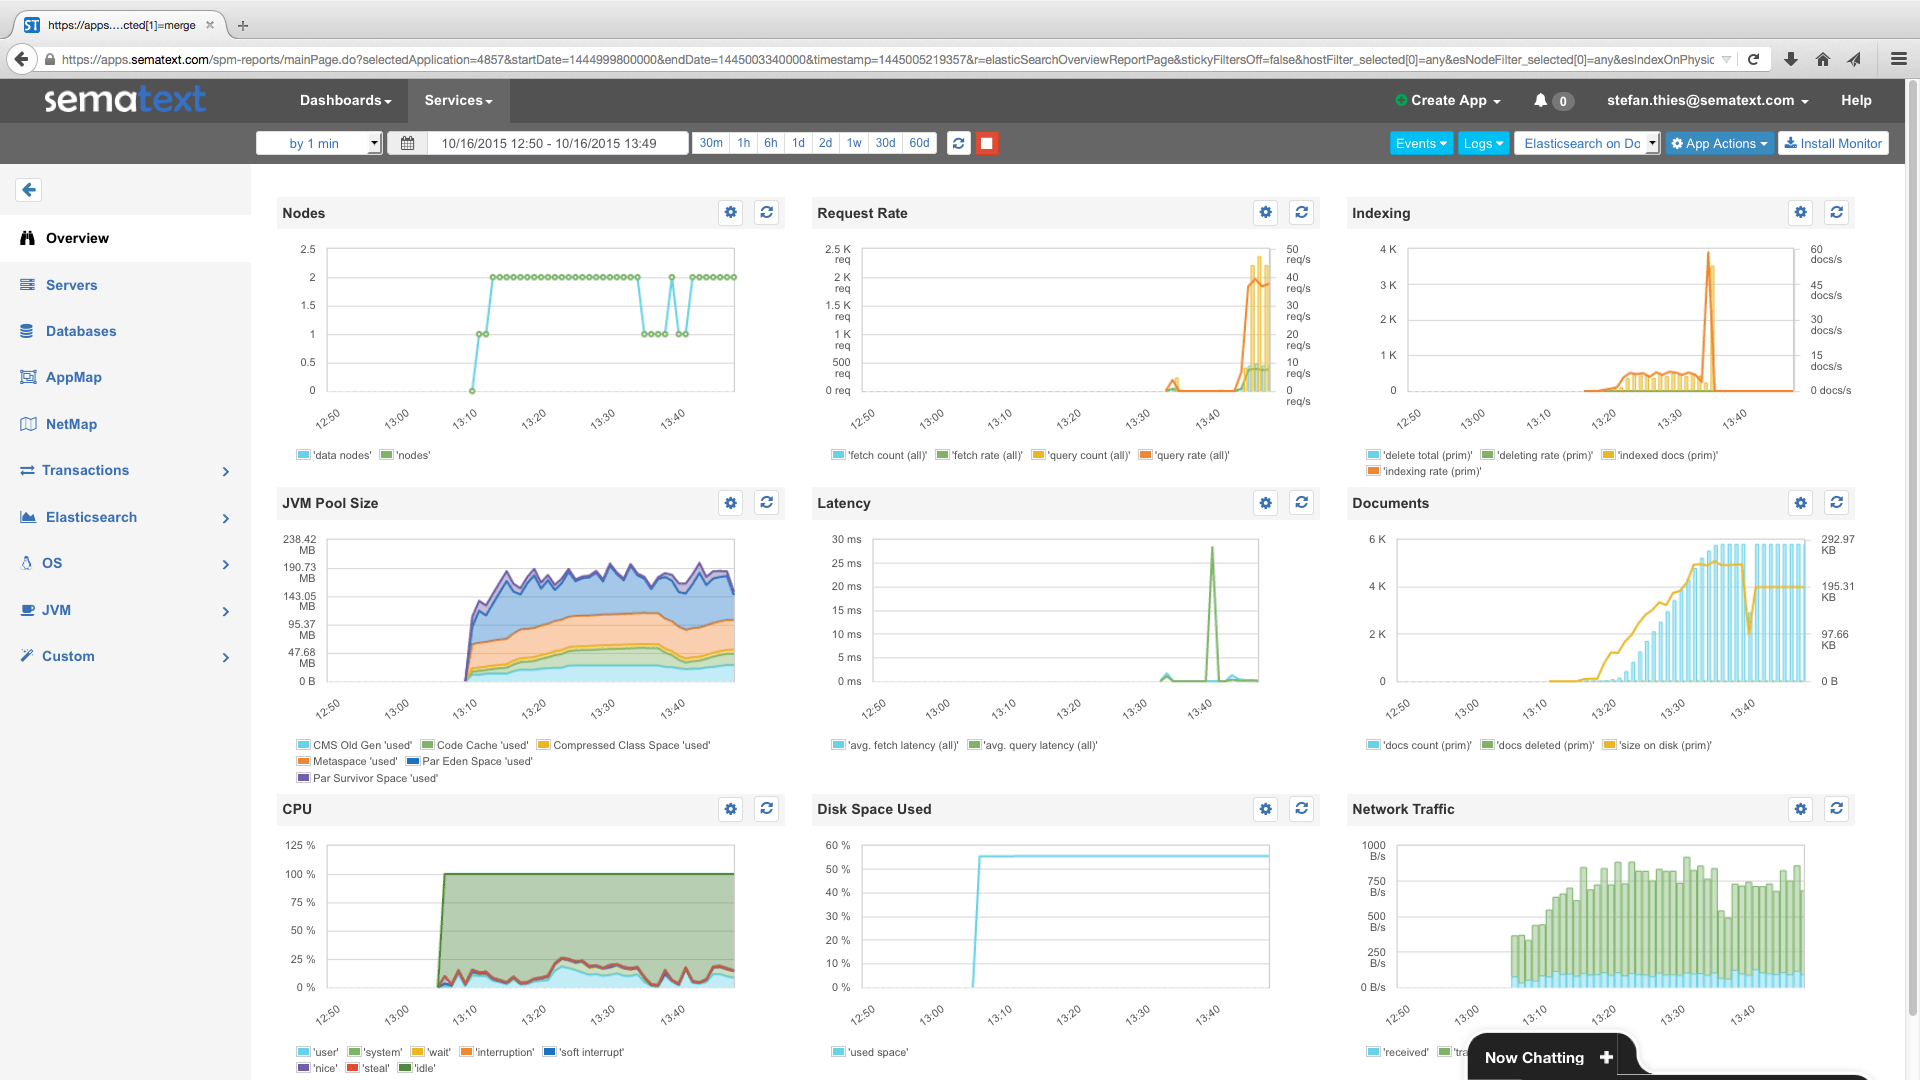 SPM overview for monitored Elasticsearch Containers
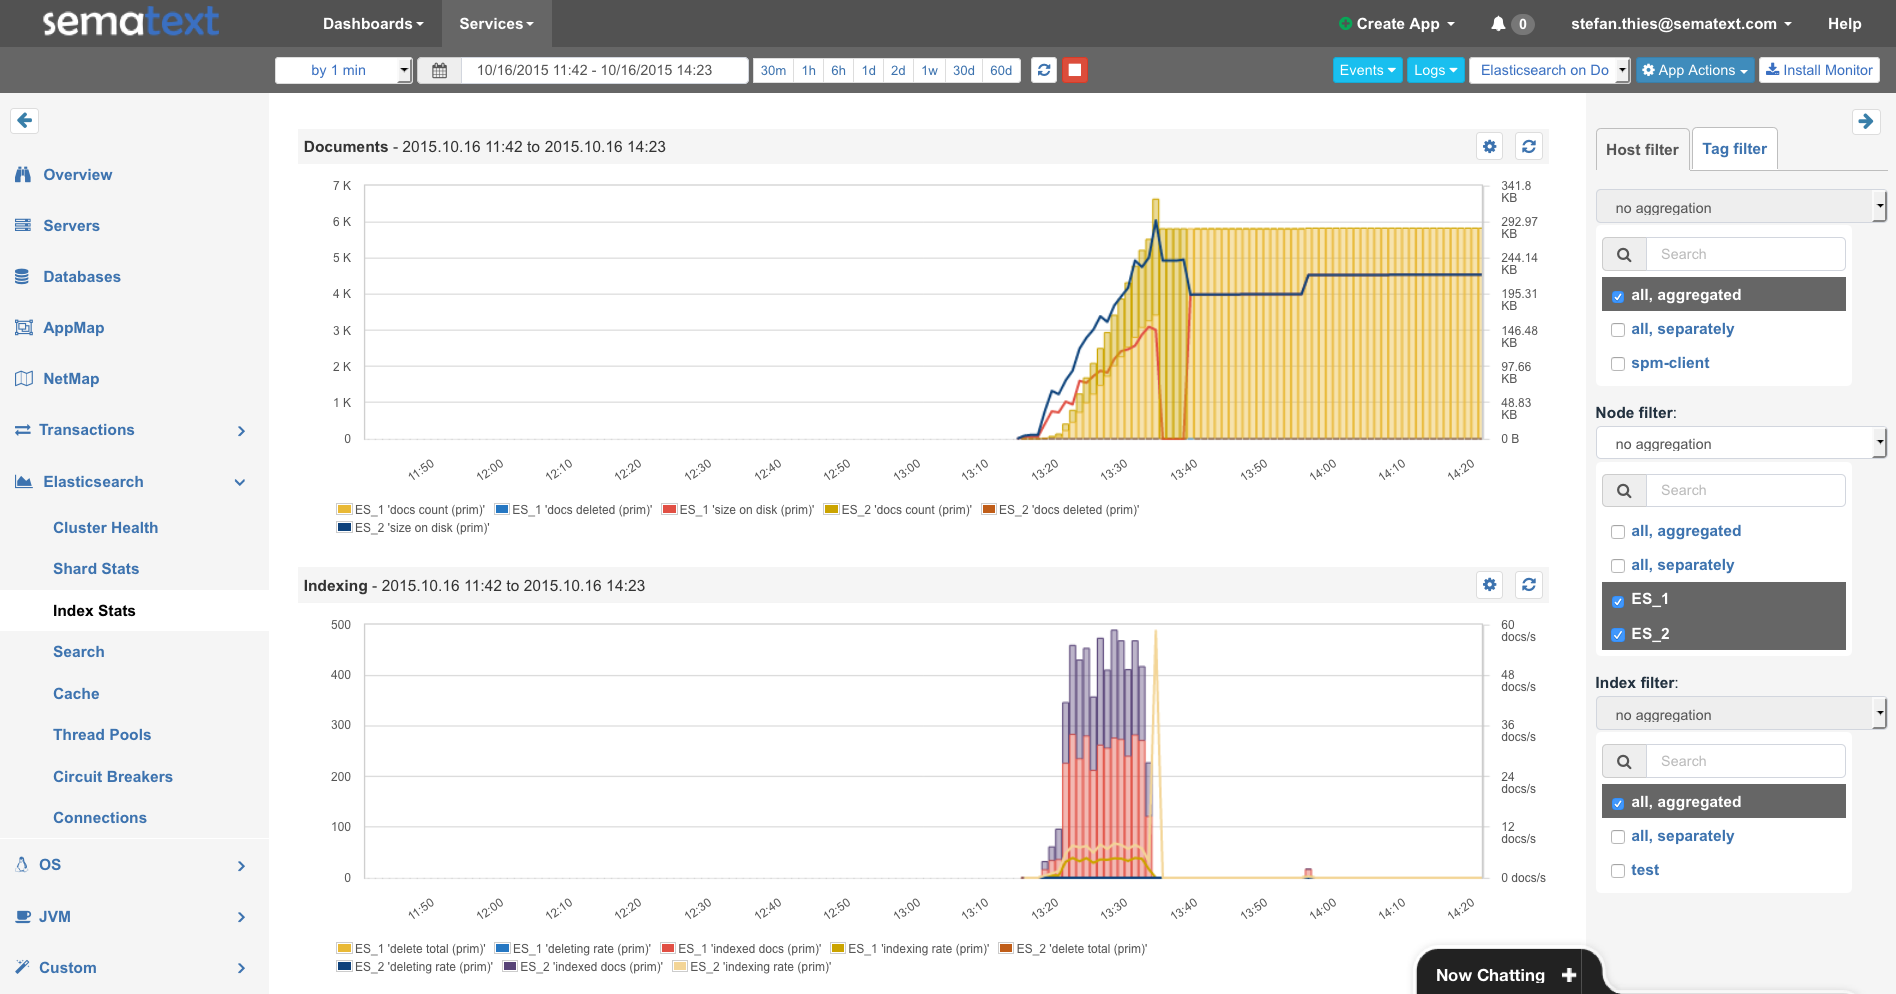 Index Stats for the Elasticsearch Nodes ES1 and ES2
But what about my Elasticsearch Logs and the Container Metrics?
Simply run SPM for Docker – it collects logs (and it can parse Elasticsearch logs) and stores them in Logsene (not used Logsene before? See Logsene 1-Click ELK Stack). First we create the SPM App with the type “Docker” and we create a Logsene App to receive the logs. Then we use the generated App Tokens to run SPM for Docker
docker run -d --name spm-agent --restart=always -e SPM_TOKEN=SPM_DOCKER_APP_TOKEN -e LOGSENE_TOKEN=LOGSENE_APP_TOKEN
After a few minutes, you’ll see Host and Container Metrics together with Events and Logs in SPM.
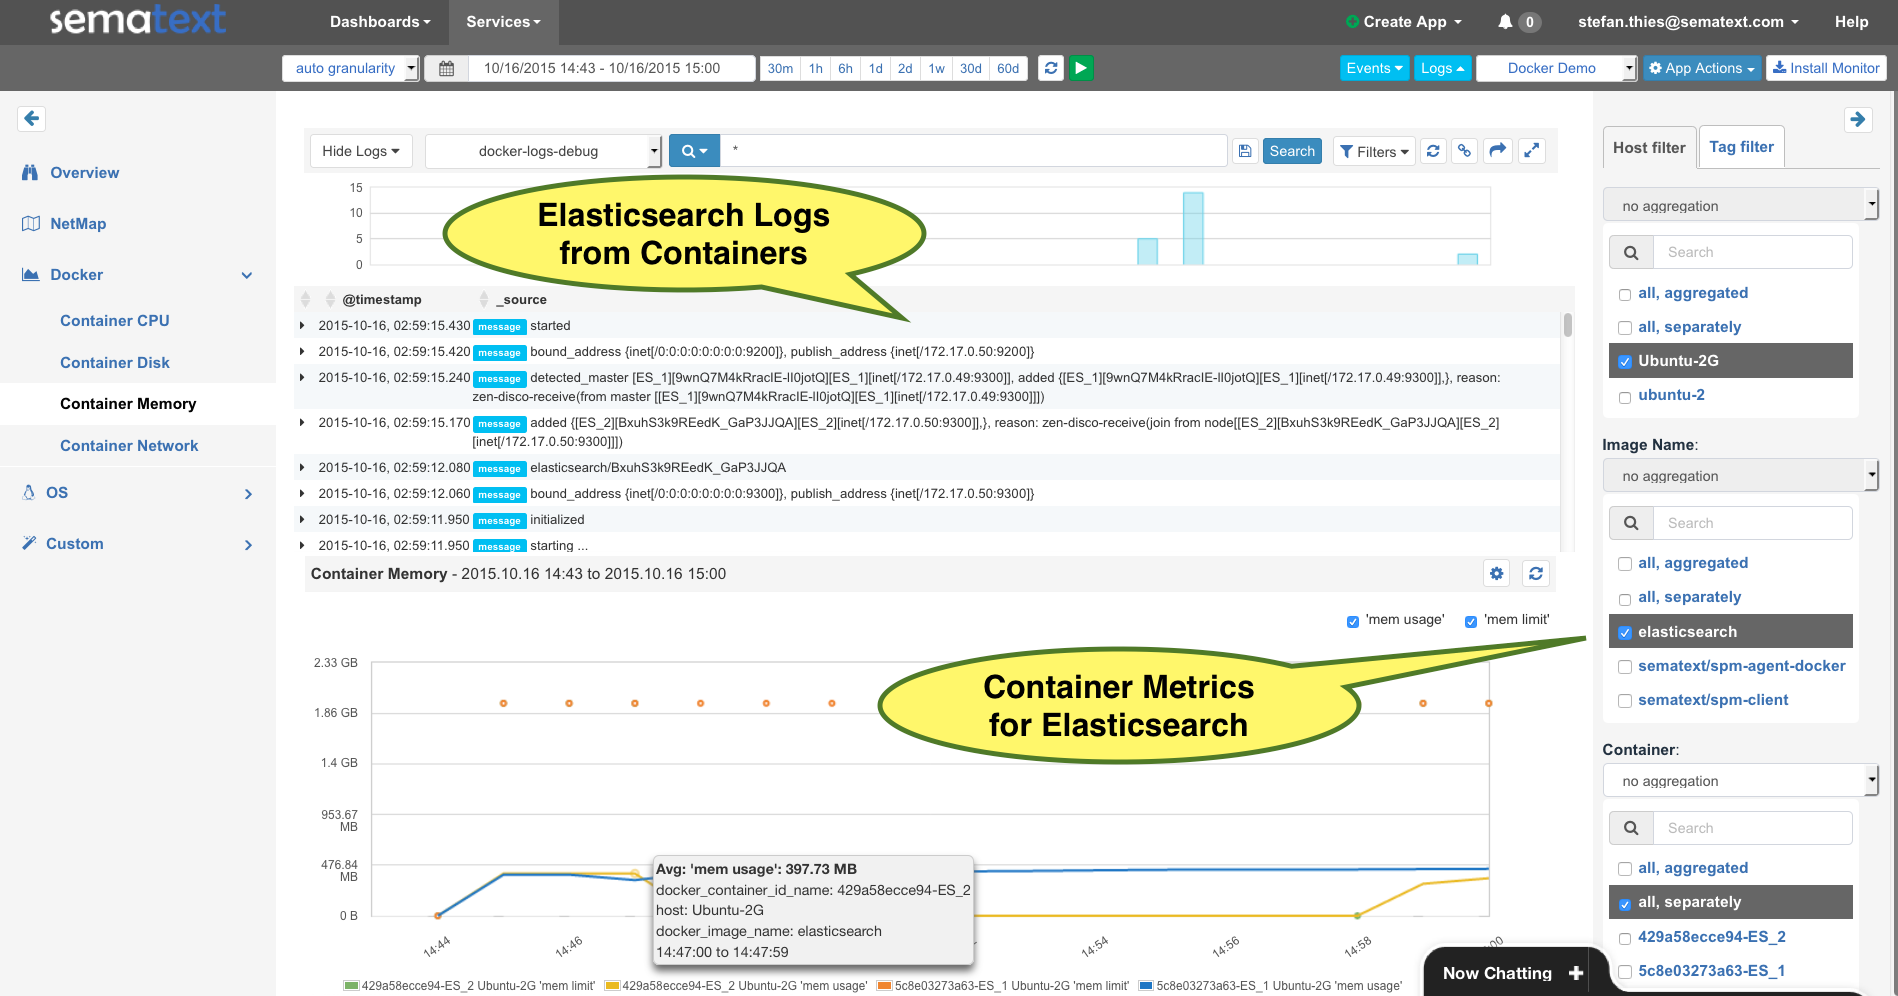 Container Logs and Metrics from Elasticsearch
Please note that logs from the containers are automatically shipped and parsed!
“Wait, there’s no setup for log shippers?” you might be saying.
That’s correct – there is NO complicated setup of syslog, Logstash, Docker log drivers, etc. It all gets done by SPM for Docker
For example, each log line has a “node_name” field for the Elasticsearch node. It takes the timestamps, severity and source from the Elasticsearch log and each log is automatically tagged with the container_id and image name. Moving from SPM Metrics to detailed Elasticsearch Logs – including Exceptions and parsed Stack Traces – is just another mouse click!
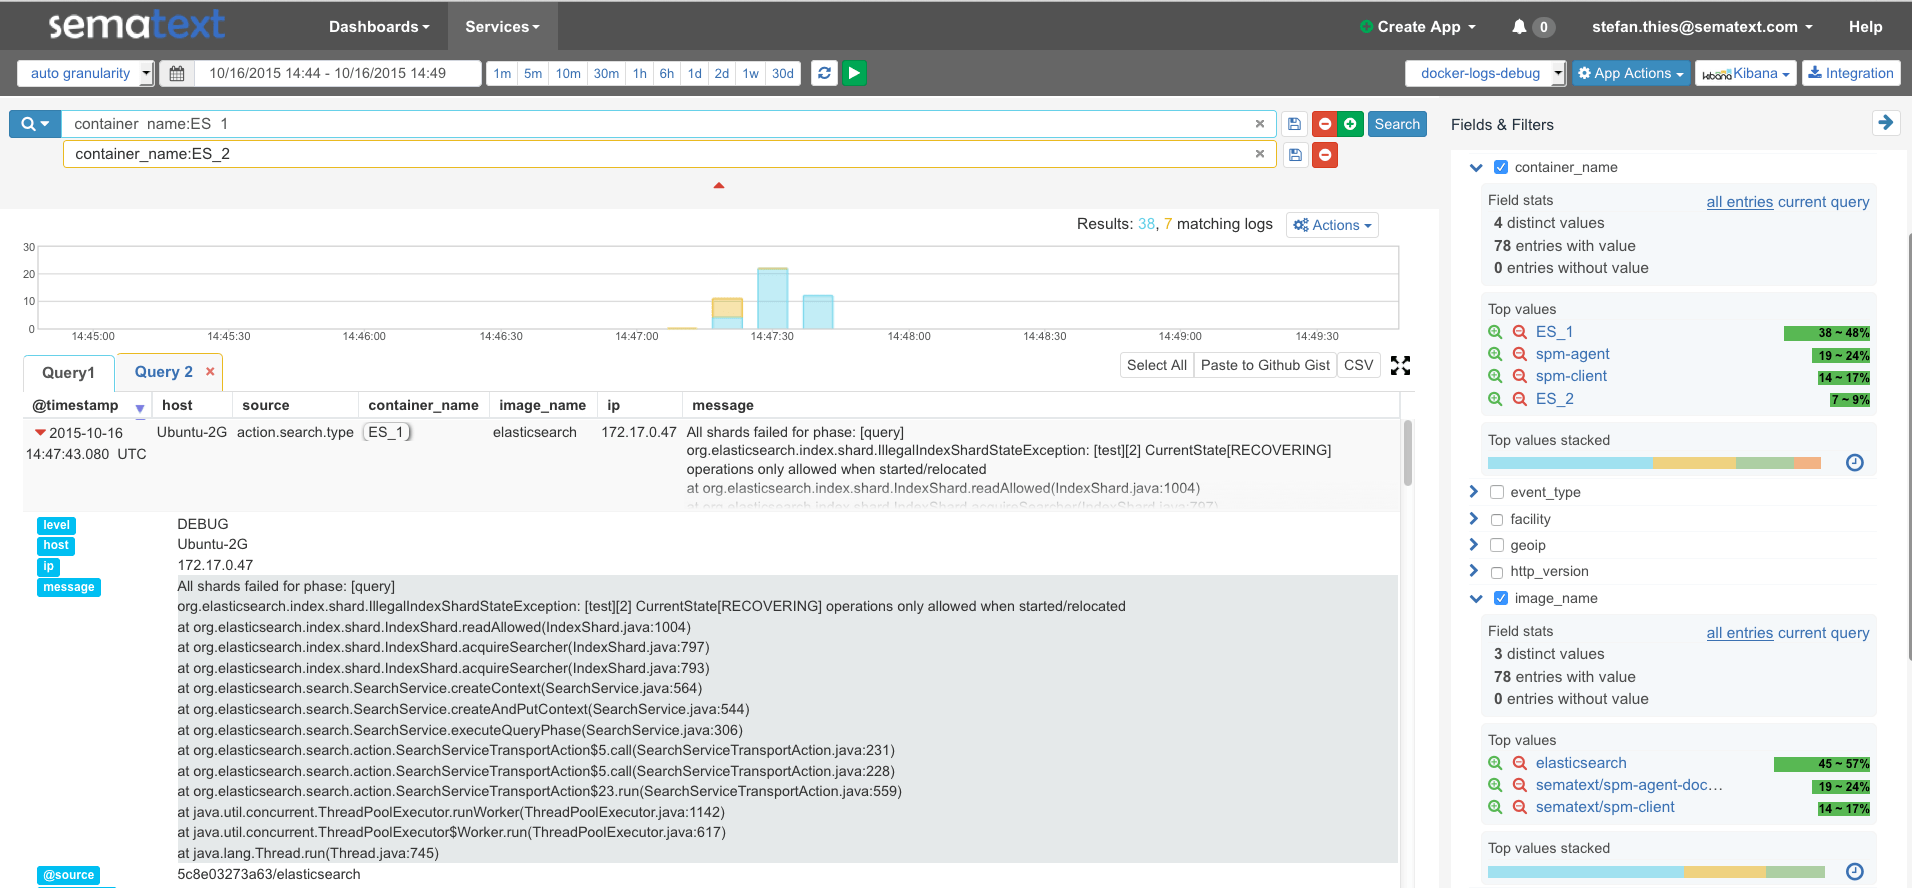
The filters by the field stats on the right side of the screen make it easy to identify containers with the most logs, by choosing “container_name”. That’s just a little detail in the Logsene UI, feel free to explore it and create Alerts or use Kibana4 Dashboards for your container logs.
If you’d like to know more about the meaning of all those Elasticsearch metrics check Top 10 Elasticsearch Metrics or the free eBook mentioned above. I believe Docker is a great platform to experiment with multiple nodes, even before you go to production.
Like what you’ve seen here? It’s super easy to get started right now with Docker and Elasticsearch monitoring (and logs!): just sign up for a free 30-day trial (no credit card required) of SPM and Logsene. Interested in monitoring other Apps on Docker with SPM? Then please contact us by email or hit us on Twitter with questions and feedback.