Over the years the adoption of Elasticsearch and its ecosystem of tools positioned them as the leaders in the time series data management and analysis market. With strong search capabilities, great analytical engine, Kibana as the flexible frontend and a number of data shippers enable building of end to end data processing pipeline using components designed to work with each other. Very simple setup and configuration resulted in high adoption rates and the whole stack gaining more and more users.
With Elasticsearch gaining in popularity, several hosted Elasticsearch services emerged on the market. Some of them, like Sematext Cloud, expose a subset of Elasticsearch API in addition to providing enterprise-grade features for users, like security, alerting and anomaly detection, reporting and so on.
With increasing adoption came increasing demands for features. People started asking for out of the box security, user management, fine-grained data access control, alerting. Elasticsearch creators listened and built the most requested features and plugins available as commercial extensions. Because commercial plugins involved expensive licenses, some of the mentioned features were also developed as add-ons by third-party developers. For example, Yelp released and maintains Elastalert, an open-sourced and free alerting system based on Elasticsearch while security-related features can be added to the stack by using Search Guard available in a free and commercial version. You can read more about free alternatives in X-Pack alternatives post.
Everything changed on March 11, 2019. Early morning Pacific time Amazon released the first public version of Open Distro for Elasticsearch. An open source, Apache 2.0-licensed distribution of Elasticsearch and Kibana that provides a number of previously commercial features out of the box and without any licensing. Those features include:
- Alerting
- Node to node encryption
- Authentication
- Role-based access control
- Index, document and field level security
- Audit logging
- Support for LDAP, Active Directory, Kerberos and SAML
- SQL support with inner, left outer and cross joins available
- JDBC driver
- Specialized performance API supporting the PerfTop command line client for real-time cluster performance analysis
While various individuals from the community already expressed their views on the move done by Amazon we decided to not do that. We could talk about how that move might affect Elastic, the user community, whether it would be good or bad, etc. Instead, we thought it would be more valuable for Elasticsearch users to know what they could expect from the Open Distro for Elasticsearch and how to work with it. So let’s dive in!
But just before we jump head first, keep in mind that if you need help at any time, Sematext offers a full range of services for Elasticsearch.
Elasticsearch & Friends
Let’s see how Open Distribution for Elasticsearch compares with various other Elasticsearch distributions and the features available out of the box. Keep in mind that this post is dedicated to the Open Distro for Elasticsearch and was not written to be a fully featured comparison between products coming from Elastic and distribution released by Amazon. We were interested in what is available as an open source Apache 2.0 licensed distributions and how it compares to the commercial products. There are multiple versions of Elastic Stack available for download from Elastic – starting from the open sourced, Apache 2.0 licensed one, through Basic – one that is free, but covered by Elastic license, ending on paid ones. Please note that some of the features mentioned in the Elastic Stack Features column are available as free extensions in the Elastic Stack Basic – those are marked with *.
| Apache 2.0 Licensed Elasticsearch | Elastic Stack Features | Open Distro for Elasticsearch | |
|---|---|---|---|
| Free | ✅ | license dependent | ✅ |
| Apache 2.0 Licensed | ✅ | ✘ | ✅ |
| Indexing | ✅ | ✅ | ✅ |
| Searching | ✅ | ✅ | ✅ |
| Aggregations | ✅ | ✅ | ✅ |
| Cross Cluster Replication | ✘ | ✅ | ✘ |
| Data rollups | ✘ | ✅ * | ✘ |
| Frozen Indices | ✘ | ✅ * | ✘ |
| Access Control | ✘ | ✅ | ✅ |
| SAML | ✘ | ✅ | ✅ |
| Encryption | ✘ | ✅ | ✅ |
| LDAP | ✘ | ✅ | ✅ |
| Active Directory | ✘ | ✅ | ✅ |
| Kerberos | ✘ | ✅ | ✅ |
| Authentication | ✘ | ✅ | ✅ |
| Graph | ✘ | ✅ | ✘ |
| Machine Learning | ✘ | ✅ | ✘ |
| SQL Support | ✘ | ✅ * | ✅ |
| JDBC | ✘ | ✅ | ✅ |
| ODBC | ✘ | ✅ | ✘ |
| Performance Analysis | ✘ | ✅ * | ✅ |
| Monitoring | ✘ | ✅ * | ✘ |
| APM | ✘ | ✅ * | ✘ |
| Additional Beats Features (i.e. central config, new modules) | ✘ | ✅ | ✘ |
| Additional Logstash Features (i.e. pipeline management) | ✘ | ✅ | ✘ |
| Canvas | ✘ | ✅ * | ✘ |
Want to learn more about Elasticsearch and the rest of the Elastic Stack? Here’s aCheat Sheet you need:
Elasticsearch DevOps Cheat Sheet
Before we continue with the more detailed description on the functionality included in the Open Distro for Elasticsearch let’s pause for a second to see how this distribution compares to others available on the market. We compared three major distributions:
- Open source, Apache 2.0 licensed Elasticsearch
- Elastic Stack Features – the commercial version of the Elastic Stack with additional functionalities
- Open Distro for Elasticsearch from Amazon AWS
As you can see from the above table each version supports the core functionality of Elasticsearch search and analytics engine – indexing data, searching data and finally the analysis of the indexed data using aggregations.
We’ll compare several free distributions of Elasticsearch with Elastic Stack Features which contain commercial extensions. There is also a commercial version of Search Guard that we cover in the X-Pack alternatives blog post, so take a look to have a more in-depth comparison.
Encryption – one of the key features when it comes to keeping your data at bay is provided by every distribution apart from the main Apache 2.0 licensed Elasticsearch. Open Disto for Elasticsearch, Search Guard and Elastic Stack Features provide SSL for a node to node encryption, support encryption at REST and have a client to node SSL support. This makes it hard or impossible to intercept communication over the network and that way get a hold of your data. The same is true for authentication – you get out of the box support for it in the mentioned distributions.
When it comes to data access control, granularity down to field level is supported only by Elastic Stack Features and Open Distro for Elasticsearch from Amazon. What’s more, the mentioned duo can be integrated with LDAP, Active Directory, Kerberos and SAML, thus providing enterprises with highly demanded features, especially for large organizations.
Graph traversal and machine learning based functionalities are at the moment only supported by the Elastic Stack Features meaning that if you require them for your operations and business you need to go for a commercial license with Elastic. The same with Kibana Canvas support, which is not present in Open Distro for Elasticsearch or any other Elasticsearch distribution. Keep in mind that graph support can be added to all the distributions by using third-party plugins as we’ve mentioned in our X-Pack alternatives blog post.
On the other hand, if you need your SQL based BI tool to be integrated with data in Elasticsearch you can freely use the two most feature-rich distributions of Elasticsearch – the one from Elastic and the one from Amazon.
Real-time performance analysis – this is where things get interesting. You have two options here, or actually even more, but one thing at the time. Elastic Stack Features includes monitoring part, which can be used for real-time performance analysis as well. It is based on the metrics returned by Elasticsearch, so if something is happening with the JVM on which Elasticsearch is running you may not be able to get the metrics. In addition to that, keeping metrics data in the same cluster as your business data is usually not a good idea and you should have two clusters, just in case you need to troubleshoot. The Open Distro comes with the PerfTop tool, which is not bound to the same JVM and is exposed on a separate port allowing you to see real-time performance data. However, keep in mind that you won’t be able to see the historic view with Open Distro. Because of that and a number of other reasons, it’s a good idea to ship monitoring data out and use tools like Sematext Cloud to monitor Elasticsearch and your other infrastructure. Remember – you can’t fix what you can’t measure!
Open Distro for Elasticsearch Installation
The Open Distro for Elasticsearch is available as an RPM or as a Docker container. What’s more, because of out-of-the-box security there are some things that are different, but let’s keep it simple and discuss one thing at a time.
Running a Single Node Cluster
Of course, the simplest solution is running a single node cluster. This is suitable for local development or small test cluster at most. Because of its simple responsibilities, it is very easy to run – just run the following command assuming that you have your Docker engine working:
$ docker run -p 9200:9200 -p 9600:9600 -e "discovery.type=single-node" amazon/opendistro-for-elasticsearch:0.7.0
In the console you should see additional security related information and modules being loaded by Elasticsearch:
[2019-03-15T11:32:23,001][INFO ][c.a.o.s.s.DefaultOpenDistroSecurityKeyStore] [ut1q6v6] JVM supports TLSv1.3
[2019-03-15T11:32:23,001][INFO ][c.a.o.s.s.DefaultOpenDistroSecurityKeyStore] [ut1q6v6] Config directory is /usr/share/elasticsearch/config/, from there the key- and truststore files are resolved relatively
[2019-03-15T11:32:23,400][INFO ][c.a.o.s.s.DefaultOpenDistroSecurityKeyStore] [ut1q6v6] TLS Transport Client Provider : JDK
[2019-03-15T11:32:23,401][INFO ][c.a.o.s.s.DefaultOpenDistroSecurityKeyStore] [ut1q6v6] TLS Transport Server Provider : JDK
[2019-03-15T11:32:23,401][INFO ][c.a.o.s.s.DefaultOpenDistroSecurityKeyStore] [ut1q6v6] TLS HTTP Provider             : JDK
[2019-03-15T11:32:23,401][INFO ][c.a.o.s.s.DefaultOpenDistroSecurityKeyStore] [ut1q6v6] Enabled TLS protocols for transport layer : [TLSv1.3, TLSv1.2, TLSv1.1]
[2019-03-15T11:32:23,401][INFO ][c.a.o.s.s.DefaultOpenDistroSecurityKeyStore] [ut1q6v6] Enabled TLS protocols for HTTP layer      : [TLSv1.3, TLSv1.2, TLSv1.1]
[2019-03-15T11:32:23,645][INFO ][c.a.o.s.OpenDistroSecurityPlugin] [ut1q6v6] Clustername: docker-cluster
[2019-03-15T11:32:23,766][WARN ][c.a.o.s.OpenDistroSecurityPlugin] [ut1q6v6] Directory /usr/share/elasticsearch/config has insecure file permissions (should be 0700)
[2019-03-15T11:32:23,766][WARN ][c.a.o.s.OpenDistroSecurityPlugin] [ut1q6v6] File /usr/share/elasticsearch/config/elasticsearch.yml has insecure file permissions (should be 0600)
[2019-03-15T11:32:23,766][WARN ][c.a.o.s.OpenDistroSecurityPlugin] [ut1q6v6] File /usr/share/elasticsearch/config/log4j2.properties has insecure file permissions (should be 0600)
[2019-03-15T11:32:23,766][WARN ][c.a.o.s.OpenDistroSecurityPlugin] [ut1q6v6] File /usr/share/elasticsearch/config/kirk.pem has insecure file permissions (should be 0600)
[2019-03-15T11:32:23,766][WARN ][c.a.o.s.OpenDistroSecurityPlugin] [ut1q6v6] File /usr/share/elasticsearch/config/esnode.pem has insecure file permissions (should be 0600)
[2019-03-15T11:32:23,766][WARN ][c.a.o.s.OpenDistroSecurityPlugin] [ut1q6v6] File /usr/share/elasticsearch/config/root-ca.pem has insecure file permissions (should be 0600)
[2019-03-15T11:32:23,766][WARN ][c.a.o.s.OpenDistroSecurityPlugin] [ut1q6v6] File /usr/share/elasticsearch/config/esnode-key.pem has insecure file permissions (should be 0600)
[2019-03-15T11:32:23,766][WARN ][c.a.o.s.OpenDistroSecurityPlugin] [ut1q6v6] File /usr/share/elasticsearch/config/kirk-key.pem has insecure file permissions (should be 0600)
[2019-03-15T11:32:23,918][INFO ][o.e.p.PluginsService     ] [ut1q6v6] loaded module [aggs-matrix-stats]
[2019-03-15T11:32:23,918][INFO ][o.e.p.PluginsService     ] [ut1q6v6] loaded module [analysis-common]
[2019-03-15T11:32:23,918][INFO ][o.e.p.PluginsService     ] [ut1q6v6] loaded module [ingest-common]
[2019-03-15T11:32:23,918][INFO ][o.e.p.PluginsService     ] [ut1q6v6] loaded module [lang-expression]
[2019-03-15T11:32:23,919][INFO ][o.e.p.PluginsService     ] [ut1q6v6] loaded module [lang-mustache]
[2019-03-15T11:32:23,919][INFO ][o.e.p.PluginsService     ] [ut1q6v6] loaded module [lang-painless]
[2019-03-15T11:32:23,919][INFO ][o.e.p.PluginsService     ] [ut1q6v6] loaded module [mapper-extras]
[2019-03-15T11:32:23,919][INFO ][o.e.p.PluginsService     ] [ut1q6v6] loaded module [parent-join]
[2019-03-15T11:32:23,919][INFO ][o.e.p.PluginsService     ] [ut1q6v6] loaded module [percolator]
[2019-03-15T11:32:23,919][INFO ][o.e.p.PluginsService     ] [ut1q6v6] loaded module [rank-eval]
[2019-03-15T11:32:23,919][INFO ][o.e.p.PluginsService     ] [ut1q6v6] loaded module [reindex]
[2019-03-15T11:32:23,919][INFO ][o.e.p.PluginsService     ] [ut1q6v6] loaded module [repository-url]
[2019-03-15T11:32:23,919][INFO ][o.e.p.PluginsService     ] [ut1q6v6] loaded module [transport-netty4]
[2019-03-15T11:32:23,919][INFO ][o.e.p.PluginsService     ] [ut1q6v6] loaded module [tribe]
[2019-03-15T11:32:23,919][INFO ][o.e.p.PluginsService     ] [ut1q6v6] loaded plugin [opendistro_alerting]
[2019-03-15T11:32:23,919][INFO ][o.e.p.PluginsService     ] [ut1q6v6] loaded plugin [opendistro_performance_analyzer]
[2019-03-15T11:32:23,919][INFO ][o.e.p.PluginsService     ] [ut1q6v6] loaded plugin [opendistro_security]
[2019-03-15T11:32:23,919][INFO ][o.e.p.PluginsService     ] [ut1q6v6] loaded plugin [opendistro_sql]
As in the above case, you may see warnings related to permissions of certificate files. This is OK for development but should be taken care of before running Open Distro for Elasticsearch in the production environment. This is important and you shouldn’t forget about that.
By default, our command will expose two ports from the container – the 9200 and 9600. The is the usual port you would use for running your queries and indexing. For example:
$ curl -k -u admin:admin -XGET https://localhost:9200
You may notice two things here. First of all, we provided the -k switch to the curl command, which means that we accept that the certificate may not be secure – again, nothing to worry about in the development environment. The second is the user and password that will be used for accessing Elasticsearch. This is needed because of the security features of Open Distro for Elasticsearch. If we skip that and just run:
$ curl -k -XGET https://localhost:9200
In response we will see:
Unauthorized
The second port – 9600 is a new port when it comes to Elasticsearch. It exposes the metrics API that comes with Amazon distribution and is needed for the PerfTop tool to work. We cover the capabilities of the PerfTop later in this blog post.
Configuring Elasticsearch
Even for local development, we will need to adjust the configuration at a certain point. The good thing is that most of the operations needed by the developers can be done using the well-known Elasticsearch API. Thus, there are no problems with creating templates, adding aliases, creating indices and so on – all Elasticsearch APIs you normally use will work with Open Distro for Elasticsearch as well. The only thing you need to remember is to pass the user and password for each command.
To configure Elasticsearch we need to provide it with a modified elasticsearch.yml file. We do that by using the -v switch and providing the full path to the file. For example, if we wanted to point the container to a file that is located in /etc/elasticsearch we would run the following command:
$ docker run -p 9200:9200 -p 9600:9600 -e "discovery.type=single-node" -v /etc/elasticsearch/elasticsearch.yml amazon/opendistro-for-elasticsearch:0.7.0
Setting up Elasticsearch Cluster Using Docker Compose
Setting up a cluster using Open Distro for Elasticsearch is easily done using the Docker compose file. Let’s try doing that for a cluster containing four small Elasticsearch nodes and Kibana, all coming from the Amazon distribution. To do that we will need to define a few things:
- Creating a new cluster, we will call it sematext-test-cluster
- Creating four Elasticsearch nodes, we will call them sematext-test-node1 – node4
- Creating one Kibana node, we will call it kibana
- Create four volumes, we will call them sematext-test-data1 – data4
- Create a network for all the containers to communicate
- Configure each container to point to proper cluster, use a proper network and volume, have a unique node name
- Point all Elasticsearch nodes apart from the first to point its discovery module to the first node
- Expose ports 9200 and 9600 on one of the Elasticsearch nodes for external communication
- Point Kibana to one of the Elasticsearch nodes in our cluster
- Export 5601 port for Kibana communication
For the purpose of the test we’ll omit a certain number of configuration options so that the presented file is smaller but still works.
The final docker-compose.yml file looks as follows:
version: '3'
services:
  sematext-test-node1:
    image: amazon/opendistro-for-elasticsearch:0.7.0
    container_name: sematext-test-node1
    environment:
      - cluster.name=sematext-test-cluster
      - bootstrap.memory_lock=true
      - "ES_JAVA_OPTS=-Xms256m -Xmx256m"
    ulimits:
      memlock:
        soft: -1
        hard: -1
    volumes:
      - sematext-test-data1:/usr/share/elasticsearch/data
    ports:
      - 9200:9200
      - 9600:9600
    networks:
      - sematext-test-net
  sematext-test-node2:
    image: amazon/opendistro-for-elasticsearch:0.7.0
    container_name: sematext-test-node2
    environment:
      - cluster.name=sematext-test-cluster
      - bootstrap.memory_lock=true
      - "ES_JAVA_OPTS=-Xms256m -Xmx256m"
      - discovery.zen.ping.unicast.hosts=sematext-test-node1
    ulimits:
      memlock:
        soft: -1
        hard: -1
    volumes:
      - sematext-test-data2:/usr/share/elasticsearch/data
    networks:
      - sematext-test-net
  sematext-test-node3:
    image: amazon/opendistro-for-elasticsearch:0.7.0
    container_name: sematext-test-node3
    environment:
      - cluster.name=sematext-test-cluster
      - bootstrap.memory_lock=true
      - "ES_JAVA_OPTS=-Xms256m -Xmx256m"
      - discovery.zen.ping.unicast.hosts=sematext-test-node1
    ulimits:
      memlock:
        soft: -1
        hard: -1
    volumes:
      - sematext-test-data3:/usr/share/elasticsearch/data
    networks:
      - sematext-test-net
  sematext-test-node4:
    image: amazon/opendistro-for-elasticsearch:0.7.0
    container_name: sematext-test-node4
    environment:
      - cluster.name=sematext-test-cluster
      - bootstrap.memory_lock=true
      - "ES_JAVA_OPTS=-Xms256m -Xmx256m"
      - discovery.zen.ping.unicast.hosts=sematext-test-node1
    ulimits:
      memlock:
        soft: -1
        hard: -1
    volumes:
      - sematext-test-data4:/usr/share/elasticsearch/data
    networks:
      - sematext-test-net
  kibana:
    image: amazon/opendistro-for-elasticsearch-kibana:0.7.0
    container_name: sematext-test-kibana
    ports:
      - 5601:5601
    expose:
      - "5601"
    environment:
      ELASTICSEARCH_URL: https://sematext-test-node1:9200
    networks:
      - sematext-test-net

volumes:
  sematext-test-data1:
  sematext-test-data2:
  sematext-test-data3:
  sematext-test-data4:

networks:
  sematext-test-net:
We start the whole stack by running docker-compose up command in the directory with our newly created docker-compose.yml file. If you don’t have docker-compose setup and ready, please refer to https://docs.docker.com/compose/install/ for installation details for your operating system. Also, please in mind that you need at least 4GB of memory to run the above example with docker compose. You will also be required to set the vm.max_map_count to a value higher than the default, e.g. to 262144.
Once everything is started, you can go to localhost:5601 to see your secured Kibana interface. You can log in with admin/admin credentials.
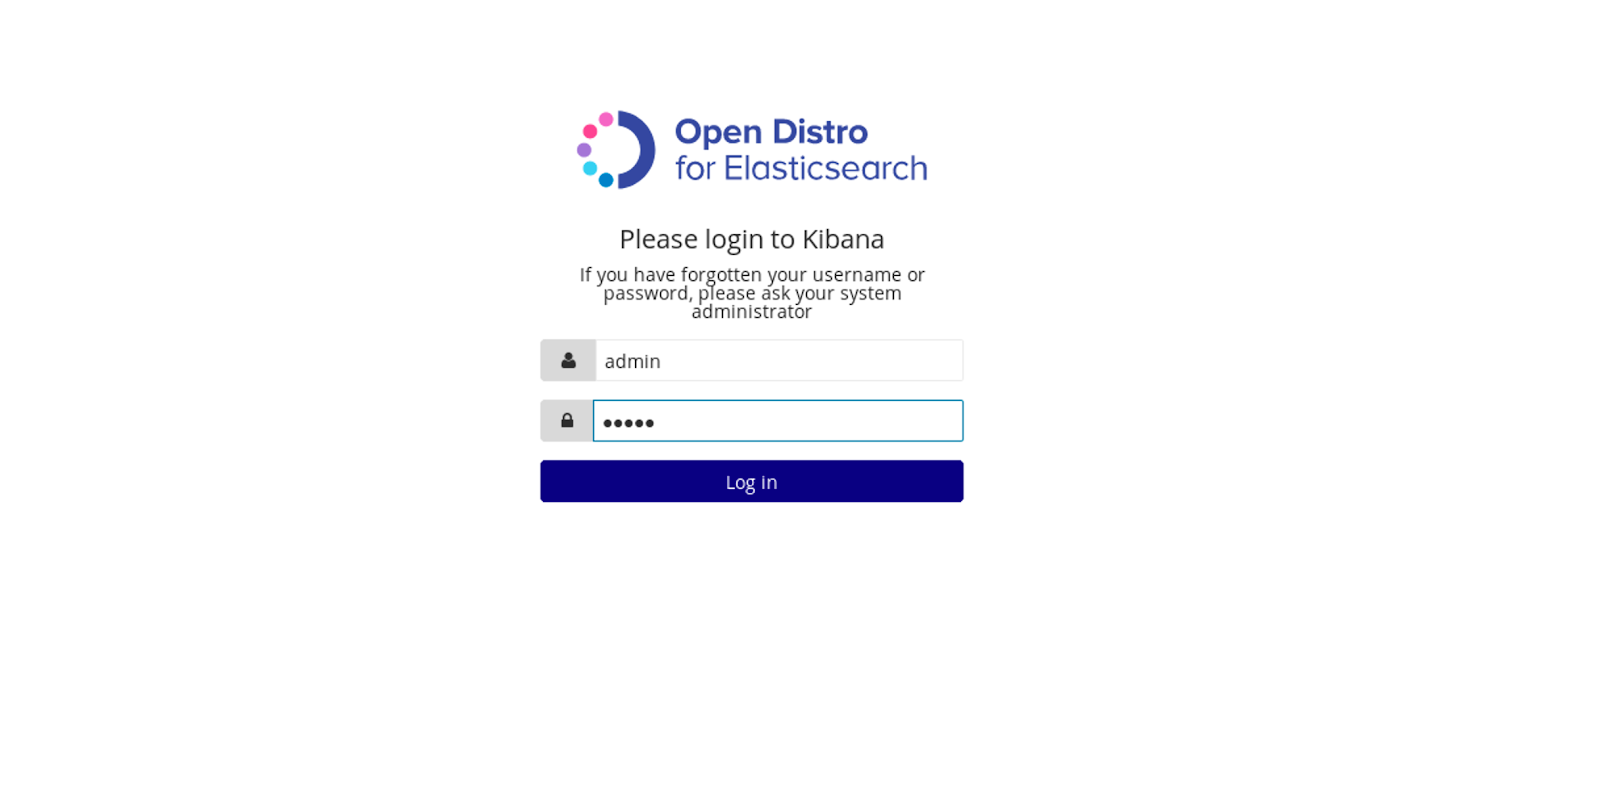
After logging in you will be shown the full Kibana UI with features like security and tenants management:
Elasticsearch Alerting
When you install and run the Open Distro for Elasticsearch from Amazon, both the Elasticsearch and provided Kibana you get out of the box alerting functionality. You can configure and run alerts against data that is indexed inside your cluster. There is a set of features available – we are allowed to define monitors based on queries and the charts built out of data, we can configure destinations like Slack channel, Chime, or custom webhook. We get a view of the alerts, we can acknowledge them, look into their details. The nice thing about Alerting functionality is that it doesn’t require additional software, cron jobs, etc.. Everything is done internally so we only have to worry about the Open Distro for Elasticsearch being up and running.
To create a new alert we start with creating and defining a monitor:
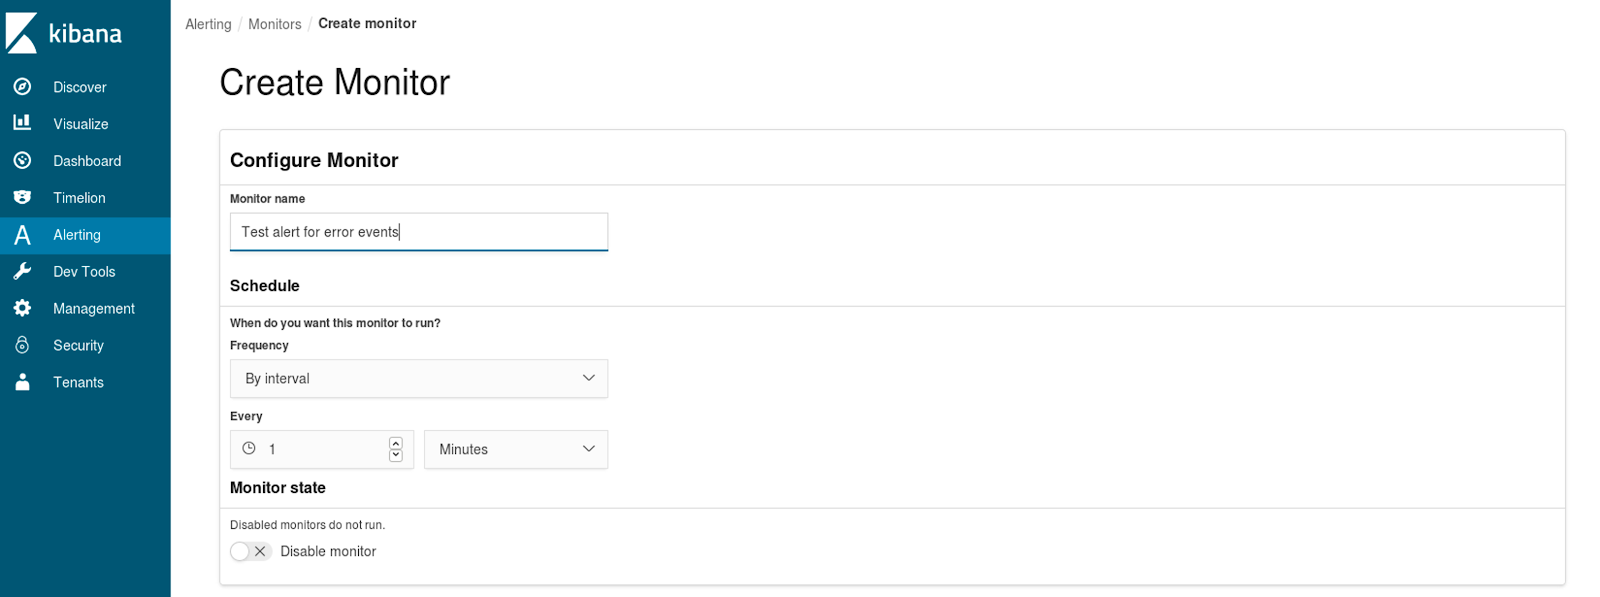
We provide the name of the monitor, its schedule and the source of data:
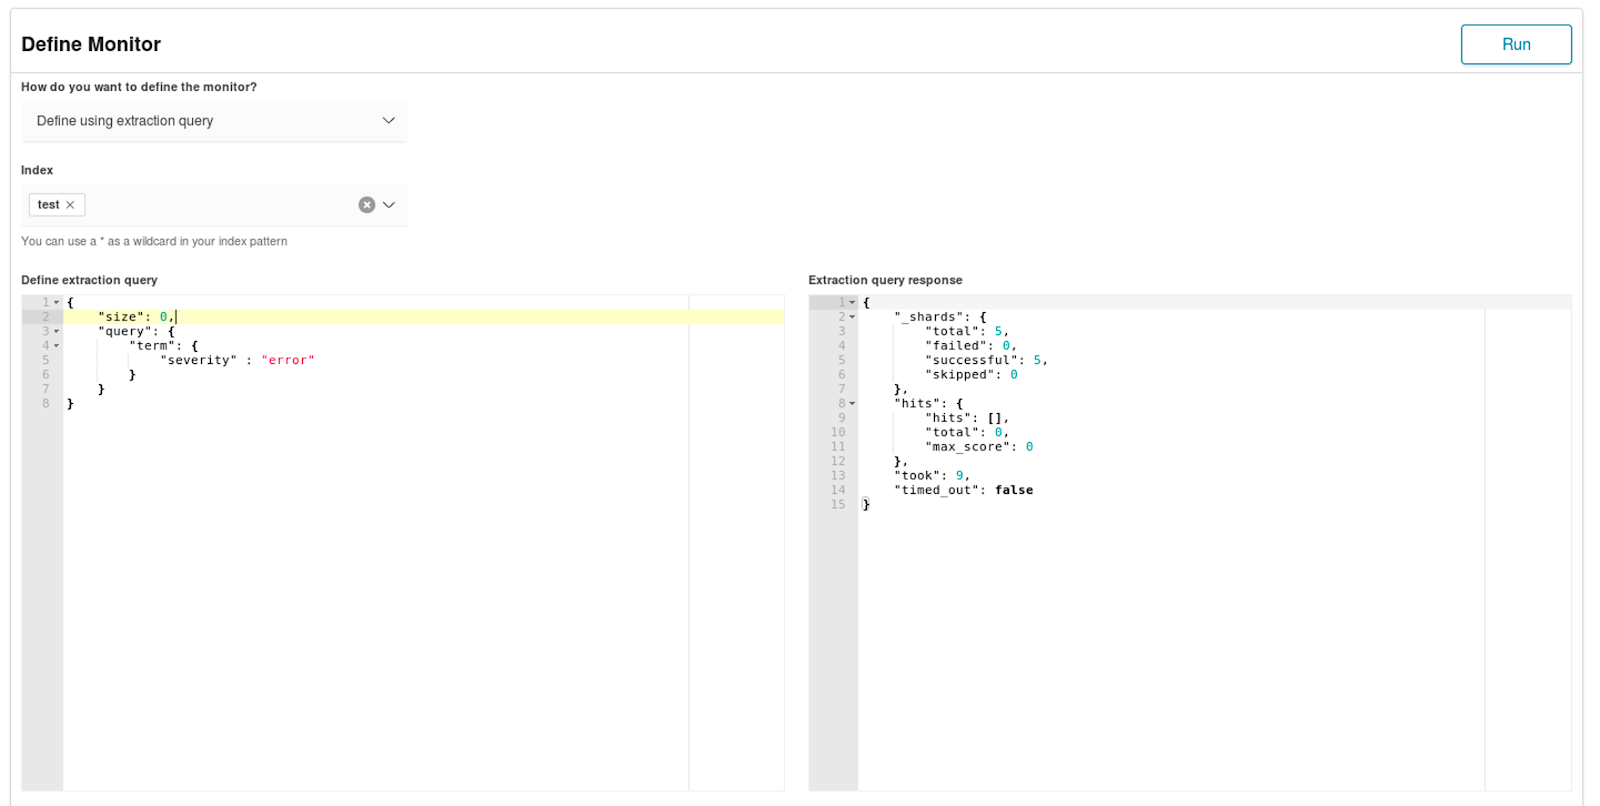
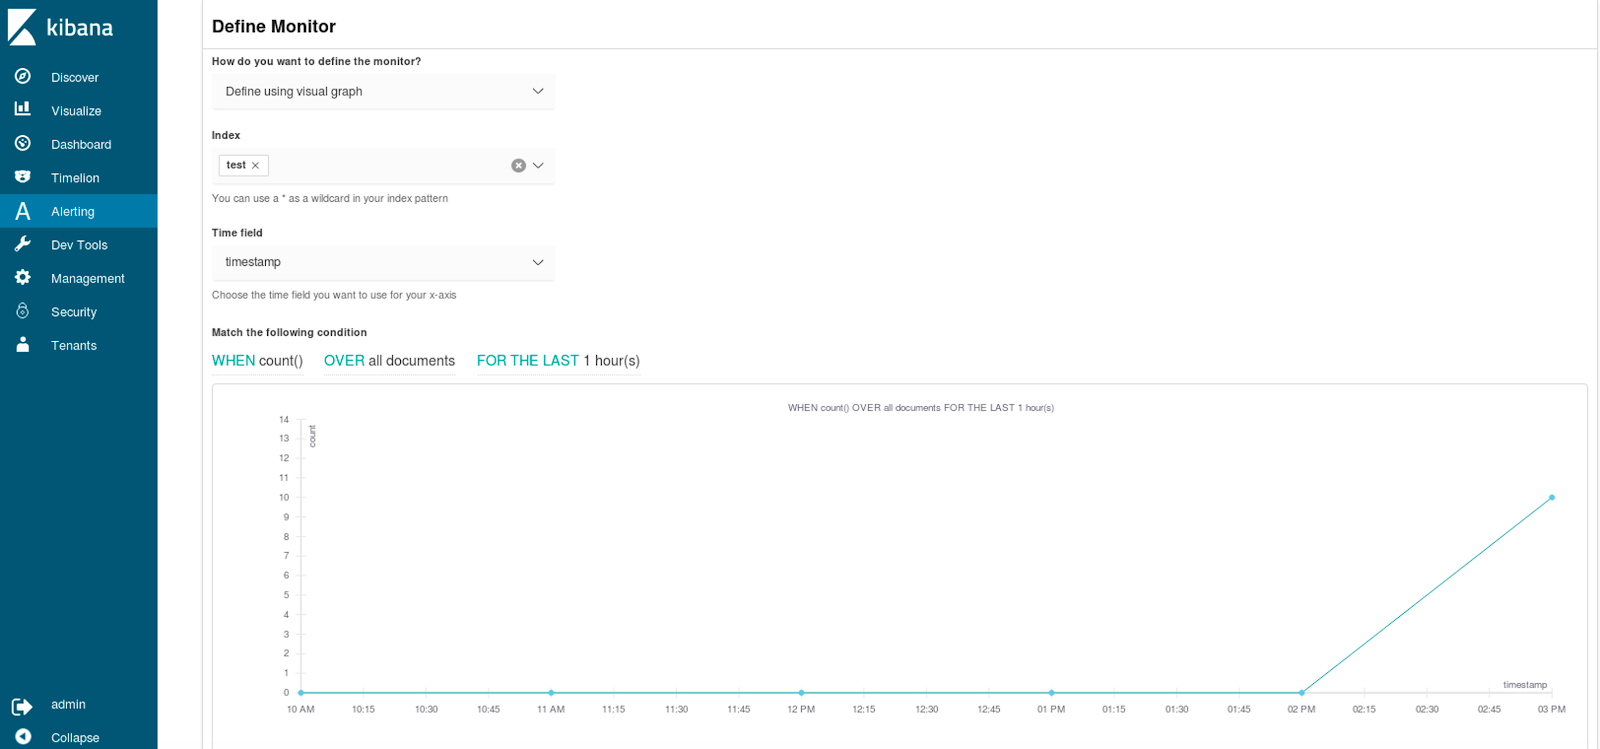
As you can see both query based monitor and chart based monitor setup can be performed. This allows both less and more experienced users to create alerts based on data, so for example users that do not know the Elasticsearch API are able to create alerts.
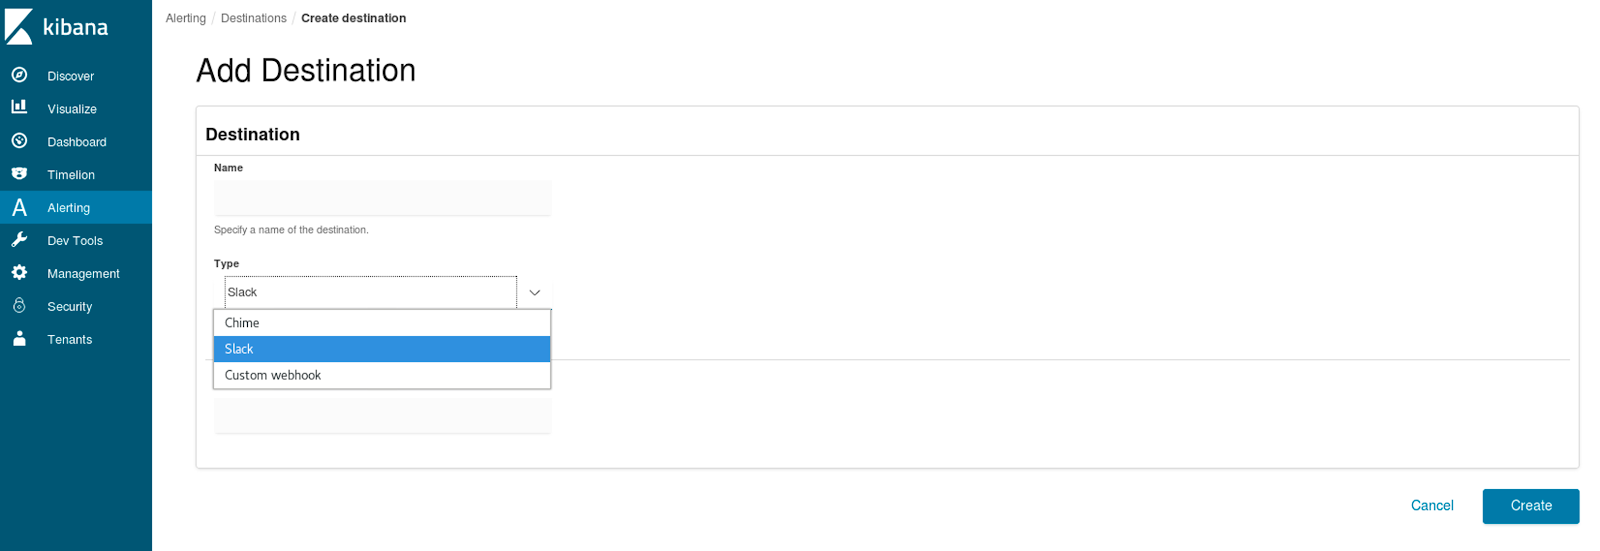
By default the alerts data will be displayed in Kibana UI, but we can also set up destinations and assign them to our monitors so that the alert is reported elsewhere – e.g. to our organization’s Slack channel:
For alerts to work we need to create triggers to which we can assign the earlier defined destinations and finally have full alerting working.
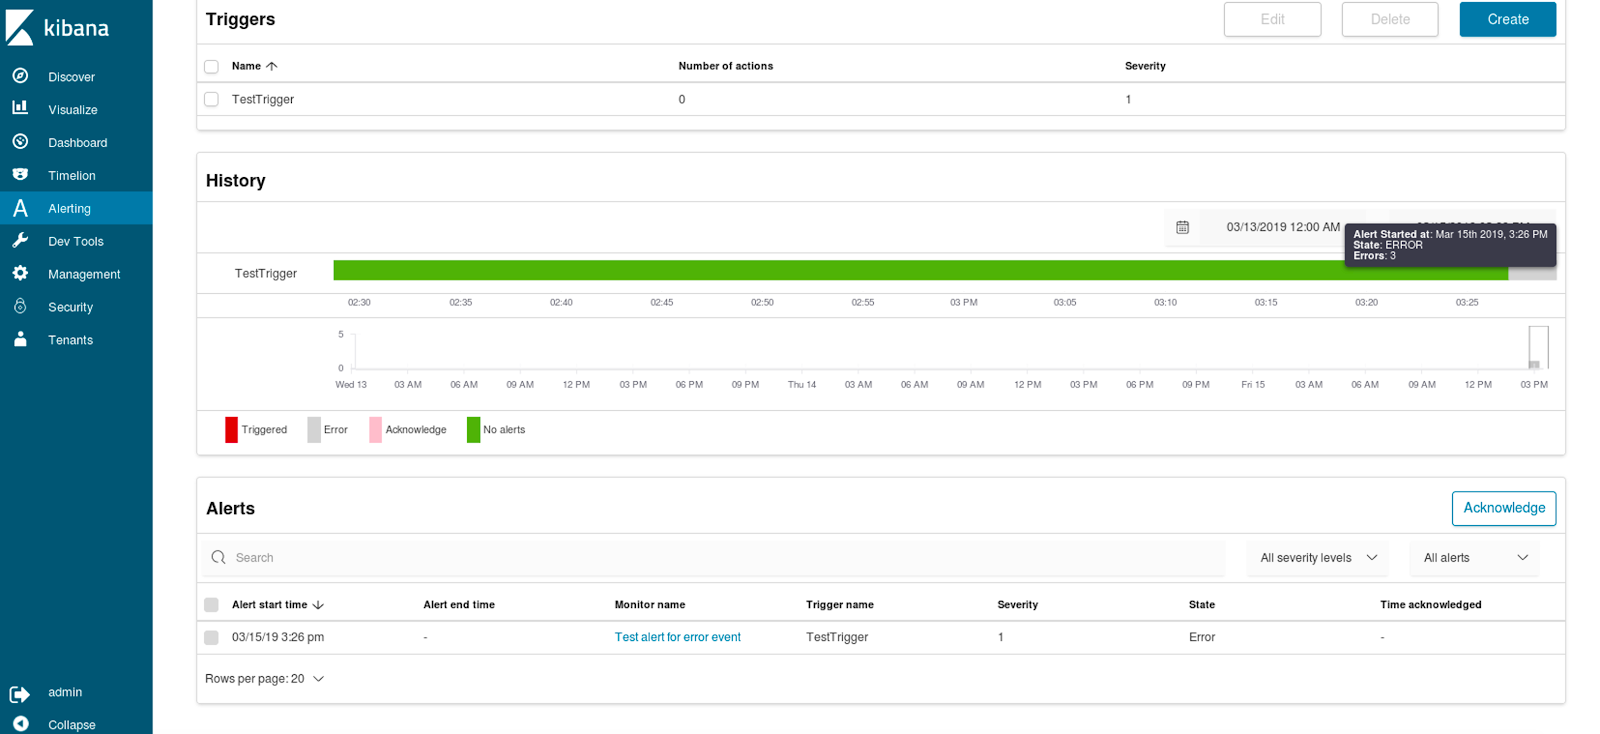
To sum up – very nice functionality allowing us to define a set of alerts to monitor events that are of interest for us, have them in a single place, visualized and accessible for both experienced and novice users. In a larger team, the alerts can be acknowledged so that multiple people are not working on the same issue reported by the alert. On the other hand, we don’t have any kind of anomaly detection algorithms that would react automatically to changing environment, but maybe we will see machine learning based alerts with the later versions of the Open Distro for Elasticsearch. Please note that Alerting bundled into Open Distribution for Elasticsearch are not alerts for monitoring Elasticsearch cluster health and performance itself. For that, you will still want to use something like Sematext Alerts or some other alternative.
Elasticsearch Security
One of the key pieces of functionality that are delivered with Open Distro for Elasticsearch by Amazon is security. Out of the box, you get secured Elasticsearch and Kibana with authentication and authorization support, encryption and so on. No more unsecured clusters that people can get into only if the Elasticsearch port is exposed to the internet. Of course, we need to set it up and configure it properly, but it is a huge difference between the wide open default in the free Elasticsearch from Elastic and the one published by Amazon in the Open Distro for Elasticsearch.
Elasticsearch Encryption
Let’s start by looking at options for data encryption – both encryption of data at rest and encryption of data in transit. We already discussed some of those topics in our Elasticsearch security: Authentication, Encryption, Backup blog post, but this time we will look into what the Open Distro for Elasticsearch provides.
Elasticsearch Encryption at Rest
The node to node and node to external client communication is not everything. Your data is still vulnerable when it’s stored on disk. For more secure operations Open Distro for Elasticsearch supports encryption of data at rest, which will be handled by your operating system – in most cases Linux distribution. Setting it up is easy and you should take care of that when running Amazon distribution of Elasticsearch in production. Simply run:
$ cryptsetup luksFormat --key-file <key> <partition>
Provide your key and partition and you’ll be good to go!
Certificates Configuration
In addition to providing the encryption of data at rest Amazon Open Distro for Elasticsearch supports node to node communication encryption, as well as node to client communication encryption. Both are set the same way – in elasticsearch.yml file for each node. The default configuration shipped with Amazon distribution contains the following configuration snippet:
opendistro_security.ssl.transport.pemcert_filepath: esnode.pem
opendistro_security.ssl.transport.pemkey_filepath: esnode-key.pem
opendistro_security.ssl.transport.pemtrustedcas_filepath: root-ca.pem
opendistro_security.ssl.transport.enforce_hostname_verification: false
opendistro_security.ssl.http.enabled: true
opendistro_security.ssl.http.pemcert_filepath: esnode.pem
opendistro_security.ssl.http.pemkey_filepath: esnode-key.pem
opendistro_security.ssl.http.pemtrustedcas_filepath: root-ca.pem
opendistro_security.allow_unsafe_democertificates: true
opendistro_security.allow_default_init_securityindex: true
opendistro_security.authcz.admin_dn:
  - CN=kirk,OU=client,O=client,L=test, C=de

opendistro_security.enable_snapshot_restore_privilege: true
opendistro_security.check_snapshot_restore_write_privileges: true
opendistro_security.restapi.roles_enabled: ["all_access", "security_rest_api_access"]
This lets you set SSL certificate and the configuration related to SSL as well as the internal audit logging of Elasticsearch. It also configures the Snapshot/Restore API privileges and the security roles that are enabled by default giving us a full set of options on how we want the nodes and cluster itself to be secured and run.
Elasticsearch Audit Logging
Many of the enterprise applications require an audit log to be present. There are certain requirements for organizations to be able to tell how their users interact with the system. The Open Distro for Elasticsearch comes with an out of the box audit log functionality that can be turned on by adding the following line to the elasticsearch.yml:
opendistro_security.audit.type: internal_elasticsearch
There are multiple type of storage that we can set for storing the audit log data:
- internal_elasticsearch – stores the data in the same Elasticsearch cluster. While this is simple, you probably don’t want to store sensitive audit log data on the same cluster that the audit log is for.
- external_elasticsearch – stores the data in an external Elasticsearch cluster, or even a hosted Elasticsearch service.
- debug – prints the data to the console, useful for testing and debugging
- webhook – sends the audit log events to a defined webhook
- log4j – stores the data using Log4j and its appenders
Open Distro for Elasticsearch and its security module by default store the following security-related events:
- Failed login
- Successful login
- Missing privileges to run a certain request
- Granted privileges to run a certain request
- SSL/TLS error when Elasticsearch was contacted but there was no certificate or the provided certificate was incorrect
- Attempt to alter the configuration of the internal security module without required privileges
- Attempt to interact with Elasticsearch without security headers
Of course, everything is configurable and we can exclude categories, disable audit logging for REST API layer, choose for which indices the audit log should be written, which request should be ignored by the audit logging, which users should be ignored by the audit log and we can modify the default daily audit log index rollover policy.
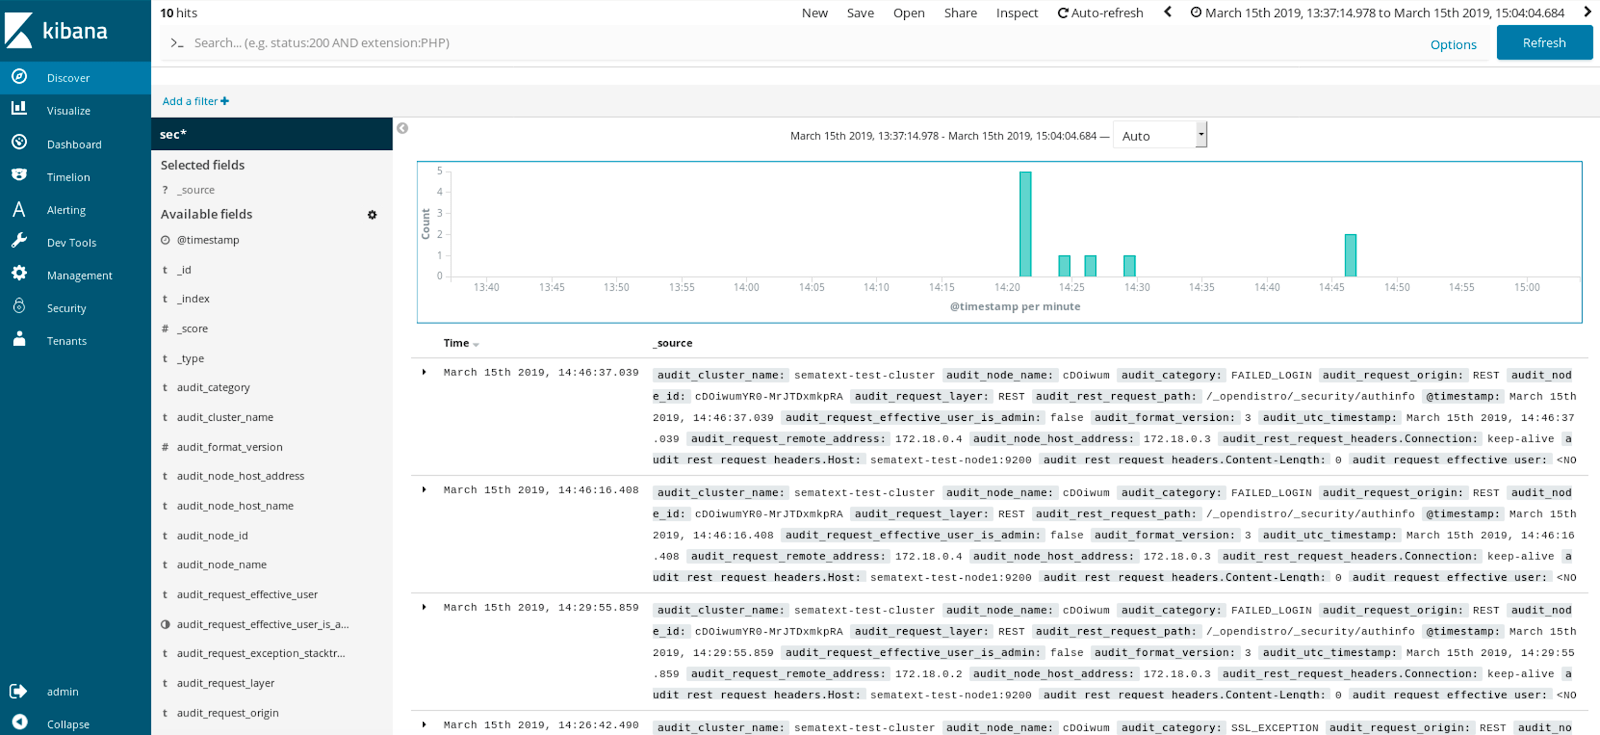
For the audit logs, we don’t have a dedicated section in the UI, but we have to remember that we are inside Kibana. We can easily slice and dice the data if it is inside Elasticsearch. So with some one-time effort, we can build dashboards that give us data that we need to look into.
Authentication & Authorization – LDAP, Active Directory, SAML
The Open Distro for Elasticsearch comes with a number of integrations for authentication and authorization. The LDAP and Active Directory can be configured to work for both, so we can use our already present user databases to integrate seamlessly with the Amazon distribution of Elasticsearch. We can control LDAP user attributes, exclude users from the lookup, use TLS and so one. To use all of that we need to configure the opendistro_security plugin, whose configuration is located in plugins/opendistro_security/securityconfig/config.yml and could look like this:
ldap:
  enabled: true
  order: 1
  http_authenticator:
    type: basic
    challenge: true
  authentication_backend:
    type: ldap
    config:
      enable_ssl: true
      enable_start_tls: false
      enable_ssl_client_auth: false
      verify_hostnames: true
      hosts:
        - ldap.example.com:636
      bind_dn: cn=admin,dc=sematext,dc=com
      password: myspecialpassword
      userbase: 'ou=people,dc=sematext,dc=com'
      usersearch: '(sAMAccountName={0})'
      username_attribute: uid
On top of all of that, we are allowed to use single sign-on using SAML. The Open Distro Security plugin implements the web browser SSO profile of the SAML 2.0 protocol. Keep in mind that this is not a general purpose single sign-on functionality. It is specifically designed for use in web browsers. It’s main goal is to support logging into Kibana interface.
The minimal configuration of the Security plugin might look as follows:
authc:
  saml:
    enabled: true
    order: 1
    http_authenticator:
      type: saml
      challenge: true
      config:
        idp:
          metadata_file: metadata.xml
          entity_id: http://idp.sematext.com/
        sp:
          entity_id: https://kibana.sematext.com
        kibana_url: https://kibana.sematext.com:5601/
        roles_key: Role
        exchange_key: 'djsah3y^BD#vd28vx723vy'
    authentication_backend:
      type: noop
For SAML to work we need to enable it on the Kibana side, which means that we need to adjust the kibana.yml file and add the following:
opendistro_security.auth.type: "saml"
server.xsrf.whitelist: ["/opendistro_security/saml/acs"]
server.xsrf.whitelist: ["/opendistro_security/saml/acs", "/opendistro_security/saml/logout"]
The first line specifies the authorization type. The next two lines add validation for SAML assertions. The last line is only needed if you want to support logout endpoint.
To learn more about Elasticsearch Authentication and Authorization check out the official Open Distro for Elasticsearch security documentation.
Access Control
Data access control is the last aspect of Elasticsearch security we’ll cover in this post.
Users
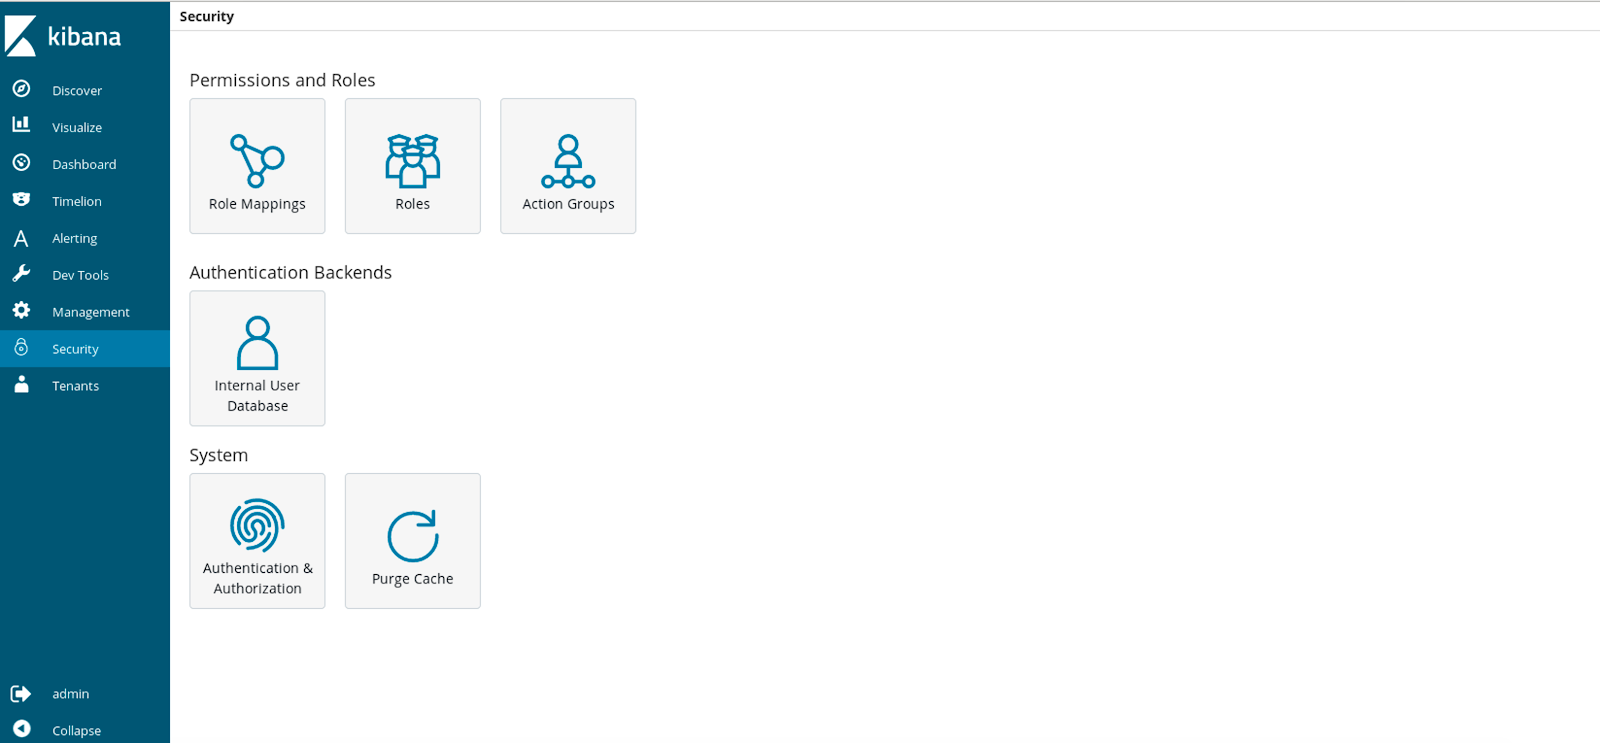
Depending on our configuration, especially when not using LDAP or Active Directory, we can configure the list of users and user groups with access to our Elasticsearch environment. We do that by going to the Security tab in Kibana and its Internal User Database. There we can see users and manage them.
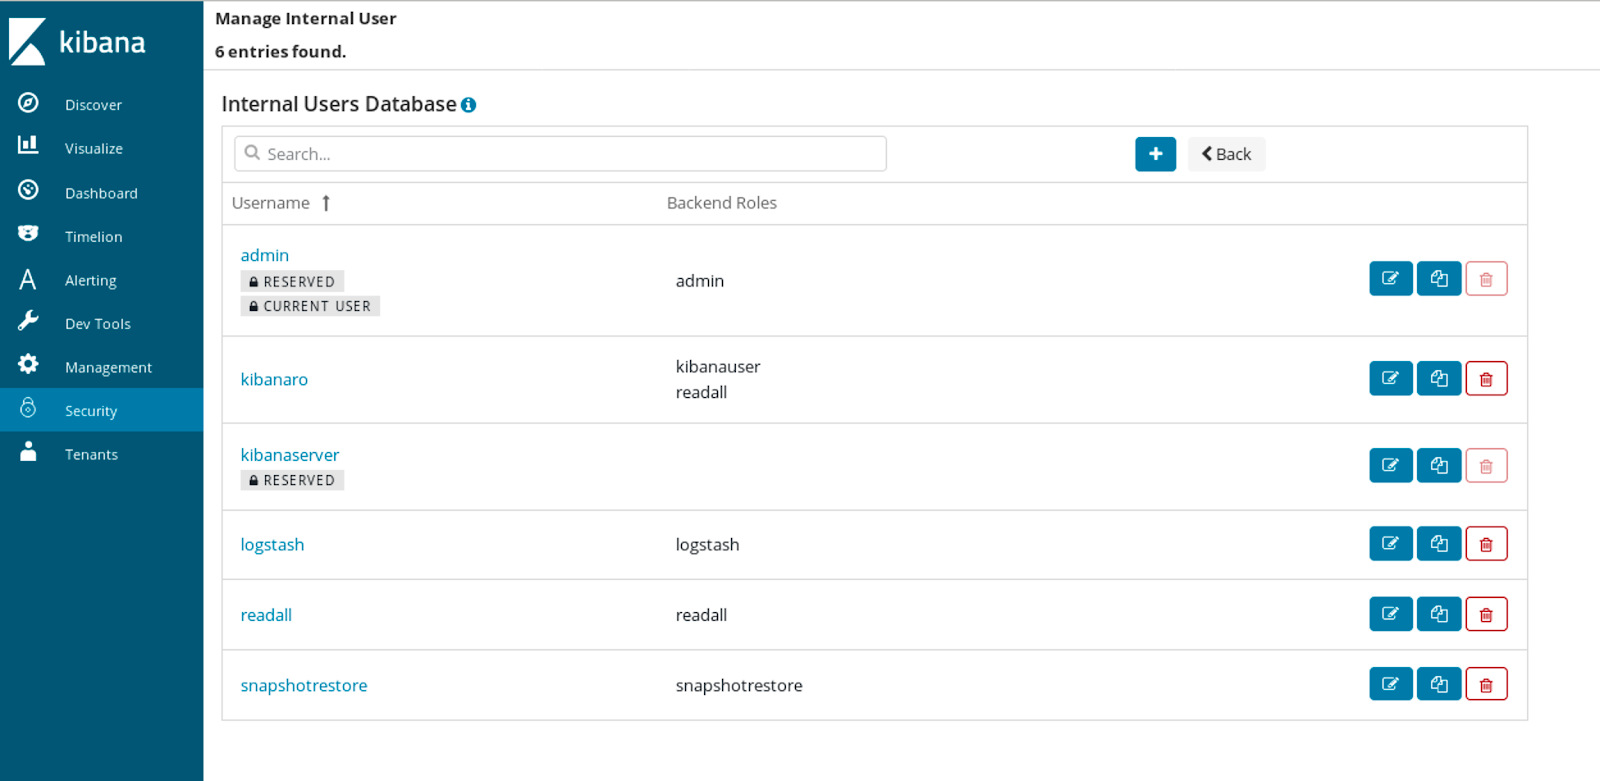
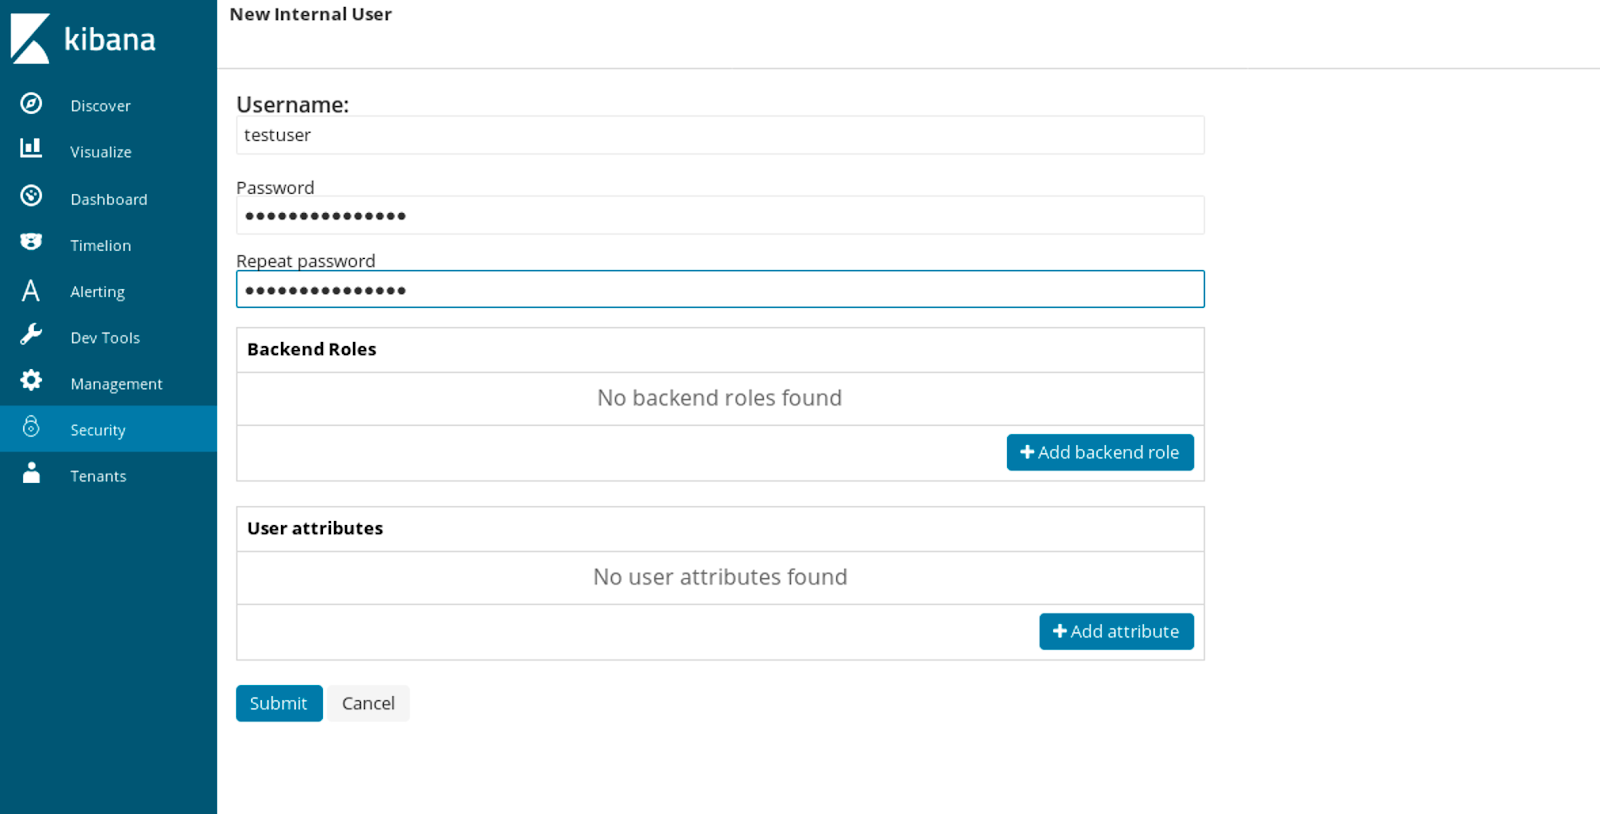
By default, there are a few users created automatically for us, but be sure not to leave everything as defaults – you want to configure passwords for example, so that you don’t have the false sense of security.
Roles
Open Distro for Elasticsearch allows us to manage roles. Similar to users we get some of the roles available by default:
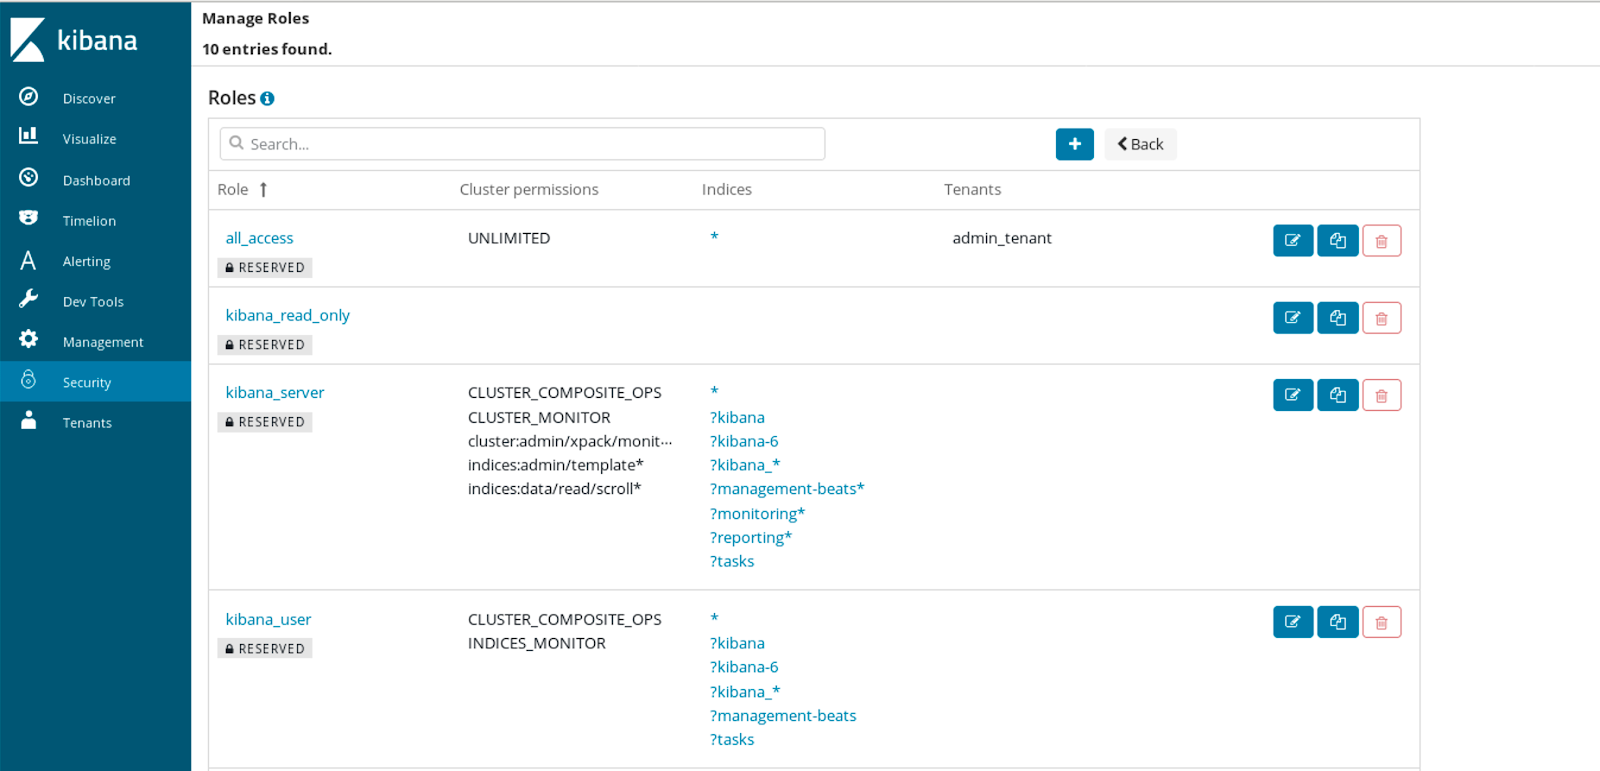
Even though we already have some roles related to index permissions and tenants definitions available, there is more related to roles. To create a new role we start with its name:
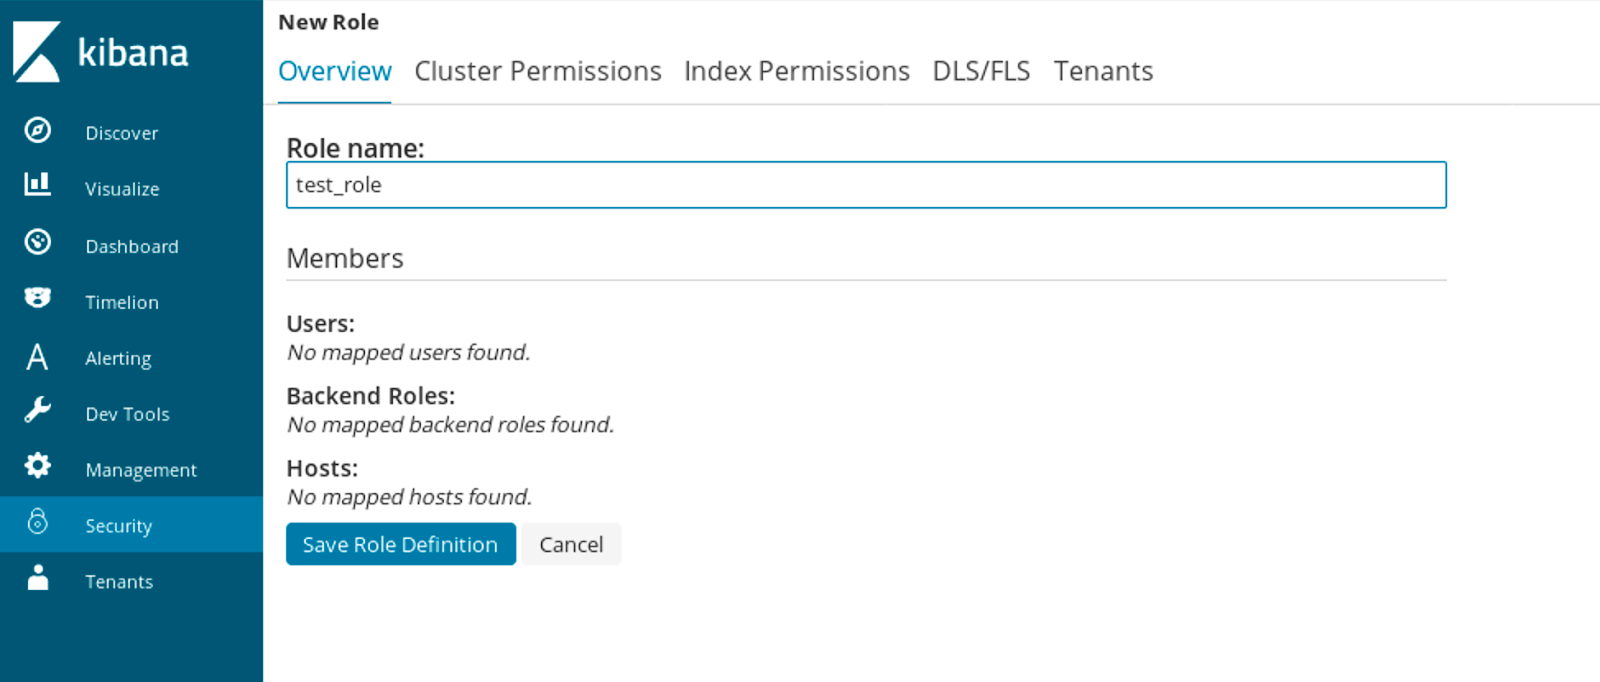
Then we can set cluster permissions:
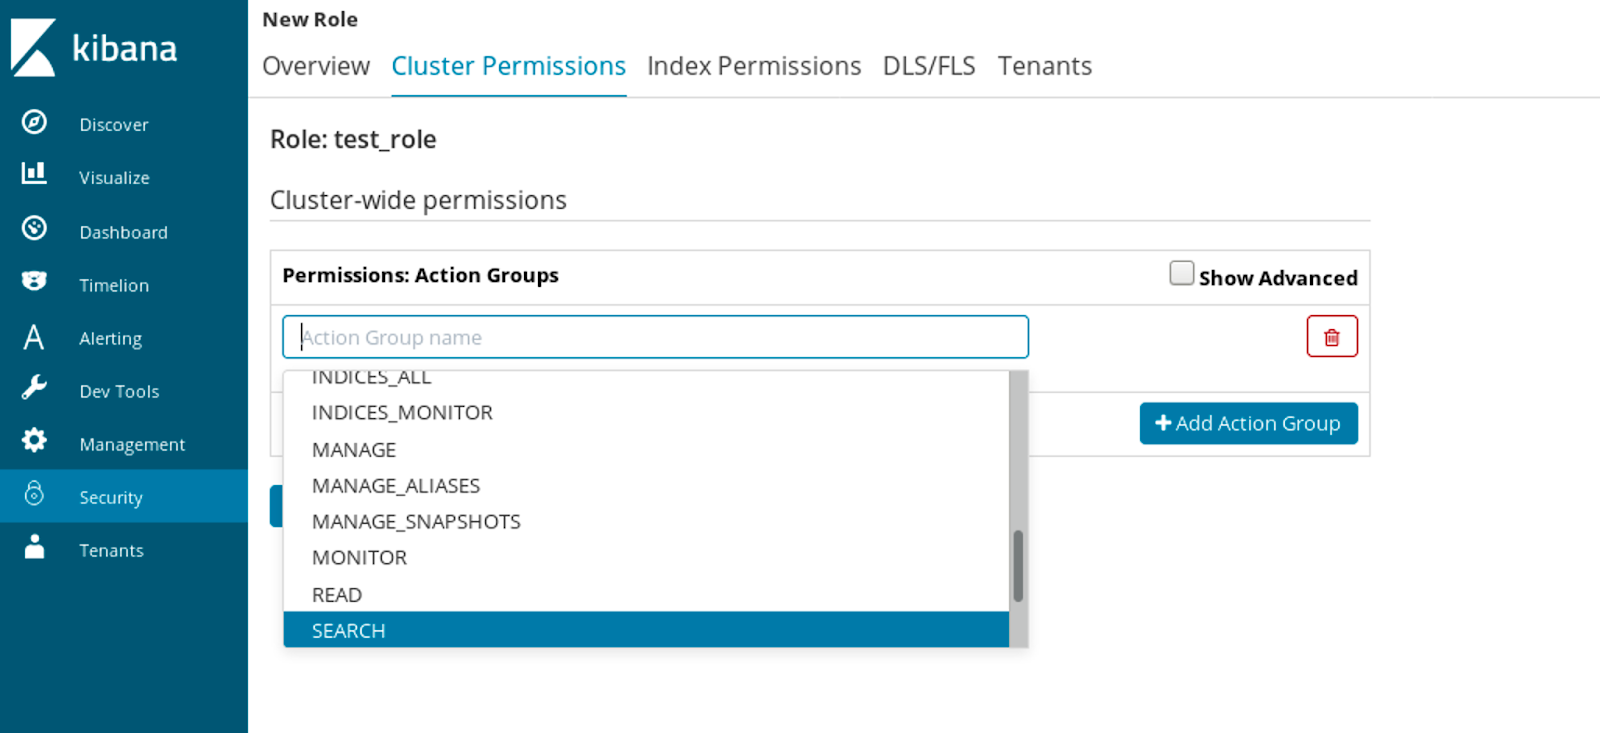
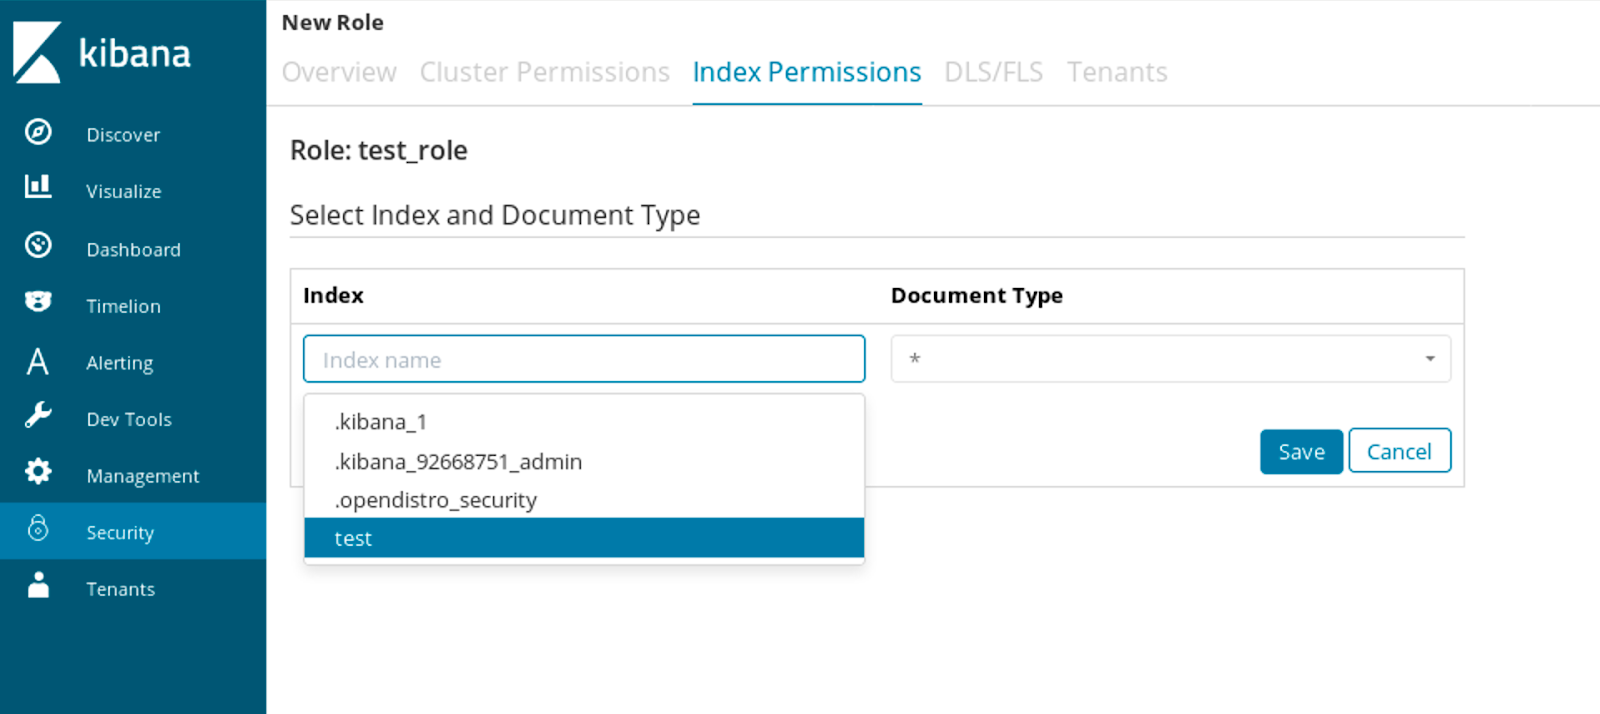
We can also set per index permissions:
Things get very interesting when we get to document and field level (the DLS/FLS) section of the role creation:
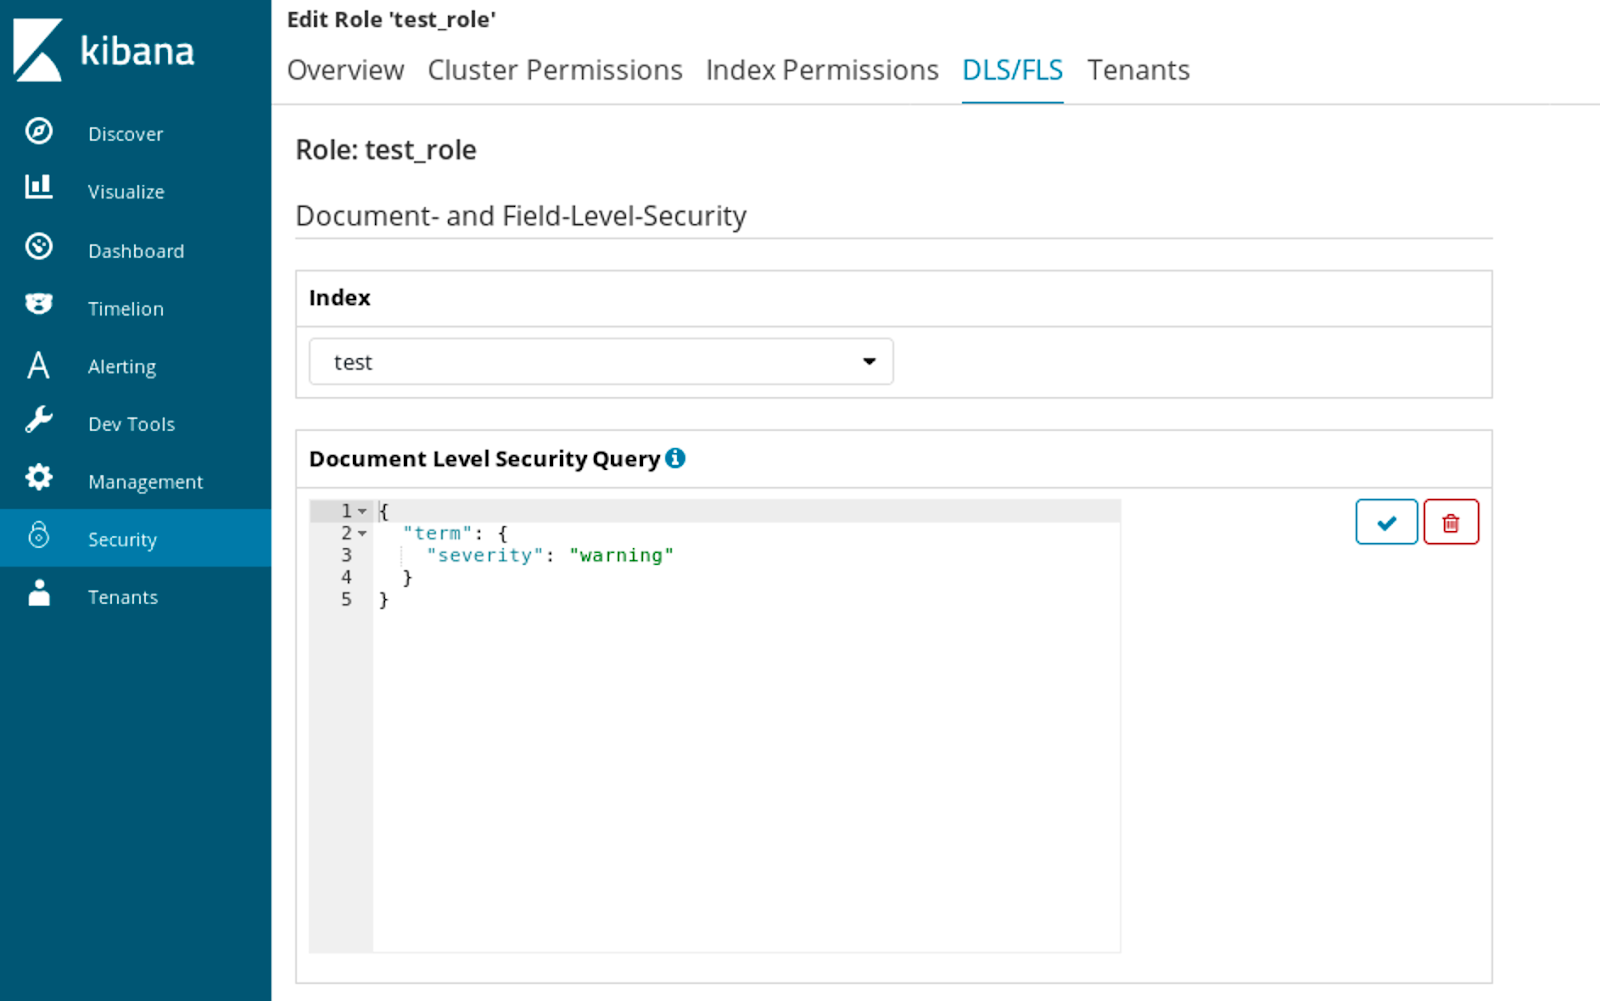
Here we can configure that for the given index a certain query will be used to limit documents that the user with the assigned role is allowed to see. Like in the above example, a user with that role would only see documents matching the warning severity. The crucial thing here is that the query approach to security does not require us to re-index the data. It only requires a proper Elasticsearch DSL based query.
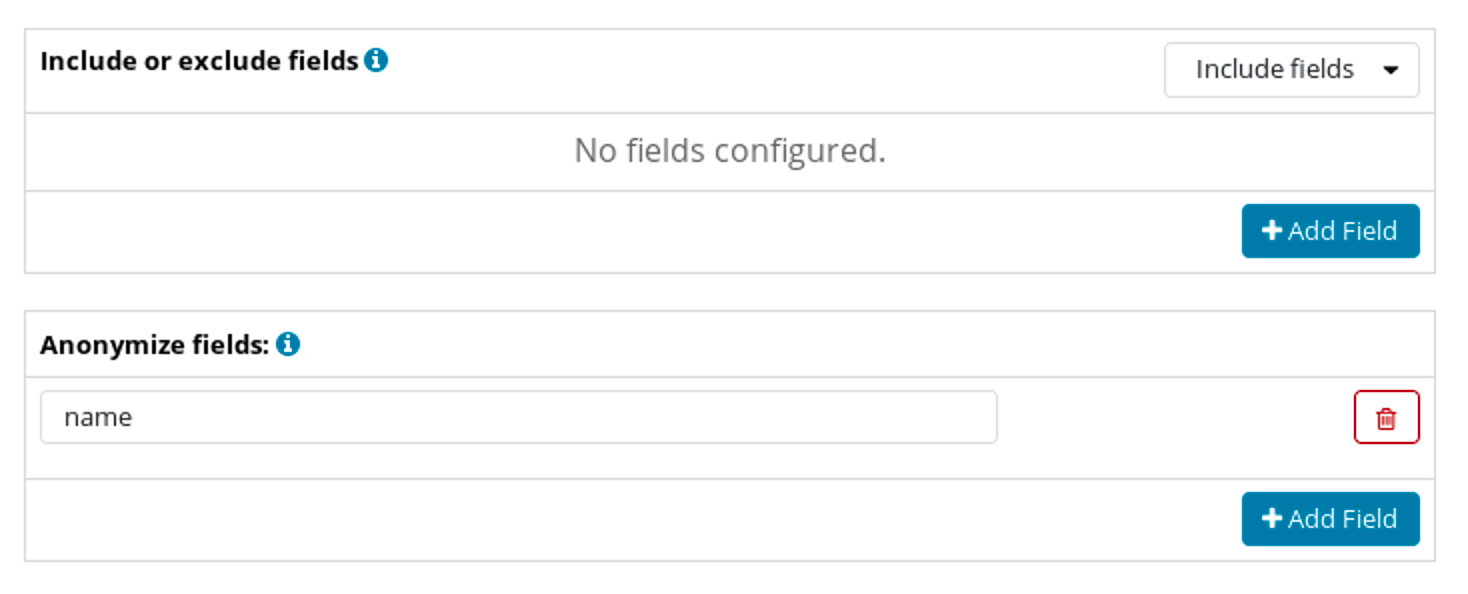
We can also set which fields we want to include in the document or which fields we want to exclude from the document if we need only a subset of fields visible. Finally, we also have the ability to anonymize the data by including a list of fields that will have their content replaced:
With such configuration, if users with our test_role role were to run the following query:
$ curl -XGET -k -H 'Content-Type:application/json' -u test:test123 'https://localhost:9200/test/_search?pretty' -d '{
  "size" : 1,
  "query" : {
    "match_all" : {}
  }
}'
In response they would get a limited document set with anonymized data:
{
  "took" : 5,
  "timed_out" : false,
  "_shards" : {
    "total" : 5,
    "successful" : 5,
    "skipped" : 0,
    "failed" : 0
  },
  "hits" : {
    "total" : 15,
    "max_score" : 1.0,
    "hits" : [
      {
        "_index" : "test",
        "_type" : "_doc",
        "_id" : "4U82lmkBEcOnKl7BxAE3",
        "_score" : 1.0,
        "_source" : {
          "severity" : "warning",
          "name" : "55c49ba553a5abdfec400ffb424d34692815a94186ca5aa6d4b59f3f4fe9260e",
          "timestamp" : "2019-03-15T16:24:00+01:00"
        }
      }
    ]
  }
}
While the admin user running the same query:
$ curl -XGET -k -H 'Content-Type:application/json' -u admin:admin 'https://localhost:9200/test/_search?pretty' -d '{
  "size" : 1,
  "query" : {
    "match_all" : {}
  }
}'
Would get all data in its original form:
{
  "took" : 6,
  "timed_out" : false,
  "_shards" : {
    "total" : 5,
    "successful" : 5,
    "skipped" : 0,
    "failed" : 0
  },
  "hits" : {
    "total" : 19,
    "max_score" : 1.0,
    "hits" : [
      {
        "_index" : "test",
        "_type" : "_doc",
        "_id" : "4U82lmkBEcOnKl7BxAE3",
        "_score" : 1.0,
        "_source" : {
          "timestamp" : "2019-03-15T16:24:00+01:00",
          "name" : "Test document",
          "severity" : "warning"
        }
      }
    ]
  }
}
Pretty neat if you ask me.
Permissions
For more fine-grained control, each operation done on Elasticsearch is defined in the Security plugin of the Open Distro from Amazon and we have the possibility of configuring access to certain groups or users. We have Admin APIs, Cluster APIs, and Indices API and we can choose which ones we are interested in via the section for advanced role configuration:
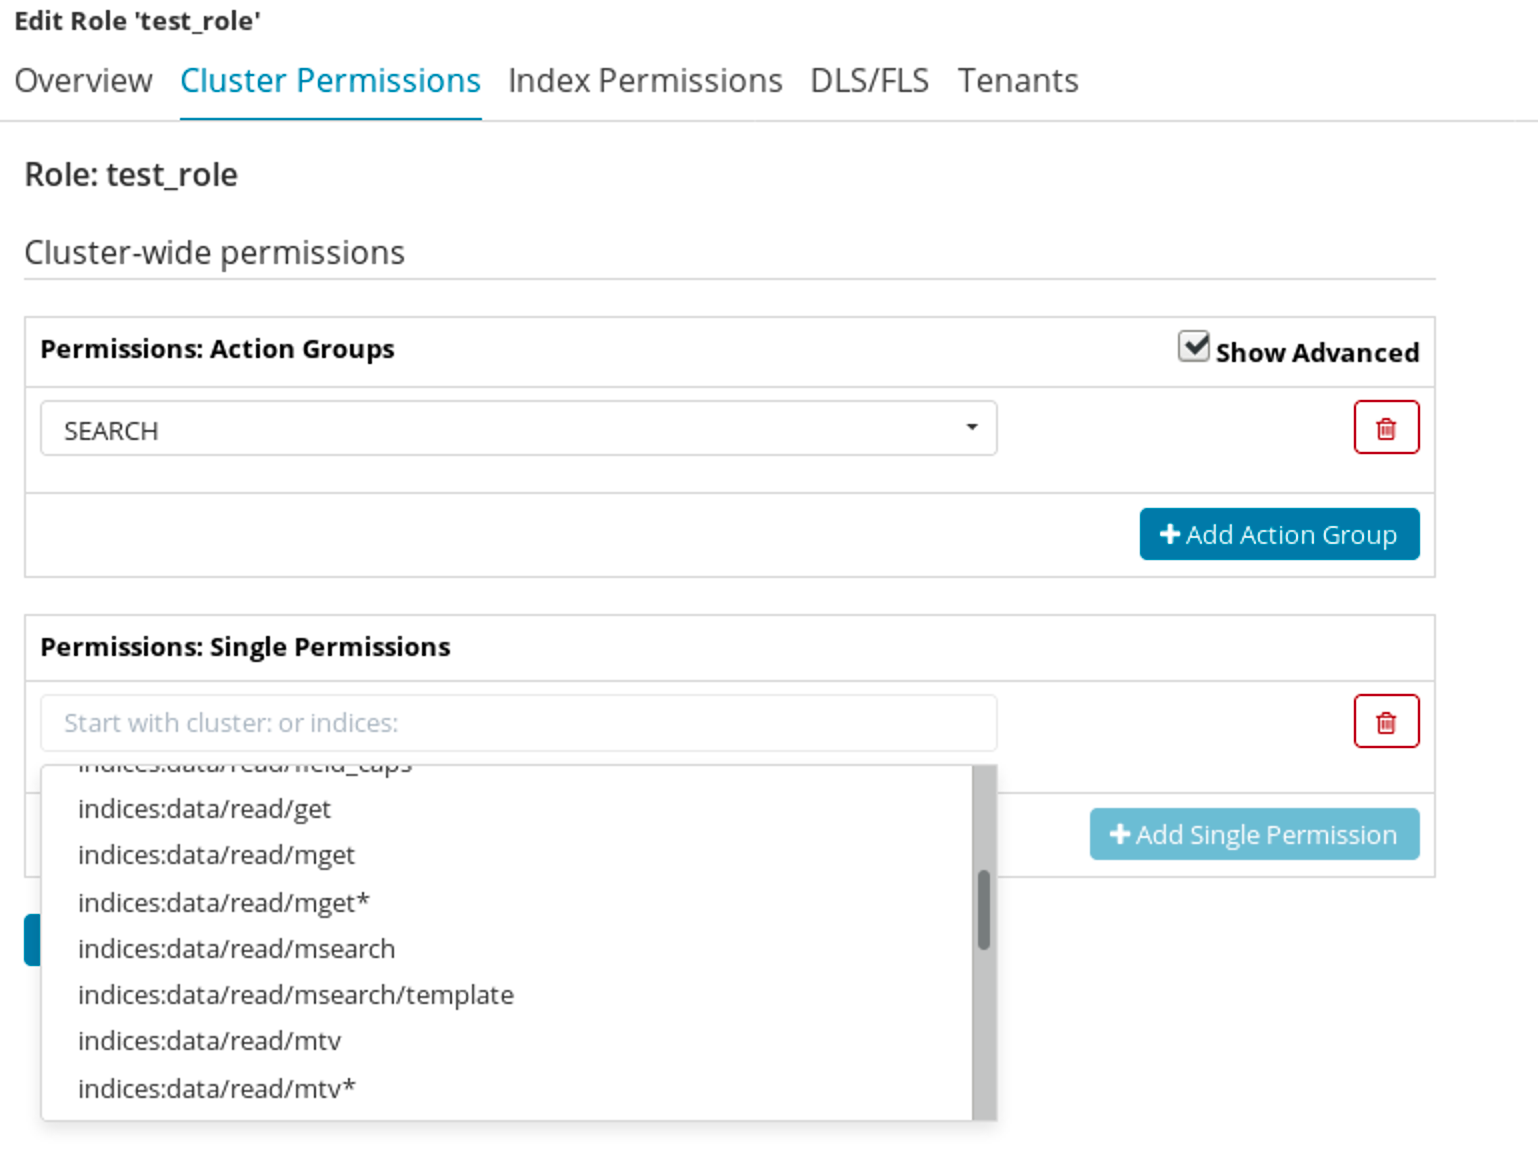
The official documentation includes the full list of defined permissions.
Elasticsearch SQL Support
One of the features that business people may like is the out of the box SQL support and JDBC driver. That means that you can integrate your Elasticsearch instance with your favorite Business Intelligence tool and have your data visible in the same way. You should be aware of the limitations – e.g. the ones that we mention in the Joins Support section of this blog post. What’s more, there are already plugins for Elasticsearch that enrich it with SQL support – e.g. https://github.com/NLPchina/elasticsearch-sql. We will not be focusing on other plugins though and will instead look at how to run SQL queries against Elasticsearch from the Open Distro.
Running SQL Queries
The simplest way to run a SQL query against Elasticsearch from the Open Distro is to include it in the sql request parameter. However, this is not actually recommended. The proper way of sending queries is by running a POST request against the _opendistro/_sql REST handler and passing the query in the request body. For example:
$ curl -k -u admin:admin -H 'Content-Type:application/json' -XPOST 'https://localhost:9200/_opendistro/_sql' -d '{
 "query": "SELECT * FROM test LIMIT 1"
}'
Which will result in a familiar Elasticsearch JSON response:
{"took":16,"timed_out":false,"_shards":{"total":5,"successful":5,"skipped":0,"failed":0},"hits":{"total":37,"max_score":1.0,"hits":[{"_index":"test","_type":"_doc","_id":"ItS1gWkBtIrMzCTpvHD7","_score":1.0,"_source":{
 "name" : "Test document",
 "severity" : "warning"
}}]}}
We can also get a response in a CSV format by adding the format=csv to the request parameters:
$ curl -k -u admin:admin -H 'Content-Type:application/json' -XPOST 'https://localhost:9200/_opendistro/_sql?format=csv' -d '{
 "query": "SELECT * FROM test LIMIT 1"
}'
Which would result in the following response:
severity,name
warning,Test document
We are not limited to running queries with a command line tool. We can also use Kibana and its Dev Tools that comes with the Open Distro for Elasticsearch:
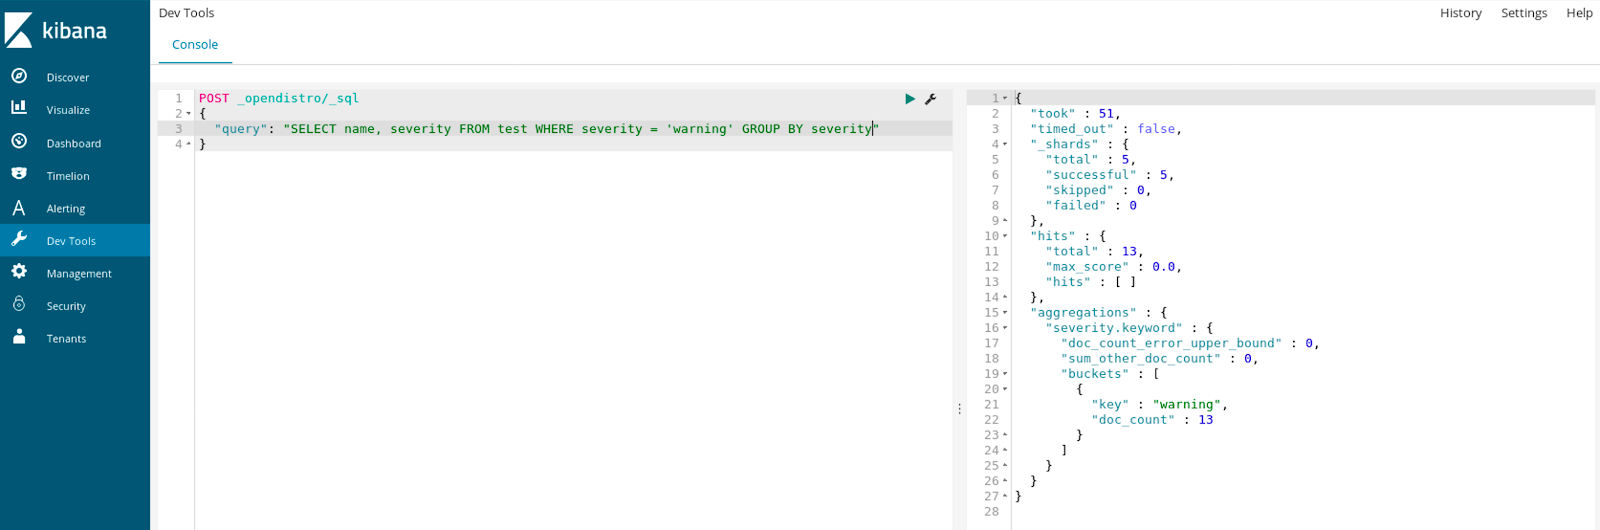
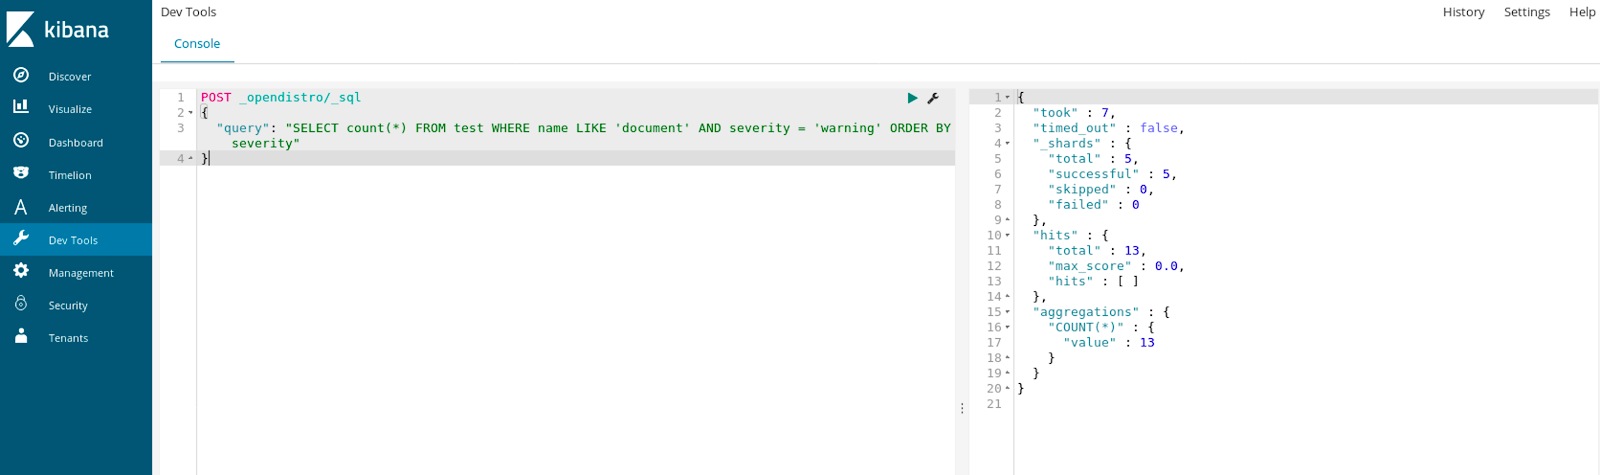
Supported SQL Operations
The list of supported operations is quite extensive. From SELECT, DELETE through WHERE, ORDER BY, GROUP BY, LIMIT and so on. We can add conditions to our queries using, for example, LIKE, AND, COUNT, IN, we can run aggregations like avg, count, max, min, sum or include and exclude fields. Finally, run functions like floor, trim, substring and so on, but keep in mind that they may require fielddata to be turned on to properly work.
The full list of operations that are supported is available in official Elasticsearch SQL docs.
SQL Join Support
Even though Elasticsearch in the Open Distro from Amazon supports inner joins, left outer joins, and cross join, there are a number of limitations you should be aware of. First of all you can’t join data from more than two indices in a single query and you are obliged to use aliases for index names – otherwise, your queries will not work. You can’t use GROUP BY or ORDER BY statements for results. LIMIT and OFFSET are also not supported. Finally, within an SQL ON clause only boolean operator AND is supported.
JDBC Driver
As you may have guessed, SQL support in Open Distro for Elasticsearch means that in addition to being able to run the SQL queries against Elasticsearch we also got the JDBC driver which allows us to use Elasticsearch as a data provider in any tool that uses the JDBC bridge to connect to databases. The JDBC driver can be found on Github (https://github.com/opendistro-for-elasticsearch/sql-jdbc) with full documentation on how to use it. At the time when this post was published the JDBC driver was not yet available in public Maven/Gradle repositories so the only way to have it working is by cloning the Github repository and building it on your own. Luckily, Amazon promises that they will publish the compiled version of the JAR to the public repositories, hopefully soon.
Elasticsearch Performance Analysis
The performance analysis part of the Open Distro for Elasticsearch comes with a new metrics endpoint and a command line tool. It includes various performance metrics for the cluster, nodes, etc. These metrics are independent of the Java Virtual Machine itself, so unlike the standard Elasticsearch metrics APIs, these metrics should be available even when Elasticsearch struggles to provide a response to the normal management REST API calls.
Along with the new metrics there is also a command line tool – PerfTop – that lets us look at the aggregated metrics and see a real-time view of the cluster. Please note that, while handy, PerfTop is not a suitable replacement for a full-blown Elasticsearch monitoring solution. In the initial version, the tool comes with a set of prebuilt dashboards including:
- cluster, network and memory analysis
- cluster overview
- cluster threads analysis
- node analysis
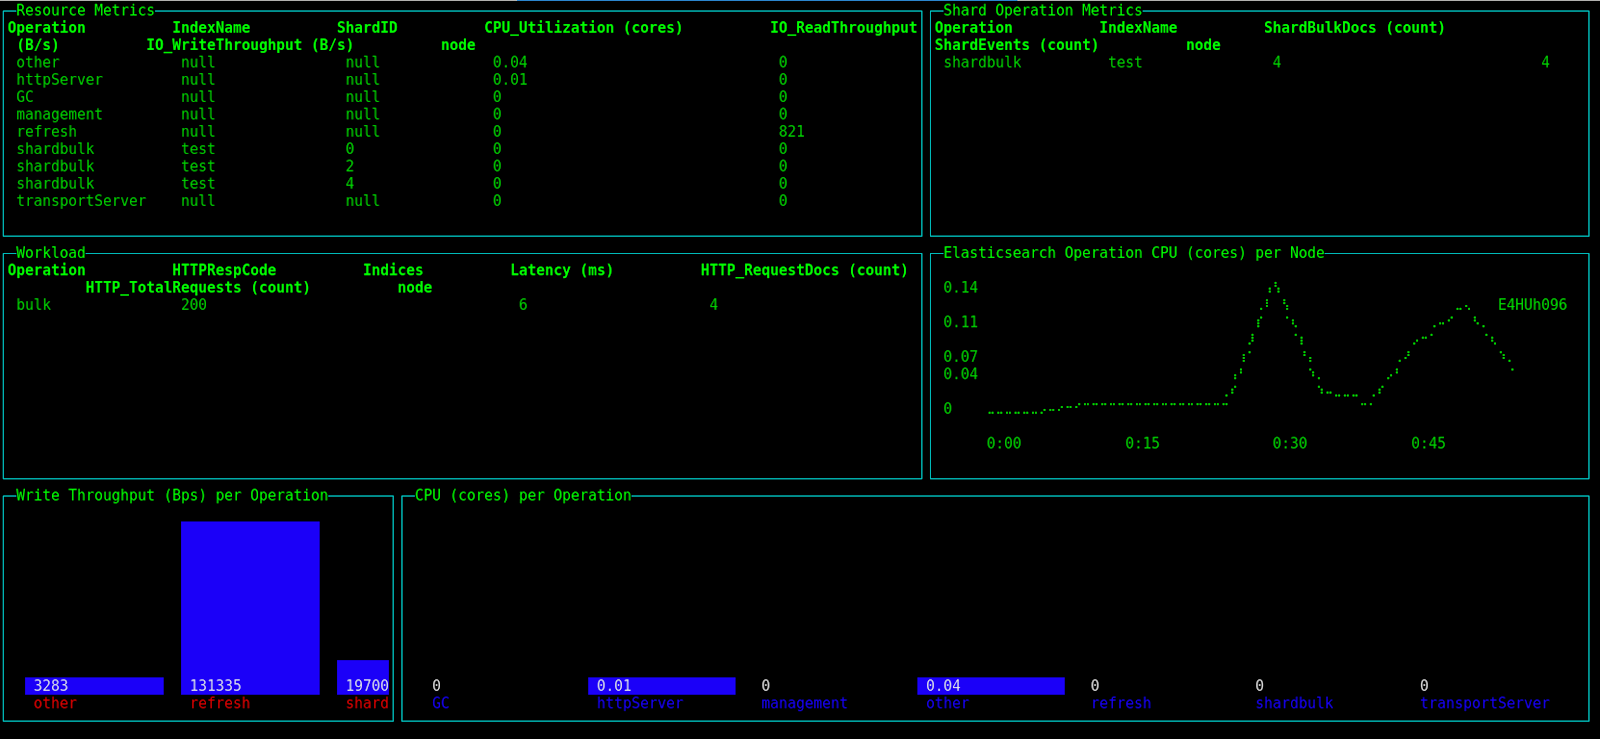
After unpacking the downloaded PerfTop archive just run the following command to start PerfTop:
$ perf-top-linux --dashboard NodeAnalysis
Keep in mind the PerfTop, at least in the initial release, comes with executables for two operating system families – Linux and MacOS.
You get a very nice view in the old-fashioned console-style:
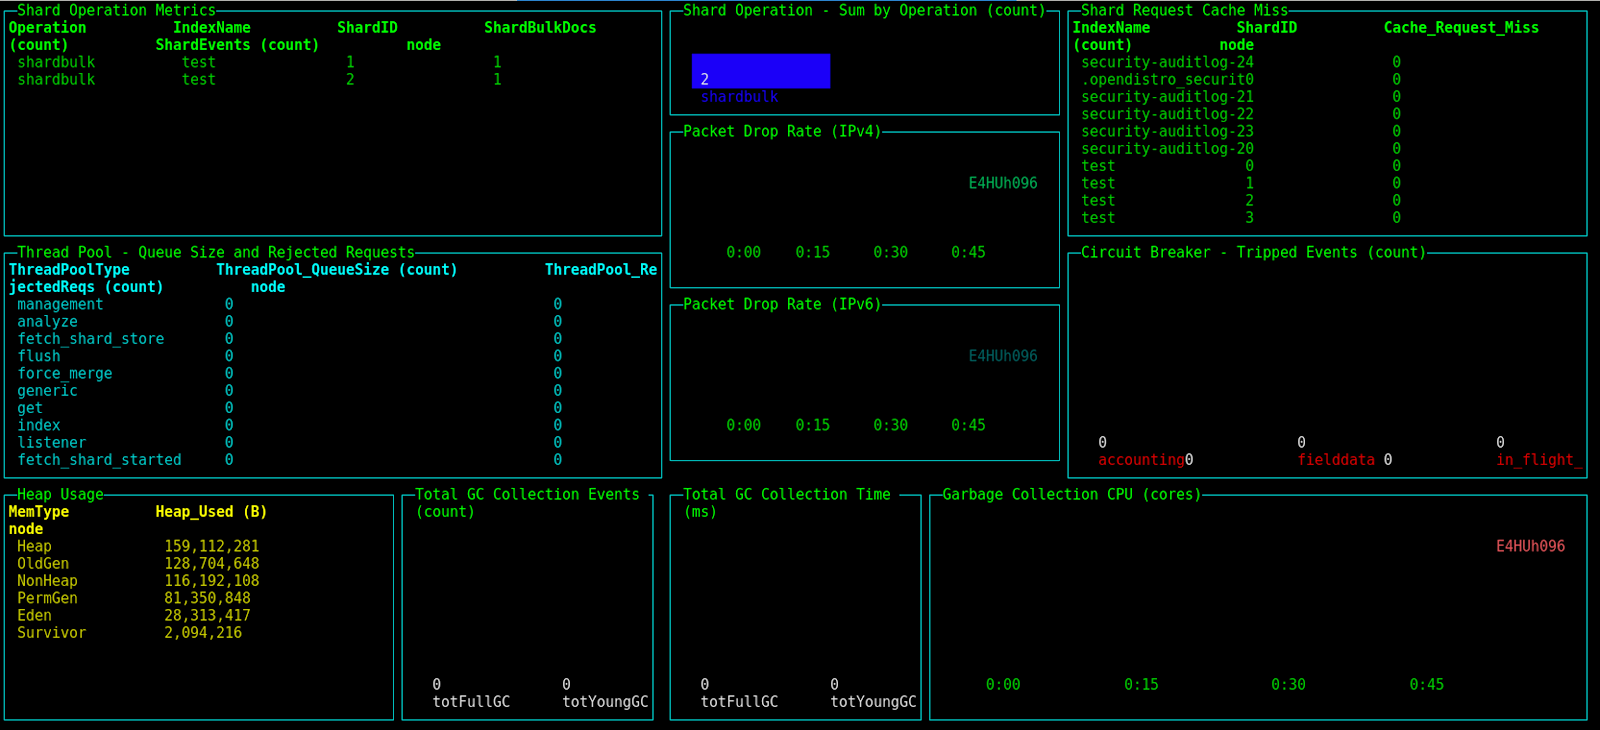
You can also look into cluster information, network statistics, and memory usage analysis by running the following command:
$ perf-top-linux --dashboard ClusterNetworkMemoryAnalysis
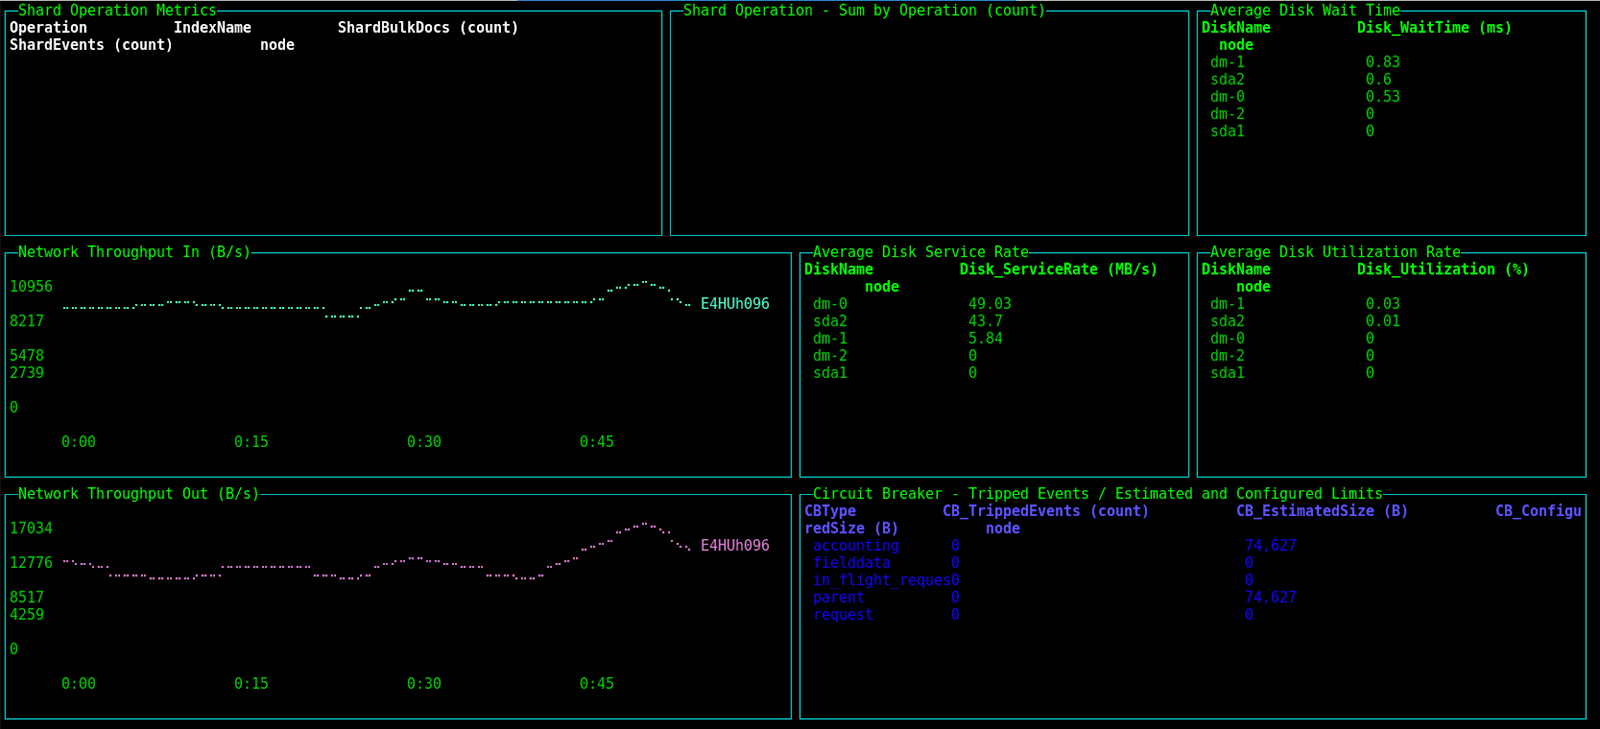
The whole cluster overview giving us basic information about the used cluster is available by using the following command:
$ perf-top-linux --dashboard ClusterOverview
And finally, the last dashboard available with the initial release is cluster thread analysis available by running the following command:
$ perf-top-linux --dashboard ClusterThreadAnalysis
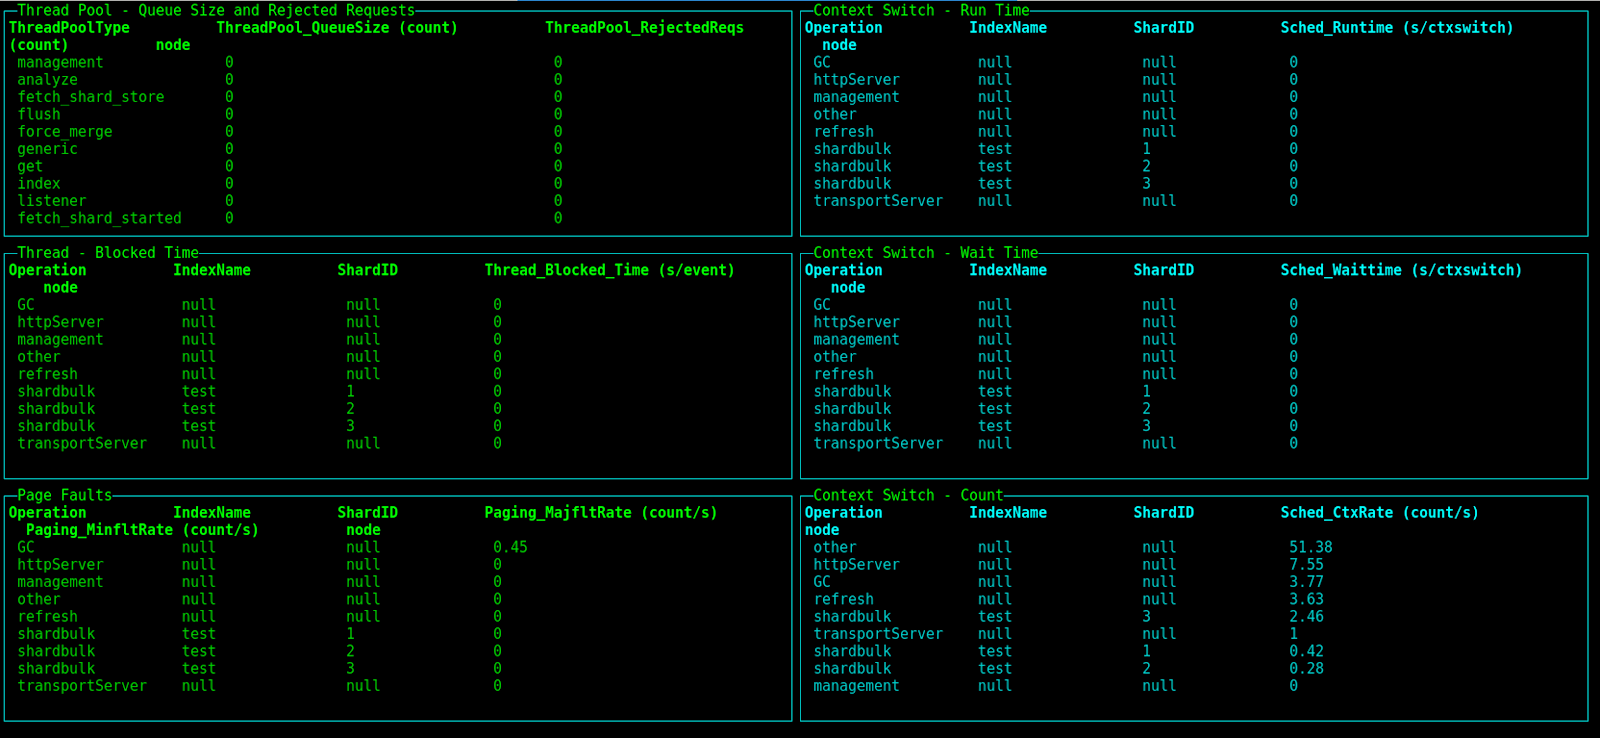
This is handy for taking a quick real-time look at Elasticsearch health and metrics at the cluster and node level. For a full monitoring solution with metrics, alerts and logs all together with access to historical data for comparison and fine-grained analysis have a look at Sematext Cloud and its Elasticsearch monitoring integration. You may also be interested in our Elasticsearch Guide ebook.
Want to learn more about Elasticsearch and the rest of the Elastic Stack? Don’t forget to download the Cheat Sheet you need:
Elasticsearch DevOps Cheat Sheet
Conclusion
In terms of features and cost, Open Distribution for Elasticsearch from Amazon seems like an obvious winner. It’s got nearly all enterprise-grade functionality, it’s open-sourced under a permissive Apache 2.0 license, companies like Sematext provide consulting and support for it, what else could one desire? Well, adoption. It is too early to tell whether the user and development communities will fully embrace it. It is adoption by these two communities that will determine the faith of Open Distribution for Elasticsearch. Another big question the community has is how much this distro will lag behind the version from Elastic and whether, in fact, Amazon’s distro will actually end up being a fork of Elasticsearch or not. On a more technical level, we don’t yet know what upgrades will look like, how much effort might be involved in swapping distributions, etc. One thing is certain though – we’ll definitely be keeping an eye on Open Distribution for Elasticsearch from Amazon.