By popular demand…we’ve just added some new goodness to SPM with the SPM REST API. This new API lets you:
- create SPM Apps for monitoring (e.g. generate a new SPM App + its token during deployment)
- list all existing Apps including token, App type, user roles
- list all available metrics and charts for a specific App
- list all alerts defined for some app (threshold, anomaly or heartbeat)
- create new alerts (of any type: heartbeat, threshold, anomaly)
- enable/disable or delete individual alerts
- trigger e-mail reports on demand (e.g. after running unit or benchmark tests)
As you can tell from the above, we started by exposing APIs for SPM Alerts first. Of course, we’ll be expanding the API to expose more SPM functionality, as well as Logsene. You can see all the details — including Listing Alerts, Creating, Disabling and Deleting Alerts, Metrics API, and more are on our wiki.
Alert Creation Designer
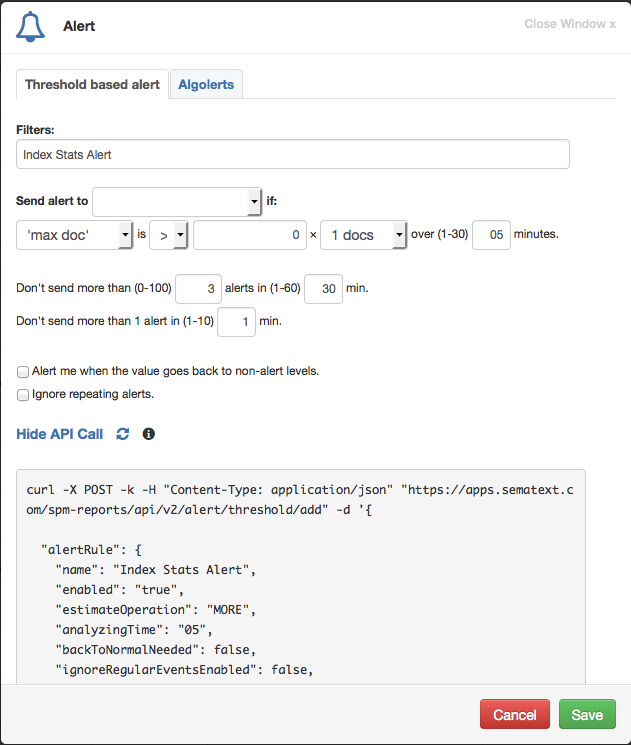
One feature of SPM Alerts HTTP API that we do want to call out here is the Alert Creation Designer. The easiest way to prepare alert rules to be used in API calls is by using the Create Alert dialog available in SPM.
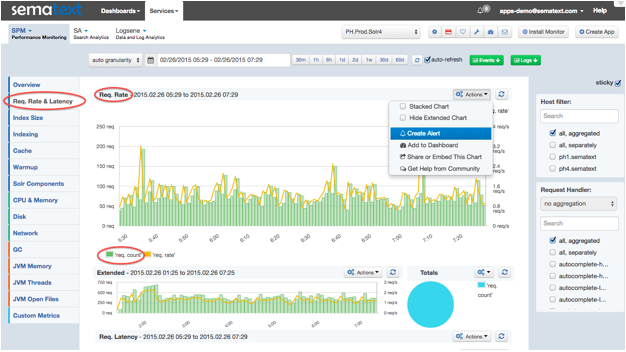
In the example below we use Solr’s req. count metric, whose chart is under the Req. Rate & Latency report, as shown in the screenshot below.
Above every chart in SPM there is a little pull-down menu. From there simply click on the Create Alert option to open the Alert dialog seen below. A new “Show API Call” link is shown at the bottom of the dialog. Once clicked, it displays the API call as a “curl” command line. You can modify attributes shown in the dialog and update the API call details by clicking on the little Refresh icon. Once you’re happy with alert rule parameters you can copy the curl command and execute it from the terminal.

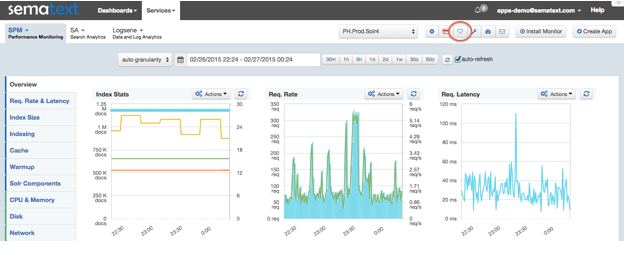
Finally, for Heartbeat Alerts, you would just click on Heart icon on any report (as displayed below) to open a similar dialog:
Typically, you would prepare your alert templates this way once, and then just tweak them remotely (for example, just use different token parameter to get it applied to your other apps, adjust metric names, thresholds, etc.).
Would this make your life easier?
If this functionality looks like it will make managing alerts more efficient, then check out a Free 30-day SPM trial by signing up. There’s no commitment and no credit card required. SPM monitors a ton of applications, like Elasticsearch, Solr, Hadoop, Spark, HBase, Kafka, Storm, Cassandra, Node.js & io.js, and more.

