Color Guidelines for Conditional Coloring
Welcome to the Color Usage Guidelines for Conditional Coloring in Sematext. These guidelines are designed to help you create clear and effective visualizations while ensuring accessibility for all users.
While we provide best practices and recommendations, please remember that you can customize your experience to your liking.
By following these guidelines, you can maintain consistency and clarity in your charts, ensuring that your data is presented in the most meaningful way possible.
Color Usage
In Sematext, the effective use of colors is essential for conveying data insights clearly.
Here are some best practices to follow when using colors in your charts:
Purposeful Color Application
Colors should have a clear and meaningful purpose in your charts.
Consider what each color represents and how it aids in user understanding.
Avoid using colors indiscriminately or for purely decorative purposes.
Neutral
| Examples | Elements | |
|---|---|---|
 |
When to Use: Neutral grey is primarily used for non-essential or neutral elements in your charts. It helps create a visual hierarchy by distinguishing between critical and less important information. Examples of Use: You can use grey for background elements, gridlines, or non-essential labels. It can also be used for secondary data or data that is less important in a specific context. |
 |
Informational
| Examples | Elements | |
|---|---|---|
 |
When to Use: Blue is employed to convey general or informational content. It is suitable for data that does not require immediate attention but provides context or supplementary details. Examples of Use: Use blue for labeling axes, legends, tooltips, or annotations. It can also represent data points that are informational rather than alerting. |
 |
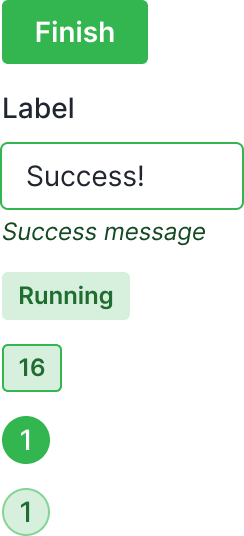
Success
| Examples | Elements | |
|---|---|---|
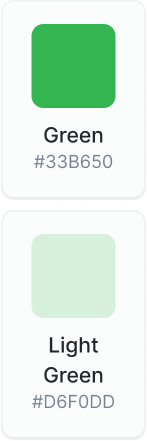 |
When to Use: Green indicates successful or positive outcomes. Use it to highlight instances where everything is functioning as expected or when goals have been met. Examples of Use: Employ green to showcase performance metrics meeting or exceeding targets, or to denote systems operating efficiently. |
 |
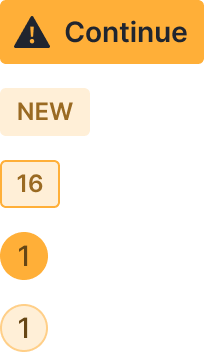
Warning
| Examples | Elements | |
|---|---|---|
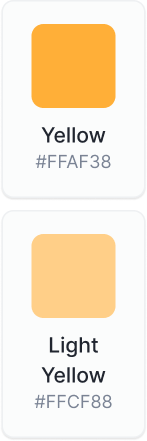 |
When to Use: Yellow signifies a warning or a state that requires attention. Use it when there are potential issues or conditions that need monitoring but are not yet critical. Examples of Use: Yellow can be used to highlight approaching thresholds, potential performance issues, or conditions that may lead to problems if not addressed. |
 |
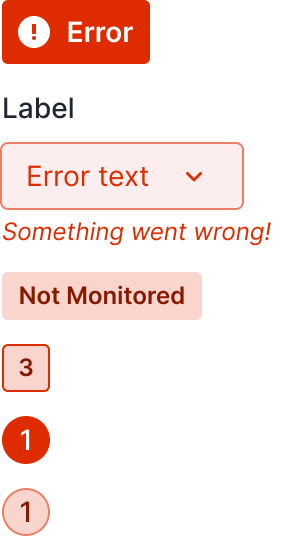
Error
| Examples | Elements | |
|---|---|---|
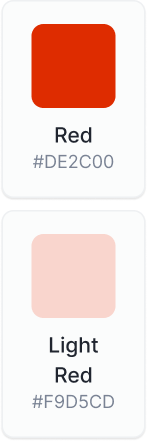 |
When to Use: Red represents errors or critical issues that demand immediate attention. Use it for situations where an urgent response is required to resolve problems. Examples of Use: Red is suitable for indicating system failures, outages, security breaches, or other critical issues that require immediate action. |
 |
Color for Highlighting
Use colors to highlight specific data points, trends, or anomalies.
Highlighting can draw attention to critical information, making it easier for users to identify key insights at a glance.
Color Consistency
Maintain consistency in your color usage throughout the App.
For example, if you use green to represent success in one chart, continue using green consistently for success in other charts and visualizations.