Settings
The settings include:
- inviting new users to your App
- authorizing public IPs to send data to your app via syslog
- adjusting data retention time, daily volume, and limits
- changing your App's plan
- checking how much data is, or has been shipped to your App
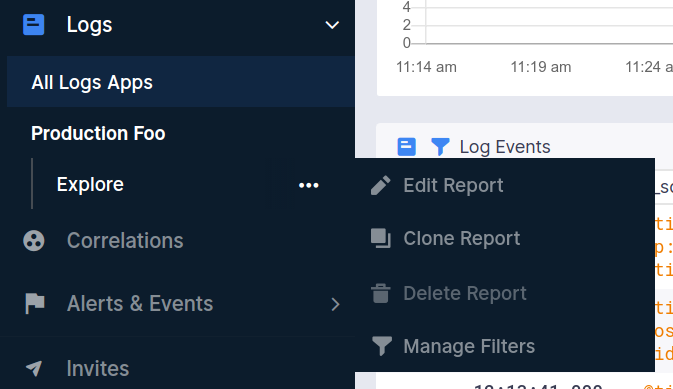
Side Navigation
The left navigation menu provides access to all primary product areas and features, organized into functional categories. When you click on Logs, you will see a list of your Logs Apps. Selecting any Logs App opens a contextual sub-menu that contains actions and sections specific to that Logs App.
Sub-level sections for a Logs App include:
Reports
Provides out-of-the-box reports based on the selected integrations. You can also use the + Add Report button to create custom reports tailored to your Logs App.
Alerts
The Alerts. section shows recently triggered alerts for your Logs App. It also includes Alert Rules, where you can view, manage, and create new alert rules to get notified based on log patterns, thresholds, or anomalies.
Setup & Configuration
This section contains all options for shipping logs to your Logs App, including:
- Installing the Sematext Agent on additional hosts
- Configuring log shipping from discovered log sources on existing hosts without additional installation
- Manual log shipping methods such as the Sematext Logs API (compatible with Elasticsearch and OpenSearch), integrations with syslog-ng, rsyslog, Logstash, Fluentd, and other popular log shippers, as well as language-specific logging libraries and frameworks.
It also includes:
- Logs Pipelines – Define and manage Logs Pipelines to parse, filter, enrich, transform, or route logs before indexing.
- App Settings – Configure App level settings such as retention, data access, integrations, and general preferences.
Tools & Resources
- Custom Dashboards – Build and manage dashboards to visualize and aggregate your logs using the Chart Builder.
- Troubleshooting – Tools and guidance to help diagnose log ingestion issues.
- Documentation – Direct access to relevant documentation, guides, and examples for working with your Logs App.
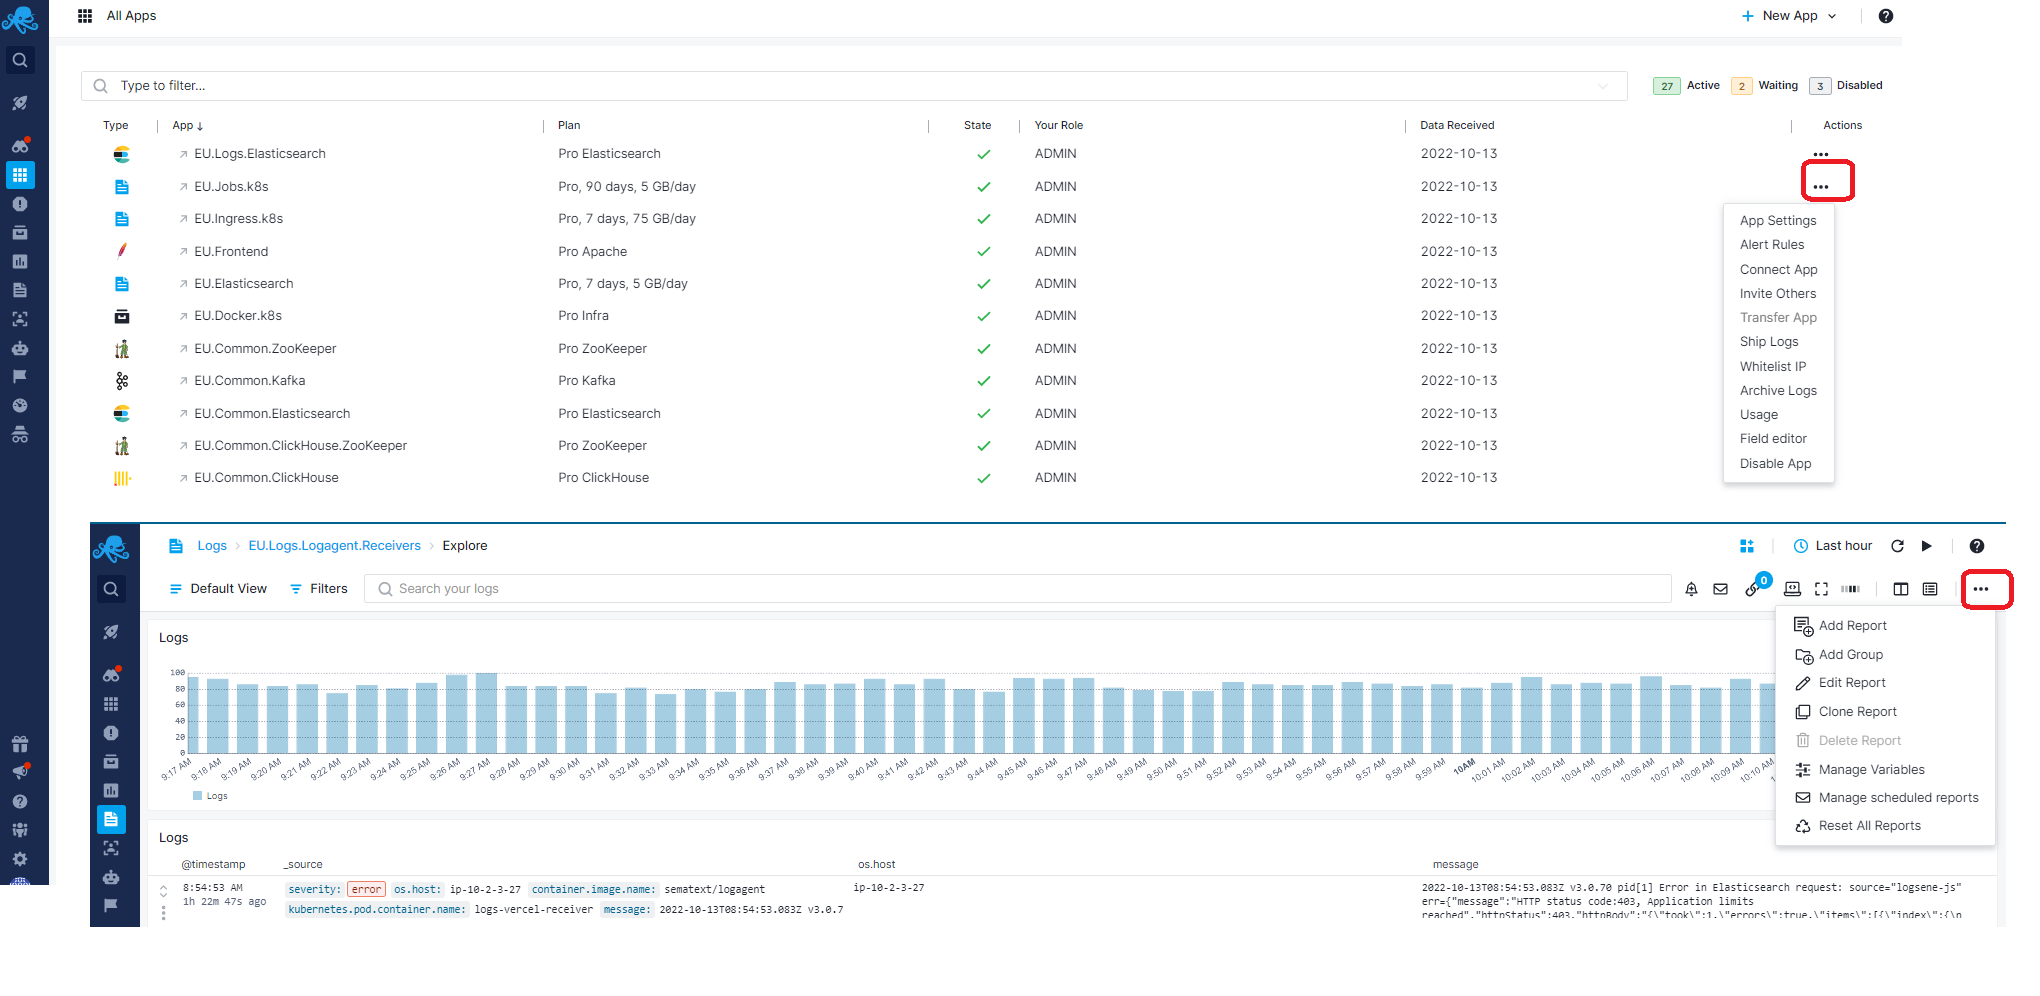
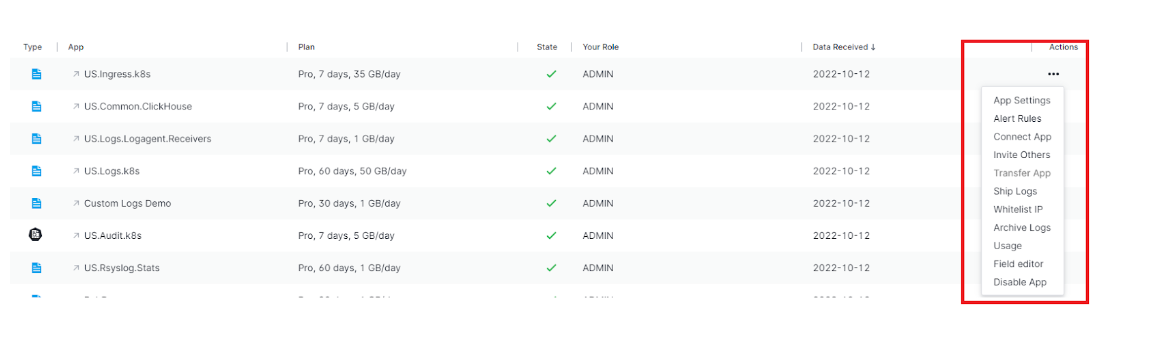
App Actions
The Logs App view allows for easy interaction between various App settings. From the App Actions drop down menu, the horizontal elipsis icon shows your App options and lets you open various App-specific function, like, App Settings, alert rules, connect App, invite team members, ship logs, whitelist IPs, archive logs, see usage, and transfer App ownership.
Report Selector
Once you create a Logs App, and start shipping data, you will get a default Report created for you named Explore. It will have the default data and default component configuration. You can edit this Report, clone it, or create new ones.
Report Settings
- Report Actions - Your customized logs report can be better described using meta name and description, and you can assign a unique URL Alias to identify that report.
- Legends Position and Extended Charts features - Except in the default overview mode, each report can have legends for each metric name, arranged below, to the left, or hidden entirely for better chart interaction. Extended charts are also displayed below and provide a comparative view into a longer time span relative to the time frame displayed in the main chart. Just like report legends, the extended view can be hidden and only the chart with X and Y values will be displayed.
Logs Search and Report Menu
Alerts and Logs are integrated into a single reports pane, and used to search logs, create alerts for anomalies, and much more.
Our log management platform gives you the ability to create your own queries through Sematext API which is compatible with both Elasticsearch and OpenSearch query DSLs. It offers rich, yet simple query syntax very much like the query syntax used by Google.
You can also create and integrate alerts with commonly used collaboration and messaging software such as Hipchat, Slack, Big Panda, PagerDuty, VictorOps, OpsGenie or simply by using your email address(es). Use these services to continuously monitor large volume of data and logs, and ensure that you are alerted in time.
Integrations
You will need to install a Log Shipper or Library so data can be shipped to your Logs App. This section will guide you through installing and running a Log Shipper.
Please refer to the Integrations documentation pages for particular tech you wish to monitor. Learn more about how to monitor various programming languages, operating systems, containers (Docker, Kubernetes, Mesos), Cloud IaaS / PaaS services, iOS, Android, AWS EC2, AWS s3, and how to integrate log management with log shippers. You'll find detailed information on how to install and configure different agents required to start sending your logs and metrics data to Sematext Cloud there.
The next section describes the Logs reports & components and help you discover how to add new components, correlate your logs and events with your Logs App, do report specific actions, connect your Apps and more.