Creating Experience Alerts
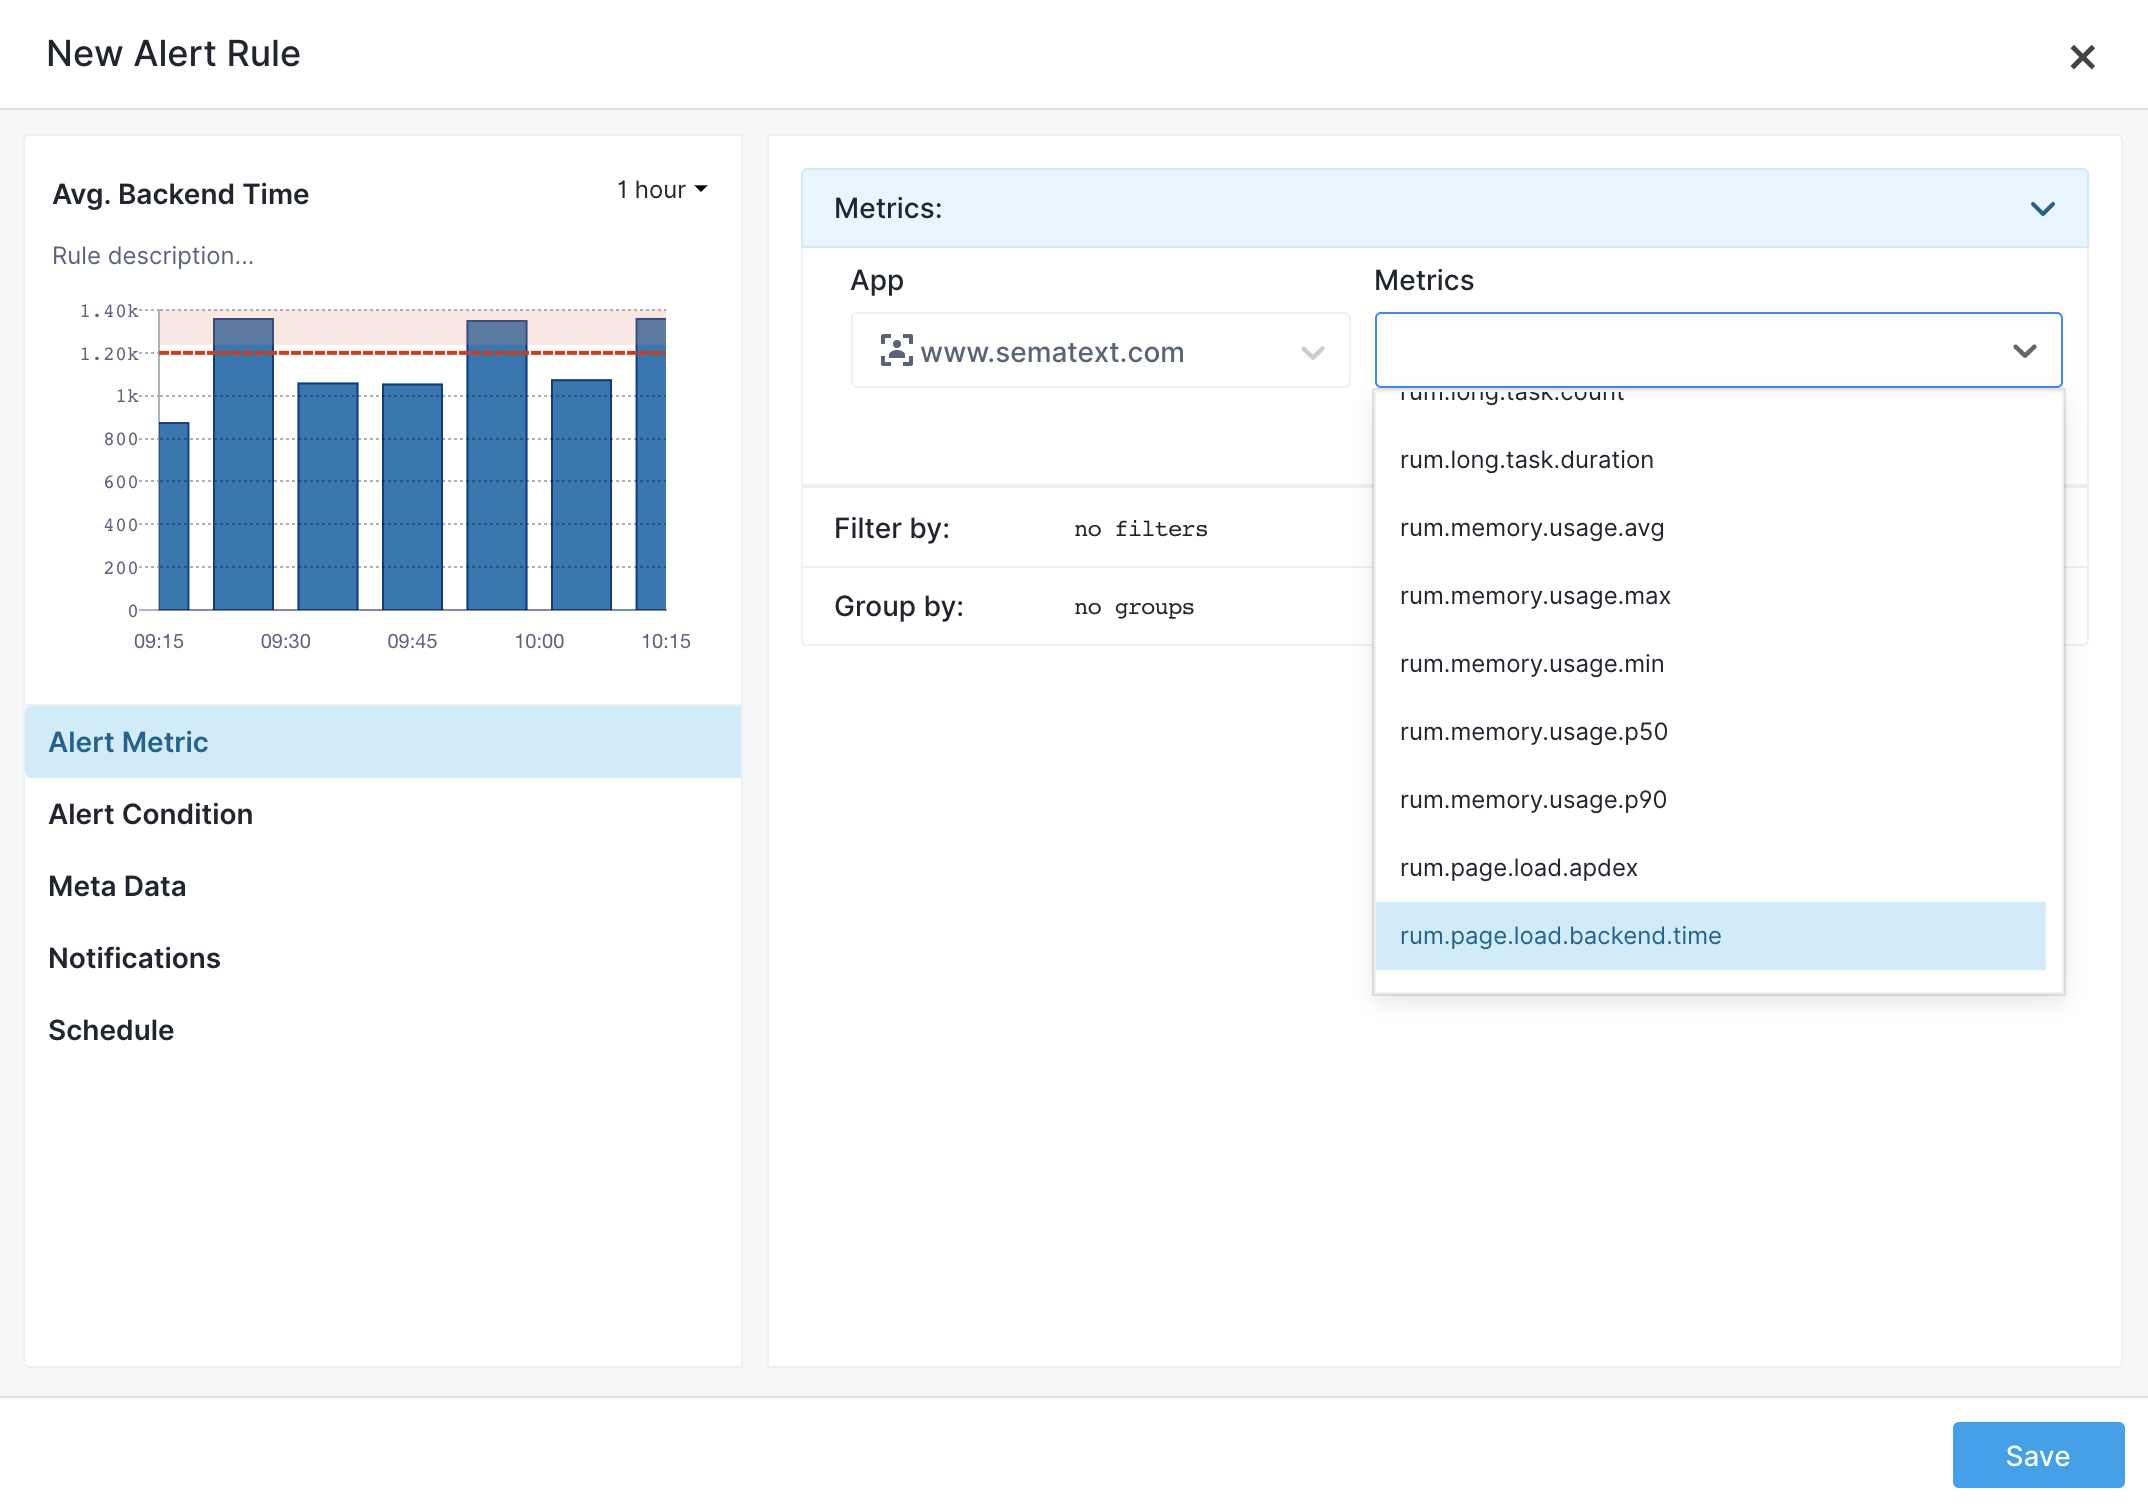
Each Experience App metric that you can create alert rules on has a bell icon that, when clicked, shows a dropdown menu listing the metrics that you can choose.
Supported Experience metrics
- Apdex score for Page load
- Apdex score for HTTP requests
- Apdex score for on page transactions
- First contentful paint time
- First paint (FP) time
- HTTP requests count
- HTTP requests load time
- Long tasks count
- Long tasks duration
- Page load backend load time
- Page load frontend load time
- Page load time
- HTTP resource load count
- HTTP resource load time
- HTTP resource transfer size
- User sessions count
- Users count
The above metrics can also be chosen from the alert rule creation dialog:
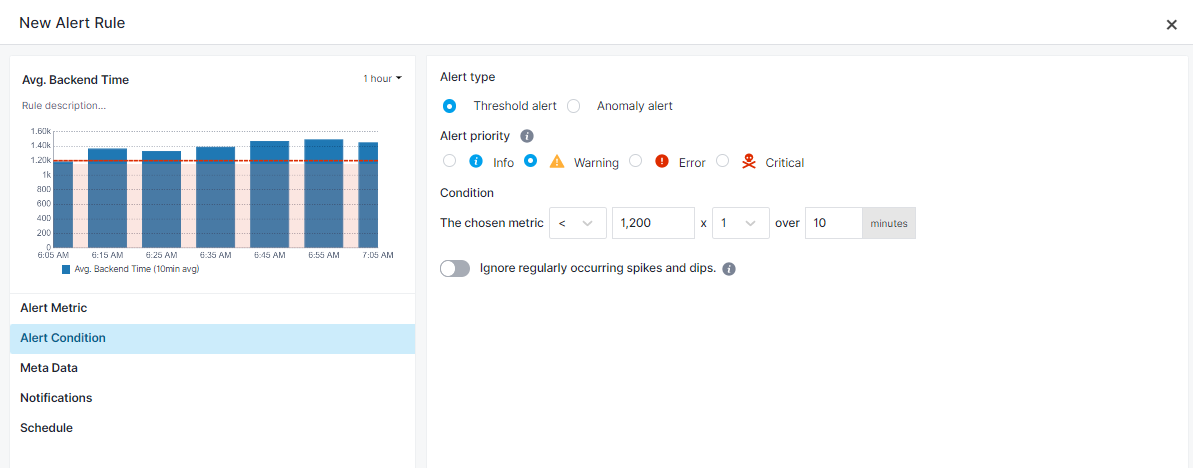
While creating an alert you'll get a chart preview of the alert threshold or anomaly. For example, the preview screen when setting up a new alert rule for the page load time higher than 1200 milliseconds on average would look like the following one:
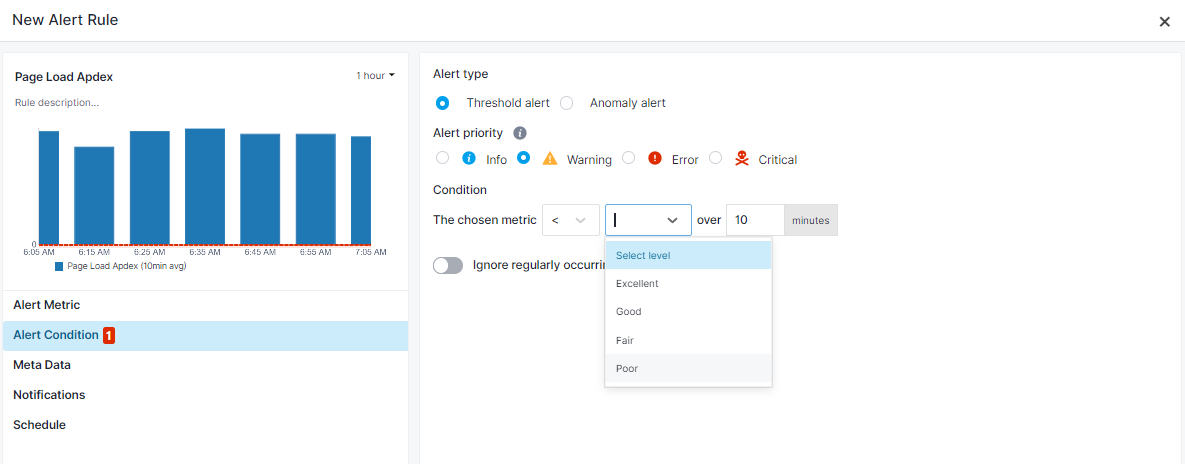
When setting up the Apdex score based alert rule, the threshold can be set to one of the following values:
- Excellent
- Good
- Fair
- Poor
Here's how to setup an Experience alert rule that will be triggered when the HTTP Requests Apdex score remains worse than Good for 10 minutes: